

Recommended
More Related Content
Similar to World Media Trends 2007 Sfn 2007 Extra New
Similar to World Media Trends 2007 Sfn 2007 Extra New (20)
Recently uploaded
Recently uploaded (20)
World Media Trends 2007 Sfn 2007 Extra New
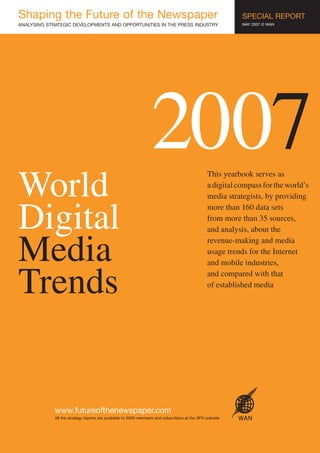
- 1. Shaping the Future of the Newspaper SPECIAL REPORT ANALYSING STRATEGIC DEVELOPMENTS AND OPPORTUNITIES IN THE PRESS INDUSTRY MAY 2007 © WAN 2007 This yearbook serves as World a digital compass for the world’s media strategists, by providing Digital more than 160 data sets from more than 35 sources, and analysis, about the Media revenue-making and media usage trends for the Internet and mobile industries, Trends and compared with that of established media www.futureofthenewspaper.com All the strategy reports are available to WAN members and subscribers at the SFN website
- 2. Shaping the Future of the Newspaper www.wan-press.org A WORLD ASSOCIATION OF NEWSPAPERS PROJECT, SUPPORTED BY WORLD’S LEADING BUSINESS PARTNERS www.man-roland.com/en/p0001/index.jsp A LEADING COMPANY FOR NEWSPAPER PRODUCTION SYSTEMS www.publigroupe.com/en/hom.cfm THE SWITZERLAND-BASED INTERNATIONAL ADVERTISING AND PROMOTION GROUP http://w3.upm-kymmene.com/ ONE OF THE WORLD’S LEADING PRINTING PAPER PRODUCERS www.telenor.com/ THE LEADING NORWEGIAN TELECOMMUNICATIONS, IT AND MEDIA GROUP © WORLD ASSOCIATION OF NEWSPAPERS, 2007
- 3. VOLUME 6 REPORT N° 2 WORLD DIGITAL MEDIA TRENDS TABLE OF CONTENTS Introduction 5 Executive Summary 9 1 The multiple media advertising landscape 15 Introduction 15 Global media revenues market 17 Global advertising spending 18 Advertising spending in North America 19 Advertising spending in the United States 20 Advertising spending in Canada 21 Advertising spending in EMEA 22 Adspend share in the EU 23 Advertising spending in Western Europe 24 Advertising spending in Asia Pacific 24 Advertising spending in Latin America 25 Adspend change in EU, USA and Japan 26 Conclusion 27 Appendix 28 2 Digital media usage trends 39 Media usage trends 39 Internet 44 Mobile 52 Video online 64 3 Impact on newspaper industry 67 Newspapers advertising expenditure 69 News sources 70 Online newspapers users 73 Mobile phones 76 Newsblogs 77 4 Newspaper industry digital trends 81 Internet usage 82 Revenues 82 Video advertising 83 Subscriptions 84 Banner format 85 Mobile revenues 86 Digital content 86 5 Conclusion 89 6 Appendix 93 Links to research content partners 93 3
- 4. MAY 2007 SHAPING THE FUTURE OF THE NEWSPAPER 4
- 5. VOLUME 6 REPORT N° 2 WORLD DIGITAL MEDIA TRENDS Introduction: A digital compass Across the spectrum of industries worldwide, companies for the 21st Century. Around the statistical trends and projections have world, digital media usage and revenue are traditionally served as key ingredients for growing at a double-digit pace, while traditional business plans and new product proposals. media like print, TV and radio develop strongly Business development gurus use this research in numerous countries, though they are coming to plot their long-term strategies and devise under pressure in some mature markets. new products. In the media sector, newspaper companies are navigating the uncharted Meanwhile, the growth of new digital immigrants territories of mobile, Internet and other digital to Internet and mobile is starting to level off in media, armed with data and forecasts from a some parts of the world. For example, the UK- variety of disparate sources. based Informa research company projects that between 2006 and 2011, the number of unique The World Association of Newspapers has mobile subscribers will rise 42.2 percent to almost compiled these important digital media studies 3 billion, but in 2011, the annual growth rate of into World Digital Media Trends to provide a new subscribers will slow to a mere 3.03 percent. digital compass for the world’s media strategists, to assist them in tapping into the By 2004, mobile subscription revenue in the tremendous opportunity of digital media. 30 OECD* countries had reached US$376.6 million. After its heyday in the mid-1990s – World Digital Media Trends, in its inaugural mobile revenue growth rates peaked at 63 year, explores global and regional trends in percent in 1995 – mobile revenue growth digital media for revenue-making, usage started to slow down. Since 2001, it has patterns, and comparisons to that of other remained at less than 20 percent. So the media. The data include projected trajectories mobile phone industry has supplemented of these media trends. subscription rates with a variety of download The mobile and Internet channels represent far- and subscription add-ons, which have made reaching business opportunities to media the telecom industry a more lucrative business. 5
- 6. MAY 2007 SHAPING THE FUTURE OF THE NEWSPAPER Percentage of U.S. adults online % 80 70 60 50 40 30 20 10 0 5 6 7 8 0 01 01 02 02 04 04 05 05 05 06 6 0 3 -9 -9 -9 -9 -0 -0 -0 -0 b- p- n- p- b- e- n- e- p- n- e ly ov ay ug ril ch ay un un un Ja Ja Ja Fe Se Se Fe Se Ju Ap M -M N ar -A -J -J -J g- il- M b- ly ch ay ay ay r Au Ju Fe Ap ar M M M M Source: Pew Internet & American Life Project Surveys, March 2000-April 2006 Meanwhile, in Scandinavia and North slowdown in growth of online advertising in the America, broadband penetration and Internet coming years. While double-digit increases have subscription penetration are tapering off. The been the norm starting with 2002, the trend will implications are clear: As the throngs of new slow significantly after 2008, the IAB/PwC Internet and mobile users plateau, traffic forecasts. growth also will likely slow down. As the From 2008 to 2009, online advertising spending traffic slows, so will revenue growth. growth will likely slow to 9.8 percent from 17.5 Indeed, the Interactive Advertising Bureau / percent, and from 2009 to 2010, the rate will PricewaterhouseCoopers projects a significant slow to 6.8 percent. Global mobile revenue US$ millions 400 376.6 350 332.17 300 279.43 250 256.32 231.64 200 190.65 150 143.8 131.39 100 105.9 72.87 50 44.64 29.10 0 1993 1994 1995 1996 1997 1998 1999 2000 2001 2002 2003 2004 Note : 2003 instead of 2004 data were used for Finland, the Netherlands and Japan. Source: OECD Key ICT Indicators [www.oecd.org/sti/ICTindicators] 6
- 7. VOLUME 6 REPORT N° 2 WORLD DIGITAL MEDIA TRENDS Mobile subscriber growth U.S. online advertising spending by regions growth, 2000 to 2010 Subscriptions Growth (millions) (%) Percent increase/decrease from prior year 1000 02 2005 02 2006 Growth 70 -11.8 2000 900 62 60 -15.8 2001 800 700 56 50 2002 20.9 600 39 40 2004 32.5 500 30 2005 30.3 400 33 300 26 2006 26.8 20 200 2007 15.1 11 12 10 100 2008 17.5 0 0 2009 9.8 Africa Americas Asia Europe Europe Middle US / Pacific Eastern Western East Canada 2010 6.8 Source: Informa Telecom & Media, Mobile Industry Outlook 2007 Source: IAB/PricewaterhouseCoopers data, eMarketer, September 2006 As these media channels mature, the trends in usage patterns also should stabilize over time. Global Internet advertising spend That should make strategic development more (US$ billions) manageable, since consumer targets 2005 2006e 2007e 2008e 2009e presumably will become more predictable. PwC 19.2 22.8 26.1 29.3 32.2 Until then, new segments of the digital Zenith 18.7 24.5 31.3 36.9 42.7 landscape will continue to emerge without Piper Jaffray 22.0 31.2 41.3 51.4 61.3 warning, and many will become popular Sources: Shaping the Future of the Newspaper comparison of 2006 PriceWaterhouseCoopers, Zenith Optimedia, Piper Jaffray statistics havens for users. In the past few years alone, the growth of specialized forms of digital Media markets continue to attract more ad communications include SMS, instant expenditure during the century’s first decade. messaging, online video, podcasting, and However, market share for ad expenditure is blogging. These draw millions of users and shrinking for some media, including contributors worldwide each day. newspapers, as the Internet is pulling a higher According to American Association of percentage of share each year. According to Advertising Agencies research published PriceWaterhouseCoopers, from 2001 to 2010, in 2006, the three fastest growing forms of the global newspaper industry ad spend is Internet media between 2005 and 2006 in projected to grow from about US$100 billion the U.S. are podcasting (20.2 percent), blogs to US$140 billion. Meanwhile, though the (29.6 percent) and video (50.2 percent). Internet ad spend is still small compared to newspapers, its market share is increasing The rapid growth of the digital marketplace has dramatically, from 3 percent in 2001 to 10 created a challenge for multimedia publishers. percent in 2010. Digital media is difficult to track both because of the speed of growth and its fragmented nature. The research chronicled in WDMT runs a While research houses attempt to accurately broad gamut: capture the trends, statistics often don’t jibe with • Ad spending across media channels other published research. For instance revenue • Consumer use of multiple media forecasts can quickly become out of date as the • Mobile phone revenue opportunities marketplace shifts unexpectedly. Some • Simultaneous media consumption discrepancies in data can stem from differences • Youth media consumption trends in research methodology, sample sizes or target • Video online growth groups. Still, the result can be radically divergent • Local online advertising trends. numbers for the same category of research. One example is Internet advertising spend. The World Association of Newspapers Since 2000, actual statistics and projections wishes to thank a long list of esteemed global from a variety of companies have varied widely. and country-specific research organizations Publishers should study these discrepancies in that have shared their data for the purposes statistical trends with a discriminating eye. of this compilation. The World Association 7
- 8. MAY 2007 SHAPING THE FUTURE OF THE NEWSPAPER Global advertising spending and market share, newspapers vs. Internet US$ millions Newspapers ad expenditure (US$ millions) Internet ad expenditure (US$ millions) (%) 160,000 Newspapers market share (%) Internet market share (%) 35 140,000 30 120,000 25 100,000 20 80,000 15 60,000 10 40,000 20,000 5 0 0 2001 2002 2003 2004 2005 2006 2007 2008 2009 2010 Sources: PricewaterhouseCoopers LLP, Wilkofsky Gruen Associates of Newspapers hopes this collection provides We rely on the sources of data and the the reader a clearer picture of the digital generosity of the research houses in order to landscape by analyzing the context of the act on our commitment to bring the widest data, and the opportunities the trends may array of information to our publisher represent. Web addresses have been provided colleagues. so readers can access a wealth of data that To contribute research to this compilation, goes well beyond the published charts in please contact Martha Stone, Director of the WDMT. Further, the World Association of Shaping the Future of the Newspaper project, Newspapers will continue to publish news at mstone@wan.asso.fr items on www.FutureoftheNewspaper.com as new studies appear throughout the year. Web sites can be found on Page 93. The new Web site will provide a variety of * The 30 OECD Countries are Australia, research reports and analysis on issues that Austria, Belgium, Canada, Czech Republic, affect our industry. Denmark, Finland, France, Germany, Greece, WDMT is a work in progress. Next year’s Hungary, Iceland, Ireland, Italy, Japan, Korea, volume will be expanded, with many more Luxembourg, Mexico, the Netherlands, New sources of data. As years go on, we will Zealand, Norway, Poland, Portugal, Slovak continue to illuminate the emergence of many Republic, Spain, Switzerland, Sweden, Turkey, more digital channel frontiers. United States and United Kingdom. 8
- 9. VOLUME 6 REPORT N° 2 WORLD DIGITAL MEDIA TRENDS Executive Summary The media landscape has changed forever. For In order to regain mindshare and market share, media consumers, digitalization has expanded many media companies are launching new the daily media usage options from traditional products on a variety of media channels. The media including print, TV, and radio, to research compiled for the World Digital Media include a vast array of digital choices like Trends show clearly that each individual Internet, podcasting, blogging, interactive TV, consumer demands these new channels in short messaging, instant messaging, video, different ways and at different times. In the digital radio, and much more. final analysis, it behooves media companies to take advantage of the emerging opportunities For media companies, these seismic shifts in in their marketplace by investing in new the media landscape have caused the definition methods of publishing and exploring revenue of competition to change. No longer are local options for these new channels. newspapers just competing against other local newspapers. They are now vying for Of course, new digital trends emerge on a advertising spend and subscriptions in an regular basis. Only ten years ago, the Internet increasingly crowded media marketplace. In and mobile phones carried text and voice data, fact, they may be competing with companies respectively. Thanks to digitalization and that are not traditional media firms at all. technology advancements, each media has morphed into a multimedia channel. Media Now, local media companies are competing content has become interchangeable among with international digital brands like Yahoo! digital media. New technologies allow for the and Google for local advertising. In these days rapid deployment of multimedia content across of increasingly busy lifestyles, multitasking channels. For example, the same video used on and multisensory overload, established media television can be converted for publishing on companies also are frequently losing the battle smaller screens like computers, video iPods for mindshare, or time and attention. and mobile phones. Depending on the viewer, 9
- 10. MAY 2007 SHAPING THE FUTURE OF THE NEWSPAPER user, reader or listener’s preferences, video, WAN employs a methodology based on well- graphics, text and sound can be accessed on established, credible data provided by the CIA almost any digital medium. WorldFactbook 2007 and OECD statistics about broadband, mobile and Internet Digital media trends are not created equally, penetration. In all, 35 countries are profiled, country by country. In order to make sense of encompassing every major region in the world. the country-by-country and regional trends in digital consumption and revenue-making, the By indexing the key digital media categories, World Association of Newspapers has created WDMT has found that the Scandinavian the WDMT Index, which allows us to show countries, the United Kingdom, the United digital “hotspots” around the world. States, Germany, Luxembourg, the Netherlands, Australia, New Zealand, Some markets are more engaged than others Portugal, Switzerland, Korea and Japan, all when it comes to digital channel usage, rate as the World’s Hot Spots, with more than broadband penetration and mobile telephony 60 percent Internet penetration and 70 percent consumption. The WDMT Index ranks mobile penetration. countries based on an equal weighting of mobile penetration and Internet penetration in In addition to the WDMT Index, this WDMT each country. yearbook is filled with trends from a variety of Digital Hot Spots World Association of Newspapers digital index shows countries with combined highest mobile and Internet penetrations Hotter Internet 60%+ Mobile 70% + Australia, Denmark, Finland, Germany, Iceland, Japan, Korea, Luxembourg, Netherlands, New Zealand, Norway, Portugal, Sweden, Switzerland, United Kingdom, United States Warmer Internet 40-60% Mobile 65-70% Austria, Belgium, Czech Republic, France, Ireland, Italy, Slovak Republic, Spain Cooler Internet <40% Mobile <65% Argentina, Brazil, Canada, Chile, China & HK, Colombia, Greece, Hungary, India, Mexico, Poland, Russia, South Africa, Turkey, Venezuela Source: 2005 OECD and Central Intelligence Agency statistics, equally weighted for mobile and Internet 10
- 11. VOLUME 6 REPORT N° 2 WORLD DIGITAL MEDIA TRENDS Media usage during an average week % (% of U.S. population) 120 During an average WEEK (MONDAY-SUNDAY), do you… Age 18-34 35-54 55+ 100 80 60 40 20 0 Listen Listen to Listen Watch Surf the Read/ Read Read Read Instant Blog? Video to the satellite to web TV? Internet? send magazines? the the mail? message? gaming? radio? radio? radio? E-mail? newspapers? Source: BIGresearch, SIMM9, Dec 2006 reputable and established sources. Not only do blogs are among the biggest names in the data showcase a variety of mobile newspapers online, including the New York consumption patterns, but also show the Times, Asahi Shimbun, Yomiuri Shimbun, individual trend patterns for individual media Times of London, and Guardian Unlimited. elements, like blogging, video and visiting • More than 1 trillion SMS messages were sent specific types of content, by country. In the worldwide 2006. The mobile SMS market has U.S., for example, BIG Research shows the become a multi-billion dollar industry More usage patterns of three age groups for all types than 90 percent of the non-voice revenue from of media, during the course of a week. mobile industry come from SMS. More than The research shows, for example, that more 80 percent of all mobile phone usage than 80 percent of the respondents accessed worldwide is from voice transmissions. the Internet in a given week, and the percentage was higher as the age groups • In 2005, podcasting emerged on the media become younger. However, those using email scene, and since, has become a popular during the space of a week were more likely to medium for news reports and infotainment. be in the older age categories. Podcasting is emerging as a revenue channel for some of the world’s media through Every year, segments of the digital channels advertising and subscriptions such as iTunes. emerge and quickly grow in popularity. Consider: • In 2006 and 2007, video advertising emerged as the hot new channel for advertising online. • In 2004, weblogs became a mainstream Around the world, video advertising is online media form, and as of mid-2006, an growing at double-digit rates, according to the estimated 50 million blogs existed. About Interactive Advertising Bureau and Borrell 175,000 new blogs are created each day, with Associates, in separate reports. Online about 1.6 million postings per day, according advertising also is led by search advertising, to Technorati, a blog aggregation Web site. classifieds and banner ads, according to these Blogs drive a tremendous amount of traffic to research houses. news Web sites. Items from blogs outside of news Web sites frequently reference and link • The once-burgeoning Web population is to news blogs, thereby driving traffic to them. starting to slow down in terms of new users. Among the most linked-to news Web sites with While Internet advertising continues to grow at 11
- 12. MAY 2007 SHAPING THE FUTURE OF THE NEWSPAPER a quick clip, there are signs of a slowdown, the majority of the Internet population has especially in the West. Meanwhile, the outlook regularly accessed news and information sites for mobile phone advertising sales, in the world’s most Internet savvy countries, subscriptions and handset sales are robust, but led by the United States, France, Switzerland new subscribers are projected to slow down and the United Kingdom. The world’s most significantly in 2011, according to Informa. popular news Web sites are led by the biggest brands online, including Yahoo!, MSNBC and These are just some of the overarching themes CNN. Among the Top 10 are several that the World Digital Media Trends data show newspaper companies, including the New York us. Around the world, the consumption of Times, Gannett and USA Today. online video and audio is growing. From 2005 to 2006, upwards of half of the Internet According to Pew Research Center, populations in Spain, the UK, Australia, significantly more time is spent on traditional Brazil, France and Germany have accessed media on news in terms of frequency and audio and video online. For example, news is a length of time, compared with that of the popular destination for Internet and mobile Internet in the United States. An average of 40 phone users. According to Nielsen NetRatings, minutes is spent per user on news with newspapers per session, compared with 32 minutes online. Only 23 percent reported getting their news online “yesterday,” while 40 Online video/Audio viewership percent got news in newspapers, and 57 % of internet population 16+ percent got news from television yesterday. looked at video/audio content online % News also is among the three most paid-for 50 Q3 2006 Growth since Q3 2005 types of information in the countries with the 47 40 highest penetrations of mobile usership across 40 38 38 34 Asia and Europe. 30 30 20 27 Meanwhile, new forms of revenues are emerging online. Paid search and streaming 10 15 9 9 11 video are the fastest growing forms of local 7 0 online advertising in the U.S., according to Spain United Australia Brazil France Germany Kingdom Borrell Associates. Online commerce also has Source: Nielsen//NetRatings GNETT, September 2005-2006 taken off around the world. Percentage of Internet population visiting news and information news sites % 80 70 74 74 69 67 60 64 64 63 61 60 59 50 40 30 20 10 0 United France Switzerland United Germany Australia Brazil Spain Japan Italy States Kingdom Source: Nielsen//NetRatings NetView. September 2006. Home & work data, and home-only data for Brazil, Japan, Spain and Switzerland 12
- 13. VOLUME 6 REPORT N° 2 WORLD DIGITAL MEDIA TRENDS The world’s most popular News sources by medium news sites and the time spent, U.S. Rank Brand Active Unique (% of audience who) Channel Reach Audience Got news there yesterday (%) (millions) % 60 For 30 minutes or more 1 Yahoo! News 12.2 36.9 2 MSNBC 9.0 27.3 Average minutes spent per user 50 57 53 3 CNN 8.8 26.7 4 AOL News 7.4 22.3 48 43 40 5 Google News 5.7 17.4 40 40 6 NYTimes 4.5 13.7 30 36 32 7 BBC News 4.3 13.1 8 Gannett Newspapers 4.3 13.0 20 24 23 22 9 Internet Broadcasting 3.9 12.0 10 Websites 9 10 USA TODAY 3.7 11.3 0 Television Newspaper Radio Internet Source: Nielsen//NetRatings Global Index September 2006. Home & work data. Global statistics, except Japan Source: Pew Research Center Biennial News Consumption Survey 2006 Most frequent use of mobile commerce in selected countries Japan Korea Hong Kong, Chinese Greece Finland China Taipei Sample (persons) 2,146 4,581 1,375 1,809 497 66 First place Download Download Reading Download News Download services services services services 28.8% 60% 58% 36.1% 12.1% 31.8% Second place News Games Deliver News Download News services services 16.2% 17.2% 21.6% 14.1% 9.9% 24.2% Third place Location Ticketing for Games Investment Weather Financial information movie/music info/trans report services 14.9% 12.7% 16.9% 10.2% 9.1% 9.1% Source: ECOM (2004b) Survey of Mobile Internet Use, Tables 3-5 and 3-7 According to Nielsen NetRatings, a significant According to Arbitron research, online users increase of purchases online was reported in report spending less time with traditional the UK, Germany, Australia, France, Spain and media because of their time spent online. For Brazil between 2005 and 2006. Despite the example, 30 percent of online users report they new revenue channels of advertising and e- spend less time with newspapers and commerce, the growth of the Internet appears magazines, while 33 percent of online users to have had a negative impact in some respects report spending less time with television on traditional media. because of their online usage. U.S. local online advertising in 2007 Percentage of Internet population (US$ millions) who have purchased online Banners & Paid search in last six months Listings $1,837 Base: 16+ who have ever used the internet $5,272 24% % 50 Q3 2006 48 47 Growth since Q3 2005 40 45 43 Streaming 68% 5% video 30 31 $371 3% 20 E-mail ads 19 21 19 $233 10 12 9 10 2 2 0 United Germany Australia France Spain Brazil Kingdom Source: Borrell Associates Inc. Source: Nielsen//NetRatings GNETT, September 2005-2006 13
- 14. MAY 2007 SHAPING THE FUTURE OF THE NEWSPAPER Meanwhile, Internet advertising revenue continues to grow, seemingly at the expense of some established media. According to Zenith Global ad spending growth Optimedia, Internet advertising is set to grow % by medium, 2006-2009 80 an estimated 75 percent, from US$18.7 billion Total 70 74.55 in 2005 to US$42.7 billion in 2009, while Newspapers newspapers will grow 9.5 percent during the 60 Magazines same period, from US$119.2 billion in 2005 to TV 50 Radio US$135.2 billion in 2009. 40 Cinema Outdoor The ever-changing dynamics among 30 Internet established and emerging media has kept 20 25.39 24.08 media executives focused on plotting the 16.89 10 13.27 15.03 11.58 future development of their existing media 9.53 0 holdings, and the future investment in Source: Zenith Optimedia emerging media. The World Association of Newspapers has created World Digital Media Trends in 2007 to provide a digital compass for the world’s Percentage of U.S. online population media strategists, to assist them in tapping into spending less time with medium the tremendous growth of the digital due to time spent online, 2006 % opportunity with a compilation of these 35 important digital media studies. To see the 33 30 latest releases of new research, go to 30 30 25 www.FutureoftheNewspaper.com. 20 19 15 10 5 0 Radio Magazines Newspapers Television Source: Arbitron Inc./Edison Media Research 14
- 15. VOLUME 6 REPORT N° 2 WORLD DIGITAL MEDIA TRENDS 1. The multiple media advertising landscape Introduction Internet market for almost a decade, while in Central and Eastern Europe, the market is just In every region of the world, online advertising starting to take off. is the fastest-growing category of adspend. Latin America’s lagging Internet growth In virtually every region of the world, is caused by a variety of factors, but mostly, newspapers and TV by far represent the lion’s low Internet consumption compounded by share of media adspend, and will continue to low literacy rates. do so for the foreseeable future. These are the key conclusions of global research detailed in While statistics vary considerably between this chapter, provided by Zenith Optimedia, PwC and Zenith, the trends are similar: TV PriceWaterhouseCoopers and other research and newspapers media are losing ground to the houses. Internet in terms of adspend, but remain far and away the number one and number two Between 2006 and 2009, Zenith Optimedia media for adspend, worldwide, and will projects that Internet advertising will grow in continue to reign for years to come. A notable the double digits in every region of the world, trend is that projections for both PwC and with the fastest growth happening in Central World Advertising Research Center (WARC), and Eastern Europe (194 percent), Western show that TV has become the dominant Europe (94.33 percent) and Asia (71.69 advertising medium worldwide. Even in places percent). The slowest growth is occuring in where newspapers are the number one adspend Latin America, with 29.68 percent, followed media today, TV will surpass it in the near by North America with 64.86 percent. future, if the predicted trajectories continue. A variety of factors affect growth rates. For example, PwC found that in 2001, Perhaps the most important factor is the Newspapers were the top ad spending medium maturity of the Internet market in each region. in the U.S., in fact, almost double that of the For example, North America has had a robust number two, TV Networks Broadcast and 15
- 16. DECEMBER 2006 SHAPING THE FUTURE OF THE NEWSPAPER Cable. PwC projects, however, that by the end overtake Newspaper adspend this year. of 2010, TV Networks Broadcast and Cable Meanwhile, the share of Internet adspend will will pull nearly even with newspapers, and shift significantly in the coming years, mostly then overtake it a few years later. plucking adspend from traditional media Separately, data from World Advertising budgets. By 2009, the largest share of Internet Research Center (WARC), 2006, showed that adspend will occur in North America, (10.54 Newspaper adspend in the top 15 markets in percent), followed closely by Western Europe the European Union was almost 50 percent (9.41 percent), according to ZenithOptimedia. of total adspend in 1985, with Magazines The world Internet adspend will jump from ranked second. In 1990, TV adspend just 2.84 percent in 2002 to 8.5 percent in supplanted Magazines, and TV is poised to 2009. Global media market (US$ millions) Video games Magazine publishing Recorded music Book publishing Radio/out-of-home advertising TV distribution 1,500,000 Filmed entertainement Newspapers publishing Internet advertising and access spending TV networks broadcast and cable 46,462 47,927 86,799 104,060 1,200,000 31,116 285,561 36,965 68,503 82,848 900,000 169,444 117,585 20,631 39,009 54,482 130,533 64,169 102,005 65,617 230,282 600,000 114,382 92,759 103,419 168,202 109,953 206,129 300,000 184,045 167,775 230,262 177,067 127,049 0 2001 2002 2003 2004 2005 2006 2007 2008 2009 2010 Note: Beginning in 2003, newspaper Web site advertising in the United States is included in both the newspaper and Internet segments but is counted only once in the overall total. Prior to 2003, newspaper Web site advertising in the U.S. is included only in the Internet segment. Sources: PricewaterhouseCoopers LLP, Wilkofsky Gruen Associates Share of internet adspend (%) 2002 2003 2004 2005 2006 2007 2008 2009 North America 4.74 5.00 5.32 6.01 7.18 8.89 9.71 10.54 Western Europe 1.44 1.98 2.80 4.11 5.46 6.72 8.02 9.41 Central & Eastern Europe 0.28 0.38 0.69 0.93 1.31 1.61 1.98 2.51 Asia Pacific 1.57 2.09 3.00 4.39 5.60 6.64 7.43 7.95 Latin America 0.04 0.57 0.69 0.80 0.85 0.89 0.93 0.97 World 2.84 3.21 3.75 4.64 5.71 6.95 7.74 8.50 Source: Zenith Optimedia 16
- 17. VOLUME 6 REPORT N° 2 WORLD DIGITAL MEDIA TRENDS Global media revenues market digital music. PwC projects the Internet market will grow from US$6.6 billion in Double-digit growth is the balliwick of 2001 to US$16.9 billion in 2006, and will digital media, while traditional media are reach US$ 28.6 billion in 2010, which is growing at a significantly slower pace. It’s more than fourfold expansion in 10 years. important to note that traditional media, led The video game market is projected to by newspapers, television and radio, still double from US$2.6 million to US$4.5 command the vast majority of the media million in 2010. Meanwhile, traditional market revenues, worldwide. media markets such as newspapers, The global media revenues market has grown magazine, cable, radio and book publishing steadily each year from US$ 1.1 trillion in are growing at single-digital compounded 2001 to a projected US$ 1.8 trillion in 2010. In annual growth rates (CAGR). ten years, the global media market will grow a According to the PwC in 2006, the Internet projected 28.3 percent, according to advertising and access spending market has PricewaterhouseCoopers Global Entertainment the highest CAGR from 2006 to 2010, of and Media Overview 2006-2010. 12.9 percent. Following Internet are video The fastest-growing media markets are games (11.4 percent) and TV distribution decidedly digital, particularly Internet and (8.3 percent), and separated from TV entertainment-oriented, including video network, broadcast and cable, which is games, filmed entertainment cinema and projected to grow at a 6.6 percent rate. Global media market, by media: 2006-2010 CAGR Video games Magazine publishing % Recorded music Book publishing Radio/out-of-home advertising TV distribution 15 Filmed entertainement Newspapers publishing Internet advertising and access spending TV networks broadcast and cable 12 12.9 11,4 9 8.3 6 6.6 6.2 5.2 5.3 3 3.6 2.9 3.1 0 Sources: PricewaterhouseCoopers LLP, Wilkofsky Gruen Associates 17
- 18. MAY 2007 SHAPING THE FUTURE OF THE NEWSPAPER Global advertising spending Global ad spending growth % by medium, 2006-2009 According to Zenith Optimedia, TV, 80 newspapers and magazines are still the Top 3 70 Total 74.55 media for adspend, while the Internet is by far Newspapers 60 Magazines the fastest growing recipient of adspend, with TV a projected growth rate of 75 percent from 50 Radio 2005 to 2009. 40 Cinema Outdoor 30 According to Zenith Optimedia, global Internet 20 25.39 24.08 advertising spend is estimated to grow 23.9 16.89 percent from 2005 to 2009, from US$399.9 10 13.27 15.03 11.58 9.53 billion to US$495.4 billion. 0 Source: Zenith Optimedia Internet advertising spending is growing fastest, at an estimated 75 percent rate from US$ 18.7 billion in 2005 to an estimated US$ Advertising spending worldwide, 42.7 billion in 2009. Zenith has forecasted that by media, 2005-2009 cinema and outdoor will grow 25 percent, TV Internet while newspaper, radio, and magazine ad Newspapers Outdoor/Others Magazines Cinema spend are projected to grow less than 14 Radio percent each. % of total adspending In terms of the media composition of total ad 40 37.8 37.2 spending, TV, newspapers, and magazines 35 remain the top three media for ad spending 30 29.8 27.3 globally, but their percentages will slip slightly 25 from 2005 to 2009. The Internet is projected to 20 surpass radio and outdoor/others in 2008 in ad 15 13.3 spend. Radio and outdoor used to be number 12,5 10 8.6 8.6 four and number five; respectively. Ad 5.4 8.0 5.9 5 spending on cinema has been always a niche 4.7 0 0.4 0.5 market compared with other media. 2005 2006 2007 2008 2009 Source: ZenithOptimedia, December 2006 Advertising spending worldwide, by media, 2005-2009 Cinema Radio TV Internet Magazines Outdoor/Others Newspapers US$ millions 2,272 500,000 42,685 29,126 1,697 39,548 400,000 18,712 21,769 62,078 34,348 300,000 52,993 135,228 119,178 200,000 184,502 151,187 100,000 0 2005 2006 2007 2008 2009 Note: Currency conversion at 2005 average Source: ZenithOptimedia, December 2006 18
- 19. VOLUME 6 REPORT N° 2 WORLD DIGITAL MEDIA TRENDS Advertising spending in North America (US$ millions) 250,000 Cinema Internet Outdoor/Others 699 200,000 Radio 21,680 Magazines Newspapers 9,076 TV 23,792 150,000 29,458 57,243 100 100,000 3,486 12,087 12,457 37,323 63,740 50,000 37,206 0 1995 1996 1997 1998 1999 2000 2001 2002 2003 2004 2005 2006 2007 2008 2009 Source: Zenith Optimedia Advertising spending in North America North America ad spending growth % by medium, 2006-2009 TV and newspapers are still the biggest 80 adspend beneficiaries, but are threatened by Total 70 the fast-growing Internet, cinema and outdoor. Newspapers 60 Magazines 64.86 In North America, advertising spending has 50 TV Radio 52.09 steadily grown every year, except between 40 Cinema 2001 to 2003, when ad spending was stagnant, Outdoor 36.52 due to the impact on the world economy of 30 Internet events surrounding 9/11, according to Zenith 20 Optimedia. 10 12.29 16.13 7.85 5 4.53 While TV, newspapers, and magazines sit atop 0 Source: Zenith Optimedia the North American market for advertising spending and will do so for years to come, they are now slow-growth markets. Where huge increases are expected in Internet, cinema and outdoor advertising between now and the end of the decade, newspapers and TV in North America are growing at only a 5 percent and 4.3 percent rate, respectively. Meanwhile, Internet, cinema, and outdoor are projected to grow at rates of 65 percent, 52 percent, and 37 percent, respectively. 19
- 20. MAY 2007 SHAPING THE FUTURE OF THE NEWSPAPER Advertising spending in U.S. (US$ millions) Out-of-home TV distribution Radio Newspapers 9,400 Internet TV networks broadcast and cable 24,695 Magazines 200,000 6,840 25,500 20,760 29,230 5,193 15,550 150,000 17,861 24,550 37,160 7,210 32,510 22,325 100,000 58,700 25,438 51,160 44,304 50,000 51,960 39,850 26,962 0 2001 2002 2003 2004 2005 2006 2007 2008 2009 2010 Note: Beginning in 2003, newspaper Web site advertising in the United States is included in both the newspaper and Internet segments but is counted only once in the overall total. Prior to 2003, newspaper Web site advertising in the U.S. is included only in the Internet segment. Sources: PricewaterhouseCoopers LLP, Wilkofsky Gruen Associates Advertising spending Advertising spending in U.S.: in the United States 2006-2010 CAGR Out-of-home TV distribution The ad spending statistics projected from Radio Newspapers PricewaterhouseCoopers tell a slightly Internet TV networks broadcast and cable different story than those from Zenith. % Magazines 20 Advertising spending in United States has grown from US$149.3 million in 2001 to 15 US$230.4 million in 2010, a growth of 15.2 54.35 percent in ten years. From 2006 to 2010, 10 the overall U.S. advertising spending CAGR is 8.3 5 7.1 5.4 percent. 4.3 4.5 4.1 3.5 In terms of ad spending for each medium, 0 Sources: PricewaterhouseCoopers LLP, Wilkofsky Gruen Associates PwC found that in 2001, newspapers were the number one ad spending medium in the U.S., and almost double that of number two, TV networks, broadcast and cable. 2007 advertising spending PwC projects, however, that in 2010, TV % growth in U.S. 20 networks, broadcast and cable will have 17.9 almost caught up in adspend, and if the 15 trajectories continue, will overtake newspapers a few years later. Meanwhile, 10 the Internet has grown from a niche medium (US$7.2 billion in 2001) to a major player 5 5.8 (US$25.5 billion in 2010), an increase of 2.7 2.3 more than threefold. 0 Print Online Events Other media media media -3.5 including PR -5 TV, radio & Source: Outsell’s Advertising other media Tracking Database 20
- 21. VOLUME 6 REPORT N° 2 WORLD DIGITAL MEDIA TRENDS Advertising spending in Canada 2007 U.S. advertising spending In Canada, the Internet is experiencing an forecast almost 20 percent compounded annual growth Other media including PR 14.6% rate in adspend. TV networks and newspapers still remain the main players. TV, radio and other media Print media 5.2% 40.1% According to the Global Entertainment and Media Overview from PricewaterhouseCoopers, 2006, advertising spending in Canada will grow from US$6 Events billion in 2001 to a projected US$8.9 billion 19.7% in 2010, a 47.3 percent growth in ten years. TV networks, newspapers, and radio are still the top three ad spending media. Online media 20.4% Source: Outsell’s Advertising Tracking Database Advertising spending in Canada: 2007 U.S. ADVERTISING SPENDING 2006-2010 CAGR FORECAST Out-of-home Magazines Radio Newspapers According to Outsell’s Advertising Tracking % Internet TV networks broadcast and cable Database 2007, Print Media is forecasted as 20 the leader in the U.S. with 40 percent of 18.8 15 overall ad spending; however, its growth rate is only 2.7 percent in 2007. 10 5 6.6 4.7 3.8 2.9 2.5 0 Sources: PricewaterhouseCoopers LLP, Wilkofsky Gruen Associates Advertising spending in Canada (US$ millions) 10,000 Out-of-home Radio 363 Internet Magazines 1,312 8,000 Newspapers TV networks broadcast and cable 821 232 854 6,000 875 2,488 80 673 4,000 2,064 3,053 2,000 2,112 0 2001 2002 2003 2004 2005 2006 2007 2008 2009 2010 Sources: PricewaterhouseCoopers LLP, Wilkofsky Gruen Associates 21
- 22. MAY 2007 SHAPING THE FUTURE OF THE NEWSPAPER However, Internet ad spend is projected to In terms of 2006-2010 CAGR in EMEA, grow tenfold between 2001 and 2010, from Internet will exert the most aggressive growth, US$ 80 million in 2001 to US$ 821 million in with a 21.2 percent CAGR, according to PwC. 2010. Meanwhile, traditional media ad spend growth is slow by comparison. As one might expect, in terms of 2006-2010 CAGR, Internet is the leader, with 18.8 percent compounded growth. Meanwhile, the various print media have a sluggish growth of between 2.5 and 2.9 percent CAGR from 2006-2010. Advertising spending in Europe, Middle East and Africa (EMEA) PwC predicts that Internet spending will grow about tenfold in Europe, the Middle East and Advertising spending in EMEA: Africa, or 21.2 percent CAGR, from 2006 to 2006-2010 CAGR 2010. Despite slower growth, TV networks Out-of-home Magazines and newspapers, will remain by far the number Radio Newspapers one and number two recipients of adspend in % Internet TV networks broadcast and cable 2010. 25 20 Advertising Spending in EMEA was 21.2 US$101.4 billion in 2001, and will be 15 US$157.7 billion in 2010, with a 55.45 percent 10 growth over that ten-year period. TV networks, 5 7.4 7 newspapers and magazines will continue to be 5.7 4 3.3 the top three recipients of adspend among 0 media. Sources: PricewaterhouseCoopers LLP, Wilkofsky Gruen Associates Advertising spending in EMEA (US$ millions) 200,000 Out-of-home Radio Internet Magazines 150,000 Newspapers 11,157 TV networks broadcast and cable 8,681 14,896 8,385 24,838 6,968 1,536 7,745 100,000 6,413 21,164 5,325 44,369 19,739 38,846 36,846 50,000 53,751 41,733 31,581 0 2001 2002 2003 2004 2005 2006 2007 2008 2009 2010 Sources: PricewaterhouseCoopers LLP, Wilkofsky Gruen Associates 22
- 23. VOLUME 6 REPORT N° 2 WORLD DIGITAL MEDIA TRENDS Adspend share in the EU Ad expenditures in the EU-15 saw consistent growth between1985 and 2000, hitting almost According to the Year-End Advertising 90 billion Euros in 2000. It then declined Expenditure Statistics from World Advertising between 2001 and 2003, during the worldwide Research Center (WARC), 2006, newspaper advertising downturn, and has yet to hit that adspend in the top 15 markets in the European level again. Union was almost 50 percent of total adspend in 1985, while magazines ranked second. In 1990, TV adspend supplanted magazines and is expected to overtake newspapers this year. Meanwhile, adspend for a variety of other media (including directories, radio, outdoor, cinema, and Internet) has experienced steady growth since 1999. Percentage share of adspend by medium in the EU-15, 1985-2005 % share 50 Newspapers Magazines TV Other media* 45 40 35 30 25 20 15 10 5 0 1985 1987 1989 1991 1993 1995 1997 1999 2001 2003 2005 * Other Media” includes directories, radio, outdoor, cinema, and internet advertising. Direct mail Expenditure is not included. Source: World Advertising Research Center, Year End Advertising Expenditure Statistics, Apr 2006 Advertising Expenditure Trend in the EU-15, 1985-2005 % change (at constant 2000 prices) Euro (2000) m 14 100,000 % change Euro (2000) m 12 90,000 10 80,000 8 70,000 6 60,000 4 50,000 2 40,000 0 30,000 -2 -4 20,000 -6 10,000 -8 0 1985 1987 1989 1991 1993 1995 1997 1999 2001 2003 2005 Source: World Advertising Research Center, Year End Advertising Expenditure Statistics, Apr 2006 23
- 24. MAY 2007 SHAPING THE FUTURE OF THE NEWSPAPER Advertising spending Advertising spending in Asia Pacific in Western Europe Media adspend in Asia Pacific will expand 90 In Western Europe, the Internet has the percent from 1995 to 2009, according to Zenith greatest growth potential with a 94.33 Optimedia. The huge increase will be led by projected percent growth rate, according to Internet and cinema adspend increases of 72 percent Zenith Optimedia projections for 2006 to and 41 percent, respectively. It projects magazine 2000. Other media will grow at a rate of about adspend will see a growth rate of only 8 percent. 10 percent, including the top three media: TV, Advertising spending in Asia fell or flattened newspapers, and magazines, according to the twice in the last decade, mostly because of the projections. Asian Currency Crisis in 1997 and 9/11 in In Western Europe, advertising spending will 2001. However, it is estimated that in 2009 the grow from US$66.8 billion in 1995 to advertising spending will achieve US$109.4 US$114.4 billion in 2009. billion, which represents a 90 percent growth from 1995. TV and newspapers are the Top Although TV, newspapers and magazines still two recipients of advertising spent in Asia garner the most adspend, their growth rates are slowing. TV remains the fastest growing of the these three, and Zenith forecasts that TV will Western Europe ad spending growth overtake newspapers to become the top % by medium, 2006-2009 advertising medium in Western Europe, this 100 year. Meanwhile, the Internet is the most Total 94.33 dramatically growing media in the region, and 80 Newspapers Magazines is estimated to reach US$10.8 billion in TV adspend by 2009. 60 Radio Cinema Zenith Optimedia estimates that Internet ad 40 Outdoor spending CAGR will far exceed that of any Internet other media in Western Europe, with a 20 projected 94.33 percent growth rates from 12.7 9.79 10.42 2006 to 2009. Meanwhile other media have 6.49 6.11 9.12 6 0 growth rates near 10 percent or lower Source: Zenith Optimedia Advertising spending in Western Europe (US$ millions) 140,000 Cinema Internet 120,000 Radio 927 Outdoor/Others 10,849 Magazines 100,000 6,263 Newspapers 7,474 TV 19,208 80,000 515 3,269 34,349 60,000 3,728 13,576 40,000 26,762 35,371 20,000 18,911 0 1995 1996 1997 1998 1999 2000 2001 2002 2003 2004 2005 2006 2007 2008 2009 Source: Zenith Optimedia 24