Download to read offline


![•
Box 1.2 Countering noncommunicable diseases in Saudi Arabia
1 Global health estimates 2019: deaths by cause, age, sex, by country and by region, 2000–2019. Geneva: World Health Organization; 2020 (https://www.who.int/data/gho/
data/themes/mortality-and-global-health-estimates, accessed 15 April 2023).
2 Global health estimates 2019: disease burden by cause, age, sex, by country and by region, 2000–2019. Geneva: World Health Organization; 2020 (https://www.who.int/
data/gho/data/themes/mortality-and-global-health-estimates/global-health-estimates-leading-causes-of-dalys, accessed 15 April 2023)
3 Vision 2030. Kingdom of Saudi Arabia (https://www.vision2030.gov.sa/v2030/overview/vibrant-society/, accessed 15 April 2023).
4 WHO Framework Convention on Tobacco Control. Geneva: World Health Organization; 2005 (https://fctc.who.int/who-fctc/overview, accessed 14 April 2023).
5 Alghamdi A, Fallatah A, Okal F, Felemban T, Eldigire M, Almodaimegh H. Smoking behaviour after enforcement of a 100% tax on tobacco products in Saudi Arabia: a cross-
sectional study. East Mediterr Heal J. 2020;26(1):39–46. doi:10.26719/2020.26.1.39.
6 Tobacco control laws. Legislation by country – Saudi Arabia (www.tobaccocontrollaws.org/legislation/country/saudi-arabia/summary, accessed 14 April 2023).
7 Kingdom of Saudi Arabia: inclusion of sugar sweetened beverages and other tobacco products in the Excise Tax System. PwC Middle East; 2019 (https://www.pwc.com/
m1/en/tax/documents/2019/ksa-inclusion-of-sugar-beverages-and-tobacco-products-in-the-ets.pdf, accessed 14 April 2023).
8 WHO global report on sodium intake reduction. Geneva: World Health Organization; 2023.
9 WHO announces certification programme for trans-fat elimination. Press release. Geneva: World Health Organization; 2020 (https://www.who.int/news/item/17-11-2020-
who-announces-certification-programme-for-trans-fat-elimination, accessed 14 April 2023).
10 حلمل يف زبخلا اقبط ةحئالل ةينفلا ةيدوعسلا ليلد يداشرا يعنصمل يدروتسمو زبخلا صوصخب مازلإلا ليلقتب
SFDAFD 2018/2362 [Guidelines for salt reduction in bread]. Riyadh: Government of the Kingdom of Saudi Arabia; 2018 (https://extranet.who.int/nutrition/gina/en/
node/41573, accessed 28 April 2023).
11 Itumalla R, Aldhmadi B. Combating tobacco use in Saudi Arabia: a review of recent initiatives. East Mediterr Heal J. 2020;26(7):858–63. doi:10.26719/emhj.20.019.
12 Gosadi IM, Alshehri MA, Alawad SH. Do healthier foods cost more in Saudi Arabia than less healthier options? Saudi Med J. 2016;37(9):1015–21. doi:10.15537/smj.2016.9.14077.
13 Saudi Arabia is actively engaged with WHO for data exchange and estimation of various health-related indicators. This commitment will be reflected in forthcoming estimates.
Like most countries in the world, Saudi Arabia has seen
rising incidence and prevalence of NCDs. Consequently,
NCDs have become the leading causes of mortality
and disability in the country,1,2
challenging not only
population health but also the country’s health care and
sustainable development.
To counter the rising burden of NCDs, Saudi Arabia has
made tremendous progress in its health-care system and
in advancing the prevention and control of NCDs over
the past few years. There is strong political commitment
towards tackling NCDs through multisectoral
collaboration and coordination as an integral part of the
country’s Vision 2030 agenda to increase life expectancy
to 80 years by 2030.3
With the aim of reducing both
mortality and morbidity by 5% in 10 years, more specific
goals were set in the National Executive Plan for NCDs
(2010– 2020) and its updated version for 2014–2025.
The goals include scaling up monitoring and prevention
of NCDs, providing quality health services for NCD
treatment, promoting sports activities, substantially
reducing air pollution, and expanding NCD research.
Along with the aim to improve NCD treatment through
primary health care and universal health coverage, Saudi
Arabia also has initiated several strategic interventions
and programmes to promote the prevention of health
risks. For instance, the country has had a tobacco control
programme since 2002, was one of the first countries
to ratify the WHO Framework Convention on Tobacco
Control (FCTC) in 2005 and was awarded the WHO
Tobacco Control Medal in 2019.4
Currently, Saudi Arabia
is a best-practice country in three out of six MPOWER
policies, including offering help to quit tobacco use,
warning about the dangers of tobacco, and enforcing
bans on advertising, promotion and sponsorship.
In addition, Saudi Arabia has made remarkable progress
in monitoring tobacco use through implementation of
Global Adult Tobacco Survey as well as Global Youth
Tobacco Survey in recent years. It is the first country in
the Eastern Mediterranean Region to implement plain
packaging of tobacco products. In December 2022,
the Saudi Food Drug Authority was accredited as a
WHO Collaborating Centre. The country’s tobacco control
regulations include an anti-smoking law, a 100% excise
taxation, and prohibition of smoking in public areas and
advertising and promotion of tobacco.5,6
Furthermore, the National Diet and Physical Activity
Strategy (2014–2025) was implemented – together with
several campaigns within and beyond the Vision 2030
framework – in order to lower the rate of overweight
and obesity to 40%, to increase the rate of vegetable
and fruit consumption to 20% and to stabilize the
prevalence of diabetes. For instance, educational lectures
were held, training manuals were published on physical
activity, and awareness campaigns focused on mass media
outlets to improve physical activity, particularly among
the young. Furthermore, Saudi Arabia requires calorie
levels to be displayed on restaurant and café menus
and has imposed a 50% excise tax on sugar-sweetened
beverages and a 100% tax on energy drinks since 2019.7
Saudi Arabia is also a best-practice country for sodium
reduction and trans-fat elimination policies to tackle
NCDs. It is one of nine countries to have reached the
highest level of implementation of sodium reduction
policies and one of 14 countries to qualify for WHO’s
certification programme for trans-fat elimination.8,9
The
country has mandatory policies to enforce a limit of
sodium content in food items, implementing all WHO
sodium-related best-buys, limiting trans-fat content in
foods and oils, and requiring the labelling of sodium and
trans-fat content on pre-packaged foods.8,10
Through these policies, the country has created
incentives for healthier lifestyles and has seen promising
improvements. There was a 213% increase in demand
from people seeking help to give up smoking and a 43.1%
decrease in tobacco imports into the country.11
Healthy
foods are now more affordable than unhealthy foods.12
These are just some highlights of the numerous actions
that Saudi Arabia is undertaking, and needs to take,
in order to accelerate progress towards full achievement
of the Vision 2030 agenda.13
16
World health statistics 2023 – Monitoring health for the SDGs](https://image.slidesharecdn.com/worldhealthstatisticsreport2023-230522010451-e103b2c4/85/World-Health-Statistics-Report-2023-26-320.jpg)
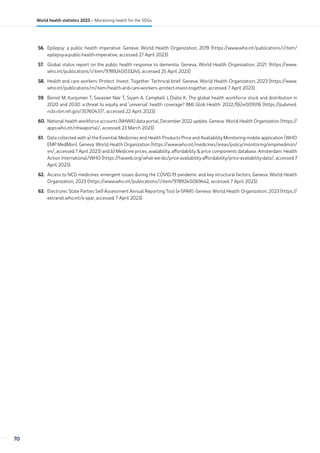
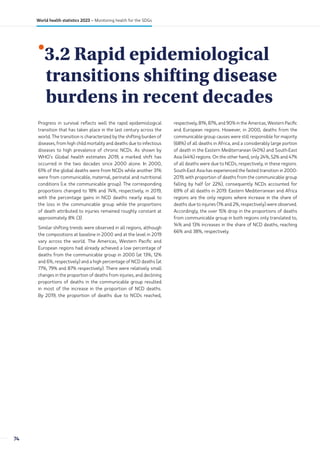
![Globally, men have lost a total of 196.9 million life-years – 42%
more than women who lost 140.0 million life-years. The age
distribution of YLL is similar among men and women at the
global level where YLL in age groups between 45 and 74 years
account for around 70% of total YLL for both men and women.
YLL in the oldest ages above 75 years among women are
proportionally much higher at 21%, compared to just 15% for
men, reflecting a higher probability of survival to ages beyond
75 years and a lower level of mortality – both excess mortality
and background mortality due to other causes – among women.
The Region of the Americas, European Region and South-East
Asia Region each accounted for over 15% of the global YLL due
to excess mortality at 21%, 17% and 44%, respectively. Thus,
278.8 million life-years have been lost due to the pandemic in
these three regions alone. More YLL due to excess mortality
occurred among men in all WHO regions. However, the ratio
of YLL among men relative to women was more than 1.5 in the
Western Pacific Region, in the Region of Americas and in the
Eastern Mediterranean Region, while it is less than 1.3 in the
other regions. The age distribution of YLL by sex is remarkably
similar between the regions, as we observe at the global level,
except in the Western Pacific Region where men and women
in the age groups between 75 and 84 years saw negative YLL.
Nonfatal impacts of COVID-19
This report, in addition to many similar studies at national,
regional and global levels, aims to provide a detailed portrayal
of the impact of the COVID-19 pandemic on human mortality
in various dimensions. However, much less comprehensive
research and analysis have been done to disentangle the
long-lasting impact of nonfatal outcomes among people who
have been infected by the COVID-19 virus. Commonly known as
long COVID, the post-COVID-19 condition refers to the various
mid- and long-term symptoms that approximately 10–20% of
people experience after recovering from their initial COVID-19
illness (15). Such symptoms, including cognitive dysfunction
and fatigue, can have a significant, and in some cases severe,
impact on one’s daily life and productivity.
Given the emergent nature of the post-COVID-19 condition
and the complexity of its symptoms, no specific treatment
regimen is yet available. More research needs to be done in
the coming years to assess the underlying mechanisms of such
symptoms and the true disease burden associated with the
nonfatal outcome of long COVID. Until then, it is important to
stress the importance of public health interventions to prevent
COVID-19 infections and its associated post-acute sequalae.
COVID-19 vaccines and associated inequality
The COVID-19 pandemic has exposed inequalities both between
and within countries, including inequalities in access to COVID-19
vaccines. As of March 2023, about 13 billion doses of COVID-19
vaccines had been administered globally. However, vaccination
coverage vary greatly by country (11).
The Global COVID-19 Trends and Impact Survey conducted
by the University of Maryland Social Data Science Center
in partnership with Facebook, collected data on COVID-19
vaccination indicators as well as educational status (16).
This survey is subject to several limitations, including inability
to reach people who are not Facebook users, sampling and
weighting issues, response bias and missing data. The estimates
shown here are not official WHO estimates and are not directly
comparable with official estimates.
Across all countries, self-reported receipt of COVID-19 vaccine
was higher among those with more education. As of December
2021, still in the early stages in terms of the availability of
COVID-19 vaccines, the median level of vaccination across
90 countries among population groups with educational levels
above secondary education was 79.1% (UI: 75.6–82.4%). This was
higher than the median level of vaccination among groups
with secondary education which was 71.4% (UI: 67.4–76.1%) or
groups with no or primary education at 67.7% (UI: 60.0–73.0%).
This stepwise pattern was also evident across high-income
countries (HICs) where median vaccination levels across the
most-to-least educated groups were 87.4% (UI: 83.4–89.0%),
83.8% (UI: 78.8–86.0%) and 81.0% (UI: 78.3–87.1%), respectively,
and across upper-middle-income countries (UMICs) where
median vaccination levels across the most-to-least educated
groups were 75.5% (UI: 68.1–82.1%), 66.7% (UI: 58.8–73.9%) and
57.6% (UI: 52.5–72.3%), respectively. In low-income countries
(LICs) and lower-middle-income countries (LMICs), the median
self-reported receipt of a COVID-19 vaccine was higher among
the most educated group at 63.9% (UI: 53.0–75.6%) and equally
low in the two less educated groups (51%) (17).
Populations in LICs and LMICs were more likely to report
experiencing a structural barrier to vaccination [median across
28 countries: 34.6% (UI: 29.3–38.9)] – such as not meeting
eligibility requirements, availability or accessibility issues or
lack of information – than populations in UMICs [median
across 29 countries: 24.0% (UI: 21.5–29.9)] or populations in
HICs [median across 33 countries: 15.0% (UI: 14.1–17.1)].
Among unvaccinated populations, vaccine hesitancy was lower
in HICs than in UMICs, LMICs and LICs. However, vaccine
22
World health statistics 2023 – Monitoring health for the SDGs](https://image.slidesharecdn.com/worldhealthstatisticsreport2023-230522010451-e103b2c4/85/World-Health-Statistics-Report-2023-32-320.jpg)
![References
1. Trends in maternal mortality 2000 to 2020: estimates by WHO, UNICEF, UNFPA, World Bank Group and UNDESA/Population
Division. Geneva: World Health Organization; 2023 (https://www.who.int/publications/i/item/9789240068759, accessed
21 April 2023).
2. Global health estimates 2019: deaths by cause, age, sex, by country and by region, 2000–2019. Geneva: World Health
Organization; 2020 (https://www.who.int/data/gho/data/themes/mortality-and-global-health-estimates/, accessed 1 April 2023).
3. World Population Prospects 2022. New York (NY): United Nations, Department of Economic and Social Affairs; 2022 (https://
population.un.org/wpp/, accessed 1 April 2023).
4. Levels and trends in child mortality. Report 2022. Estimates developed by the UN Inter-agency Group for Child Mortality
Estimation. United Nations Children’s Fund, World Health Organization, World Bank Group and United Nations Population
Division. New York: United Nations Children’s Fund; 2023 (https://data.unicef.org/resources/levels-and-trends-in-child-
mortality/, accessed 14 April 2023).
5. Perin J, Mulick A, Yeung D, Villavicencio F, Lopez G, Strong KL et al. Global, regional, and national causes of under-5 mortality
in 2000–19: an updated systematic analysis with implications for the Sustainable Development Goals. Lancet Child Adolesc
Health. 2022;6:106–15. doi:10.1016/S2352-4642(21)00311-4.
6. Global health estimates 2019: disease burden by cause, age, sex, by country and by region, 2000–2019. Global Health
Observatory data. Geneva: World Health Organization; 2020 (https://www.who.int/data/gho/data/themes/mortality-and-
global-health-estimates/, accessed 24 March 2023).
7. WHO global information system on alcohol and health (GISAH) [online database]. Global Health Observatory data. Geneva: World
Health Organization; 2022 (https://www.who.int/data/gho/data/themes/topics/topic-details/GHO/levels-of-consumption/,
accessed 11 April 2023).
8. WHO global report on trends in prevalence of tobacco use 2000–2025, fourth edition. Geneva: World Health Organization;
2021 (https://www.who.int/publications/i/item/9789240039322, accessed 4 April 2023).
9. Noncommunicable diseases: risk factors. Global Health Observatory data. Geneva: World Health Organization; 2022 (https://
www.who.int/data/gho/data/themes/topics/topic-details/GHO/ncd-risk-factors, accessed 12 April 2023).
10. UNICEF/WHO/World Bank joint child malnutrition estimates, 2023. Geneva: World Health Organization (in preparation).
11. WHO Coronavirus (COVID-19) dashboard. Geneva: World Health Organization (https://covid19.who.int/data, accessed
14 April 2023).
12. Msemburi W, Karlinsky A, Knutson V, Aleshin-Guendel S, Chatterji S, Wakefield J. The WHO estimates of excess mortality
associated with the COVID-19 pandemic. Nature. 2023;613:130–7. doi.org/10.1038/s41586-022-05522-2.
13. Knutson V, Aleshin-Guendel S, Karlinsky A, Msemburi W, Wakefield J. Estimating global and country-specific excess mortality
during the COVID-19 pandemic. arXiv preprint. 2022. doi.org/10.48550/arXiv.2205.09081.
14. Global excess deaths associated with COVID-19 (modelled estimates) (Database). Geneva: World Health Organization (https://
www.who.int/data/sets/global-excess-deaths-associated-with-covid-19-modelled-estimates, accessed 14 April 2023). Methods
were developed in collaboration with the Technical Advisory Group on COVID-19 Mortality Assessment in which as part of
the terms of reference, conflicts of interest were declared determining that member’s participation would not give rise to
a real, potential or apparent conflict of interest. (https://www.who.int/data/technical-advisory-group/covid-19--mortality-
assessment/terms-of-reference).
15. Coronavirus disease (COVID-19): post COVID-19 condition. Questions and answers (Online). Geneva: World Health Organization
(https://www.who.int/news-room/questions-and-answers/item/coronavirus-disease-(covid-19)-post-covid-19-condition, accessed
14 April 2023).
16. University of Maryland Social Data Science Center Global COVID-19 Trends and Impact Survey, in partnership with Facebook.
College Park (MD): University of Maryland (https://covidmap.umd.edu/, accessed 21 April 2023.
17. Bergen N, Kirkby K, Fuertes CV, Schlotheuber A, Menning L, Mac Feely S et al. Global state of education-related inequality
in COVID-19 vaccine coverage, structural barriers, vaccine hesitancy, and vaccine refusal: findings from the Global COVID-19
Trends and Impact Survey. Lancet Glob Health. 2023;11(2):e207–17.
29
Key issues and trends in global health](https://image.slidesharecdn.com/worldhealthstatisticsreport2023-230522010451-e103b2c4/85/World-Health-Statistics-Report-2023-39-320.jpg)
![18. Pörtner H-O, Roberts DC, Poloczanska ES, Mintenbeck K, Tignor M, Alegría A et al., editors. IPCC, 2022: Summary for
policymakers. In: Pörtner H-O, Roberts DC, Tignor M, Poloczanska ES, Mintenbeck K, Alegría A et al. Climate change 2022:
impacts, adaptation, and vulnerability. Contribution of Working Group II to the Sixth Assessment Report of the Intergovernmental
Panel on Climate Change. Cambridge and New York (NY): Cambridge University Press (https://www.ipcc.ch/report/ar6/wg2/
downloads/report/IPCC_AR6_WGII_SummaryForPolicymakers.pdf, accessed 11 May 2023).
19. COP24 special report: health and climate change. Geneva: World Health Organization; 2018 (https://www.who.int/publications/i/
item/9789241514972, accessed 19 April 2023).
20. Public health and environment [online database]. Global Health Observatory data. Geneva: World Health Organization (https://
www.who.int/data/gho/data/themes/public-health-and-environment, accessed 9 April 2023).
21. Food and Agriculture Organization, International Fund for Agricultural Development, United Nations Children’s Fund, World
Food Programme, World Health Organization; 2021. The State of Food Security and Nutrition in the World 2021. Transforming
food systems for food security, improved nutrition and affordable healthy diets for all. Rome: Food and Agriculture Organization
of the United Nations; 2021. doi.org/10.4060/cb4474en.
22. Vector-borne diseases. Fact sheet. Geneva: World Health Organization; 2020 (https://www.who.int/news-room/fact-sheets/
detail/vector-borne-diseases, accessed 20 June 2022).
23. Mental health and climate change. Policy brief. Geneva: World Health Organization; 2022 (https://www.who.int/publications/i/
item/9789240045125, accessed 19 April 2023).
24. Quantitative risk assessment of the effects of climate change on selected causes of death, 2030s and 2050s. Geneva: World
Health Organization; 2014 (https://www.who.int/publications/i/item/9789241507691, accessed 17 April 2023).
25. WHO UNFCCC Health and Climate Change Country Profiles 2015–2023. (online)[Website]:. Geneva: World Health Organization
(https://www.who.int/teams/environment-climate-change-and-health/climate-change-and-health/evidence-monitoring/
country-profiles, accessed 19 April 2023).
26. Ebi K, Åström C, Boyer C, Harrington L, Hess J, Honda Y et al. Using detection and attribution to quantify how climate change
is affecting health. Health Aff. 2020;39(12):2168–74. doi:10.1377/hlthaff.2020.01004.
27. Pörtner HO, Roberts DC, Adams H, Adelekan I, Adler C, Adrian R et al., editors. IPCC, 2022: Technical summary. In: Pörtner
H-O, Roberts DC, Tignor M, Poloczanska ES, Mintenbeck K, Alegría A et al. Climate change 2022: impacts, adaptation,
and vulnerability. Contribution of Working Group II to the Sixth Assessment Report of the Intergovernmental Panel on Climate
Change. Cambridge and New York (NY): Cambridge University Press (https://www.ipcc.ch/report/ar6/wg2/downloads/report/
IPCC_AR6_WGII_TechnicalSummary.pdf, accessed 11 May 2023).
28. Masson-Delmotte V, Zhai P, Pirani A, Connors SL, Péan C, Berger S et al., editors. IPCC, 2021: Summary for policymakers. In:
Climate change 2021: the physical science basis. Contribution of Working Group I to the Sixth Assessment Report of the
Intergovernmental Panel on Climate Change. Cambridge University Press, Cambridge, United Kingdom and New York (NY).;
2021. doi:10.1017/9781009157896.001.
29. State of the Global Climate 2021. Geneva: World Meteorological Organization; 2022 (https://public.wmo.int/en/our-mandate/
climate/wmo-statement-state-of-global-climate, accessed 19 April 2023).
30. Paris Agreement. Bonn: United Nations Framework Convention on Climate Change; 2015 (https://unfccc.int/sites/default/
files/english_paris_agreement.pdf, accessed 19 April 2023).
31. Emissions Gap Report 2022: The closing window: climate crisis calls for rapid transformation of societies. Nairobi: United
Nations Environment Programme; 2022 (https://www.unep.org/resources/emissions-gap-report-2022, accessed 17 April 2023).
32. Hamilton I, Kennard H, McGushin A, Höglund-Isaksson L, Kiesewetter G, Lott M et al. The public health implications of the
Paris Agreement: a modelling study. Lancet Planet Health. 2021;5(2):e74–83. doi.org/10.1016/S2542-5196(20)30249-7.
33. Markandya A, Sampedro J, Smith SJ, Van Dingenen R, Pizarro-Irizar C, Arto I et al. Health co-benefits from air pollution and
mitigation costs of the Paris Agreement: a modelling study. Lancet Planet Health. 2018;2:e126–33.
34. Romanello M, McGushin A, Napoli C, Drummond P, Hughes N, Jamart L et al. The 2021 report of the Lancet Countdown
on health and climate change: code red for a healthy future. Lancet 2021;398:1619–62. Published online 20 October 2021.
doi:10.1016/ S0140-6736(21)01787-6.
30
World health statistics 2023 – Monitoring health for the SDGs](https://image.slidesharecdn.com/worldhealthstatisticsreport2023-230522010451-e103b2c4/85/World-Health-Statistics-Report-2023-40-320.jpg)

![•
Box 2.2 Leveraging timely surveillance to support tuberculosis service
recovery during the COVID-19 pandemic in Zambia1
1 WHO delivering results and making an impact: stories from the ground. Geneva: World Health Organization; 2022 (https://www.who.int/publications/i/item/9789240064652,
accessed 24 March 2023).
2 Quick brief – Lessons from Zambia’s TB situation room. Lusaka and Washington (DC): Ministry of Health of Zambia and The World Bank; 2023 (https://thedocs.worldbank.
org/en/doc/5db53831f10738b0724eb33a20d8a449-0290062023/original/Zambia-TB-situation-room-lessons-quick-brief.pdf, accessed 22 April 2023).
3 Low funding, COVID-19 curtail tuberculosis fight in Africa [News release]. Brazzaville: WHO Regional Office for Africa; 24 March 2022 (https://www.afro.who.int/news/
low-funding-covid-19-curtail-tuberculosis-fight-africa, accessed 18 August 2022).
4 Global tuberculosis report 2022. Geneva: World Health Organization, 2022 (https://www.who.int/publications/i/item/9789240061729, accessed 9 May 2023).
TB is one of the leading causes of morbidity and mortality
in Zambia, especially for people living with HIV. Timely
detection, linkage to care and adherence to the TB
treatment regimen are critical to achieving successful
treatment outcomes, controlling the spread of disease
and preventing the development of drug resistance in TB.
Disruptions to the provision of, and access to, TB services
caused by the response to the coronavirus disease
(COVID-19) pandemic had a major negative impact on
people with TB in Zambia.
When Zambia reported its first case of COVID-19 on
18 March 2020, it was not surprising that TB services were
rapidly affected. TB case notifications, which averaged
3288 during the first quarter of 2020, fell to an average
of 2643 (a 19.6% reduction) in the second quarter of 2020,
as the number of confirmed COVID-19 cases began to
rise in the country and disease containment measures
were put into place.2
The Ministry of Health, with technical support from WHO,
responded by establishing closer monitoring through
the following actions:
• Weekly performance targets for TB services were
established, including notifications of both drug-
susceptible and drug-resistant TB at the national,
provincial and district levels.
• Key performance indicators were summarized for
weekly performance targets and were shared with all
districts before virtual discussions for validation and
analysis and to prompt further action and response.
The weekly virtual meetings tracked progress against
set targets, and both identified and addressed
emerging challenges to the TB response.
• Where data revealed gaps, district and provincial
officers were encouraged to discuss challenges and
identify solutions. High-performing districts and
provinces were given the opportunity to share best
practices through webinars and in-person workshops,
and low-performing districts shared their challenges
and identified the support they needed. All districts
implemented best practices in case-finding.
Notifications of TB increased consistently afterwards,
resulting in the notification of more cases in 2020
(a 7.5–10.8% increase) than in 2019, 2018 and 2017.
Using real-time surveillance, Zambia demonstrated
that it was possible to adapt to the challenges of the
pandemic and to improve essential health services to
levels exceeding pre-pandemic ones. It is worth noting
that Zambia has increased domestic funding to fight TB
sevenfold since 2015.3
WHO promoted the use of real-time data and indicators
to monitor the impact of the COVID-19 pandemic on both
TB services and the country’s response. As of August
2021, 130 countries and territories reported having in
place a digital, case-based TB surveillance system.
In the WHO African Region, the COVID-19 pandemic
has had some impact on the provision of and access to
essential TB services, the number of people diagnosed
with TB and notified as TB cases through national
disease surveillance systems, and the TB disease burden
(incidence and mortality). One of the most widely
available indicators that can be used to assess the
impact of COVID-19 related disruptions on essential TB
services at regional and country levels is the number of
notifications of people diagnosed with TB. This indicator
reflects impacts on access to diagnosis and treatment on
both the supply side (e.g. capacity to continue to provide
services) and the demand side (e.g. ability to seek care
in the context of restrictions on movement, concerns
about the risks of going to health care facilities during
a pandemic, and stigma associated with similarities in
symptoms related to TB and COVID-19). The African
Region is home to 17 of the 30 countries globally that
have the highest burden of TB.4
The WHO Regional
Office for Africa has supported countries to adapt to
the COVID-19 context, with all countries having the
continuity of essential health services as a key pillar of
the response to the COVID-19 pandemic in their strategy.
40
World health statistics 2023 – Monitoring health for the SDGs](https://image.slidesharecdn.com/worldhealthstatisticsreport2023-230522010451-e103b2c4/85/World-Health-Statistics-Report-2023-50-320.jpg)
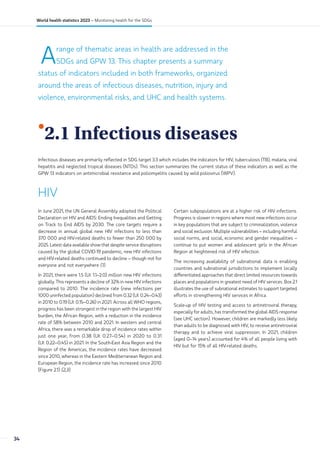
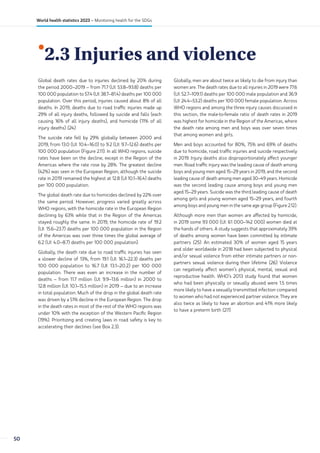
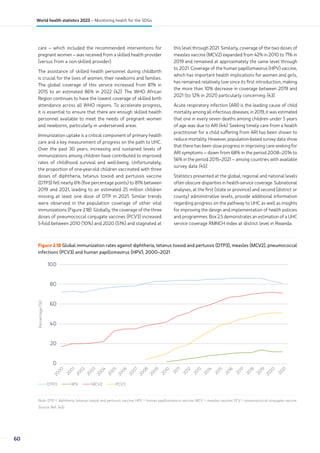
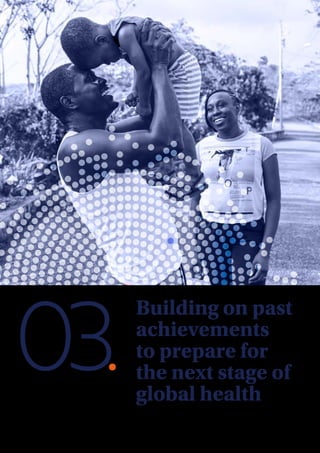
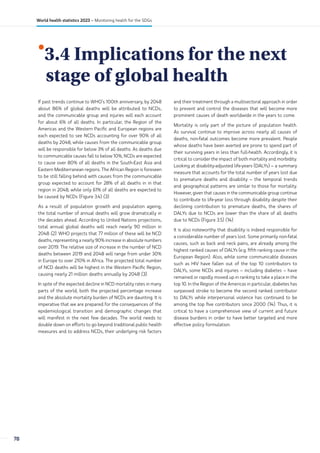
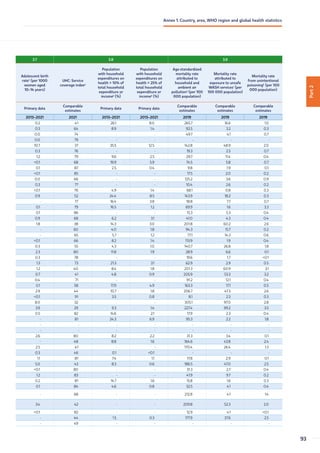
![Stunting
Stunting is the result of chronic and recurrent malnutrition
in mothers and in children who do not grow to their
maximum potential.
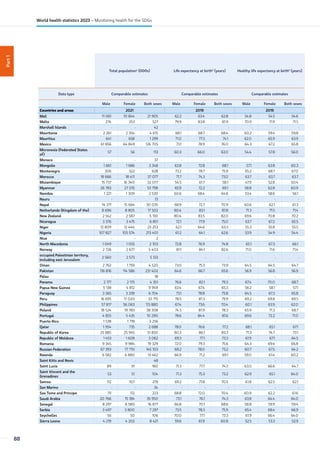
The global prevalence of stunting in children under 5 years
of age fell from 33.0% (UI: 32.4–33.5) in 2000 to 22.3%
(UI: 21.8–22.9) in 2022. The decline occurred more rapidly
during the MDG era, with an ARR of 2.0% between 2000 and
2015 – spurred by the rapid decline during the second half of
the period – compared to the decline since the start of the
SDG era in 2015, with an ARR of 1.4%.
Stunting prevalence also declined in all WHO regions, albeit
at different paces (Figure 2.8). In both the European and the
Western Pacific regions, prevalence fell by more than half
between 2000 and 2022, but the progress slowed in the
Western Pacific Region in the more recent period. In contrast,
prevalence reduction has gathered speed in the South-East
Asia and Eastern Mediterranean regions in the second half of
the MDG era.
Still, in 2022, there were 49.8 million children under 5 years
of age affected by stunting in the South-East Asia Region
[30.1% (UI: 28.3–32.0)], 56.2 million in the African Region [31.0%
(UI: 30.2–31.8)] and 22.9 million in the Eastern Mediterranean
Region [25.1% (UI: 23.4–26.8)].
Globally, an estimated 148.1 million children under 5 years of
age were affected by stunting in 2022. These numbers may
become substantially higher as the global food and nutrition
crisis continues to unfold – fueled by conflict, climate change
and the enduring effects of the COVID-19 pandemic. The full
impact of the crisis on stunting may take years to manifest (22).
Figure 2.8 Trends in prevalence of stunting and overweight in children under 5 years of age, globally and by WHO region, 2000–2022
Stunting
0
20
10
40
30
60
50
Prevalence
(%)
2
0
0
0
2
0
0
1
2
0
0
2
2
0
0
3
2
0
0
4
2
0
0
5
2
0
0
6
2
0
0
7
2
0
0
8
2
0
0
9
2
0
1
0
2
0
1
1
2
0
1
2
2
0
1
3
2
0
1
4
2
0
1
5
2
0
1
6
2
0
1
7
2
0
1
9
2
0
2
0
2
0
1
8
2
0
2
2
2
0
2
1
African Region Region of the Americas Eastern Mediterranean Region European Region
South-East Asia Region Western Pacific Region Global
46
World health statistics 2023 – Monitoring health for the SDGs](https://image.slidesharecdn.com/worldhealthstatisticsreport2023-230522010451-e103b2c4/85/World-Health-Statistics-Report-2023-56-320.jpg)
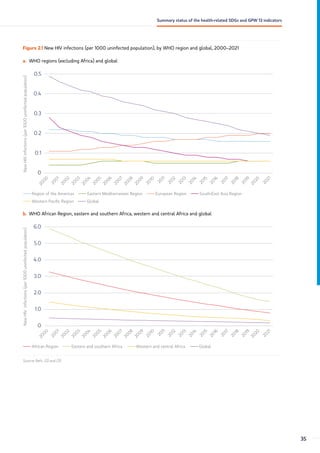
![Oveweight
0
4
2
8
6
12
10
Prevalence
(%)
2
0
0
0
2
0
0
1
2
0
0
2
2
0
0
3
2
0
0
4
2
0
0
5
2
0
0
6
2
0
0
7
2
0
0
8
2
0
0
9
2
0
1
0
2
0
1
1
2
0
1
2
2
0
1
3
2
0
1
4
2
0
1
5
2
0
1
6
2
0
1
7
2
0
1
9
2
0
2
0
2
0
1
8
2
0
2
2
2
0
2
1
African Region Region of the Americas Eastern Mediterranean Region European Region
South-East Asia Region Western Pacific Region Global
Source: Ref. (22).
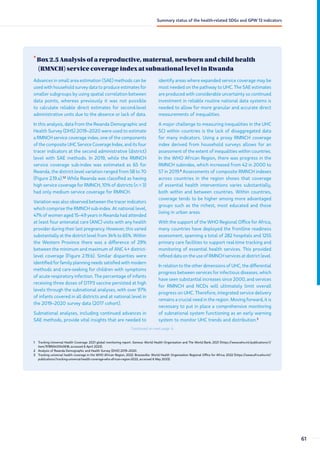
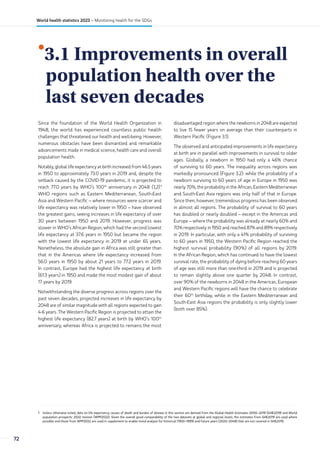
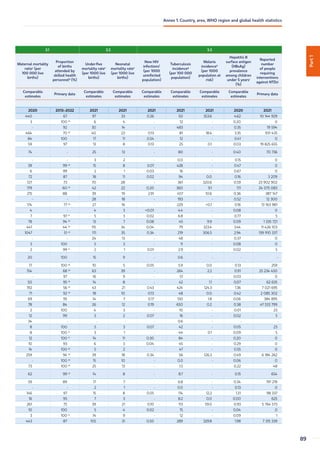
Overweight
Childhood overweight and obesity increase the risk of obesity,
NCDs, premature death and disability in adulthood. Globally
in 2000, 33.0 million children under 5 years of age [5.3%
(UI: 5.1–5.5)] were overweight. In 2022 this number had risen
to 37.0 million [5.6% (UI: 5.1–6.1)] (22).
While the global prevalence of overweight in children under
5 years of age virtually stagnated, the Western Pacific Region,
the Region of the Americas and the South-East Asian Region saw
the prevalence increasing since 2000 (Figure 2.8). Prevalence
in the other regions increased in the early 2000s but declined
in the more recent periods. The regions with the highest
prevalence in 2022 are the Region of the Americas [8.5%
(UI: 7.4–9.7)], the Western Pacific Region [8.1% (UI: 5.9–11.0)],
the European Region [7.1% (UI: 5.6–8.8)] and the Eastern
Mediterranean Region [6.3% (UI: 5.2–7.7)].
Wasting
Children suffering from wasting have weakened immunity,
are susceptible to long-term developmental delays and face an
increased risk of death, particularly when the wasting is severe.
In 2022, the prevalence of wasting in children under 5 years
of age was 6.8% (UI: 5.5–8.1), representing 45 million children.
Some 2.1% (UI: 1.5–2.6) suffered from severe wasting – the most
lethal form of undernutrition – which means that 13.7 million
children were in critical situations, with 8.1 million of them in
the South-East Asia Region (22).
The region with the highest prevalence of wasting was the
South-East Asian Region where 14.7% (UI: 11.0–19.3) of children
under 5 years of age (i.e. 24.2 million) suffered from wasting,
followed by the Eastern Mediterranean Region where the
prevalence was 6.9% (UI: 5.4–8.7) of children (i.e. 6.3 million).
47
Summary status of the health-related SDGs and GPW 13 indicators](https://image.slidesharecdn.com/worldhealthstatisticsreport2023-230522010451-e103b2c4/85/World-Health-Statistics-Report-2023-57-320.jpg)
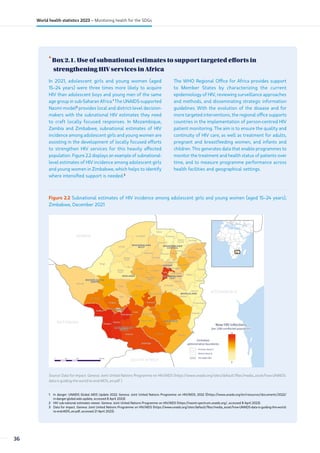
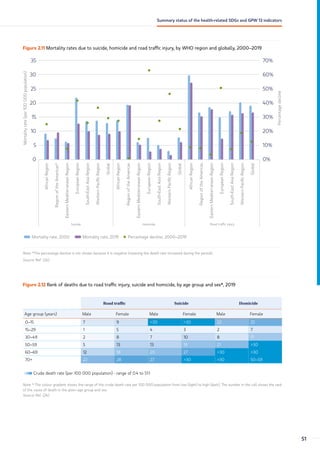
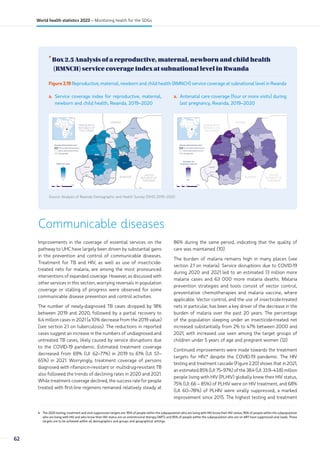
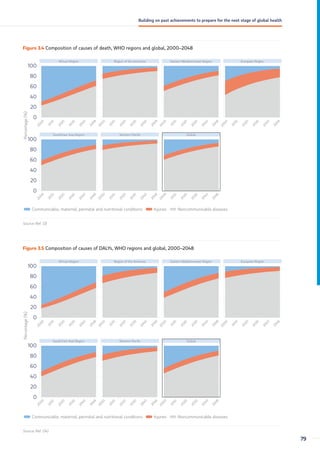
![Anaemia in women aged 15–49 years
Anaemia is an indicator of both poor nutrition and poor health,
having significant adverse health consequences for women
and their children. Severe anaemia during pregnancy increases
the risk of maternal and perinatal mortality, low birth weight,
and poor growth and development in babies. Anaemia can also
affect social and economic development as it causes fatigue
and lowered productivity.
Although the global prevalence of anaemia in women aged
15–49 years decreased slightly from 2000 [31.2% (UI: 28.7–34.1)]
to 2019 [29.9% (UI: 27.0–32.8)], the total number affected
increased considerably due to population growth – from
492.9 million in 2000 to 570.8 million in 2019. Prevalence
was higher among pregnant women [36.5% (UI: 34.0–39.1)]
than non-pregnant women [29.6% UI: 26.6–32.5)]. Globally,
the prevalence of mild anaemia increased slightly from 15.5%
(UI: 14.2–17.3) in 2000 to 16.2% (UI: 14.9–17.6) in 2019, while
moderate anaemia declined slightly from 14.1% (UI: 12.4–16.1)
in 2000 to 12.7% (UI: 10.6–14.8) in 2019, as did severe anaemia
from 1.7% (UI: 1.4–2.0) in 2000 to 1% (UI: 0.8–1.4) in 2019,
indicating a shift towards mild anaemia (Figure 2.9) (23).
Across WHO regions, there were declines in the prevalence
of total anaemia during the MDG era, but these either slowed
or halted after 2015. Between 2000 and 2019, in the WHO
Western Pacific Region, anaemia prevalence fell from 22.6%
(UI: 16.3–30.4) to 16.4% (UI: 11.4–23.5), in the African Region
it fell from 46.3% (UI: 42.5–50) to 40.4% (UI: 36.7–44.2) and
in the Region of the Americas from 19.2% (UI: 16.1–22.5) to
15.4% (UI: 12.1–19.5). The prevalence of anaemia continued to
be highest in the South-East Asia Region, 46.6% (UI: 39.4–53.1)
in 2019. Mild anaemia prevalence slightly increased in the
South-East Asia Region from 21% (UI: 19.1–22.8) in 2000 to
23.5% (UI: 20.6–26.0) in 2019 and in the Eastern Mediterranean
Region from 18.4 (UI: 16.3–20.7) to 19.6 (UI: 16.5–22.6). In the
same period, moderate and severe anaemia declined in all
WHO regions.
Figure 2.9 Global prevalence of anaemia by severity levels* in women aged 15–49 years, 2000–2019
0
20
15
10
5
30
25
35
40
50
45
2
0
0
0
2
0
0
1
2
0
0
2
2
0
0
3
2
0
0
4
2
0
0
5
2
0
0
6
2
0
0
7
2
0
0
8
2
0
0
9
2
0
1
0
2
0
1
1
2
0
1
2
2
0
1
3
2
0
1
4
2
0
1
5
2
0
1
6
2
0
1
7
2
0
1
8
2
0
1
9
Anaemia
prevalence
(%)
Severe anaemia Mild anaemia
Moderate anaemia
1.7 1.1
14.1
12.2 12.7
1.0
15.5
15.5
16.2
Note: *Mild anaemia is defined as haemoglobin concentrations of 110–119 g/L in non-pregnant women, and concentrations of 100–109 g/L in pregnant women;
moderate anaemia is defined as haemoglobin concentrations of 80–109 g/L in non-pregnant women and 70–99 g/L in pregnant women; and severe anaemia is
defined as haemoglobin concentration below 80 g/L in non-pregnant women and below 70 g/L in pregnant women.
Source: Ref. (23).
48
World health statistics 2023 – Monitoring health for the SDGs](https://image.slidesharecdn.com/worldhealthstatisticsreport2023-230522010451-e103b2c4/85/World-Health-Statistics-Report-2023-58-320.jpg)
![•
Box 2.3. Ratifying Mexico’s National Law of Mobility and Road Safety1
1 WHO delivering results and making an impact: stories from the ground. Geneva: World Health Organization; 2022 (https://www.who.int/publications/i/item/9789240064652,
accessed 24 March 2023).
2 The burden of road injuries [website]. Washington (DC): Pan American Health Organization; 2021 (https://www.paho.org/en/enlace/burden-road-injuries, accessed 20 July 2022)
3 National Law of Mobility and Road Safety. Government of Mexico, Chamber of Deputies (https://www.diputados.gob.mx/LeyesBiblio/pdf/LGMSV.pdf, accessed 3 April 2023).
4 Global Plan for the Decade of Action for Road Safety 2021–2030. Geneva: World Health Organization; 2021 (https://www.who.int/publications/m/item/global-plan-for-
the-decade-of-action-for-road-safety-2021-2030, accessed 22 April 2023).
The number of road traffic fatalities in Mexico, a country
of nearly 130 million people, has remained consistently
high in recent years, despite extensive efforts at national
and subnational levels. More than 16 000 deaths were
recorded in 2019 alone.2
Road traffic injuries were
estimated to be the tenth leading cause of death.3
There was a lack of accountability in different sectors
and institutions of the federal government, which was
challenging for intersectoral coordination and progress in
road safety to prevent fatal and non-fatal traffic injuries.
Laws related to speeding, alcohol limits and licensing
were created subnationally, with levels of government
responsible for planning, designing and operating
transport systems mostly working independently.
A crucial constitutional amendment was introduced in
2020 that recognized “mobility under the conditions
of safety, accessibility, efficiency, sustainability, quality,
inclusion and equality” as a universal right. The stage
was set for a new national law to harmonize all actions
and to enshrine an integrated “safe system” approach
that recognized road safety as key to saving lives and
achieving the SDGs.
The National Law of Mobility and Road Safety calls for the
establishment of the proven and life-saving “safe system”
approach, which is fully aligned with the Global Plan for
the Decade of Action for Road Safety 2021–2030.4
The
Law of Mobility and Road Safety prioritizes the safety
of the most vulnerable road users (i.e. pedestrians,
cyclists and people with disabilities) and promotes
sustainable and equitable mobility for all. It clarifies roles
and responsibilities within the Mexican government and
calls for the creation of a unified database for licences,
number plates and fines. Moreover, it incorporates the
majority of WHO’s recommendations to promote the
safe use of equipment (e.g. helmets, seatbelts and child
restraints) and to reduce road users’ exposure to key risk
factors (e.g. speeding, use of mobile telephones while
driving, and driving under the influence of alcohol). After
approval by the Senate and the Chamber of Deputies,
the Law was published on 17 May 2022. This momentous
safe mobility law should be viewed as an integrated
component of many important policy areas, including
child health, climate action, gender, poverty and equity.
Having the country’s mobility systems firmly rooted in
safety will bring a range of benefits to human health
and the environment, reducing the social and economic
toll of road tragedies and addressing gender equity on
access to safe mobility.
Mexico’s National Law of Mobility and Road Safety
marks a major step forward in the country’s efforts
to reduce the persistently high number of road traffic
deaths and boost equitable and sustainable access to
transport services for all. The Law is expected to lead
to a significant reduction in deaths due to road traffic
injuries in Mexico.
52
World health statistics 2023 – Monitoring health for the SDGs](https://image.slidesharecdn.com/worldhealthstatisticsreport2023-230522010451-e103b2c4/85/World-Health-Statistics-Report-2023-62-320.jpg)
![•
Box 2.4 New data for assessing water, sanitation and hygiene services in
Montenegrin health-care facilities1
1 WHO delivering results and making an impact: stories from the ground. Geneva: World Health Organization; 2022 (https://www.who.int/publications/i/item/9789240064652,
accessed 24 March 2023).
2 Resolution WHA72.7. Water, sanitation and hygiene in health care facilities. In: Seventy-second World Health Assembly, 20–28 May 2019. Resolutions and decisions, annexes.
Geneva: World Health Organization; 2019 (https://apps.who.int/gb/ebwha/pdf_files/WHA72/A72_R7-en.pdf, accessed 2 March 2023).
3 Joint Monitoring Programme for Water Supply, Sanitation and Hygiene – global database [website]. Geneva: World Health Organization/United Nations Children’s Fund;
2023 (https://washdata.org/monitoring/health-care-facilities, accessed 2 March 2023).
4 National situation assessment of water, sanitation and hygiene (WASH) in health care facilities in Montenegro. Podgorica: Ministry of Health of Montenegro and Institute
of Public Health of Montenegro (in preparation).
In 2019, the World Health Assembly adopted resolution
WHA72.7 on water, sanitation and hygiene (WASH)
in health-care facilities,2
calling for adequate WASH
services for providing safe, people-centred health care
and achieving UHC. Integration of WASH in health-care
services can catalyse improvements in quality of care,
staff morale and performance, health-care costs, disaster/
outbreak resilience, infection prevention and control,
and reductions in antimicrobial resistance. A key action
is to conduct assessments of WASH conditions, on the
basis of which follow-up interventions at the policy
and practical levels should be identified and prioritized.
In 2021, the Institute of Public Health of Montenegro
undertook – in partnership with the WHO European
Centre for Environment and Health and the Organization’s
Country Office in Montenegro – an analysis of existing
policies and the broader enabling environment,
as well as a baseline survey of the actual situation
in facilities. Internationally recognized indicators for
basic and expanded WASH services established by the
WHO/UNICEF Joint Monitoring Programme for Water
Supply, Sanitation and Hygiene were used to track
progress with WASH-related SDG targets.3
Data were
collected from all public and selected private health-
care facilities in the country at all levels of care (151
in total). The findings indicated that there was good
basic provision of various WASH components in many
health-care facilities, especially with respect to water
(88%) and hand hygiene (78%), and medium coverage of
waste management provision (62%). However, the basic
provision of environmental cleaning (13%) and sanitation
(16%) remained a challenge in many health-care facilities
across the country.4
Challenges in WASH service provision
were observed more often in facilities providing primary
care services and those located in rural areas, as well as
in private facilities for waste management.
The outcomes of the survey highlighted strengths and
gaps and will help in developing and implementing
targeted interventions, both at the governance level and
in practice at the facility level (e.g. by strengthening the
national surveillance system and developing the capacity
of medical and nonmedical staff. The outcomes also
supported national reporting for global monitoring of
progress towards achieving SDG3 (Ensure healthy lives
and promote well-being for all at all ages) and SDG6
(Ensure availability and sustainable management of
water and sanitation for all).
Following the assessment, since 2022 water quality
control in all public health care facilities was included in
the regular surveillance programme. Also planned was
the integration of provisions related to WASH operation
and maintenance in legislation, and the development of
a programme dedicated to private health-care facilities
in order to enhance capacity-building in health-care
waste management.
55
Summary status of the health-related SDGs and GPW 13 indicators](https://image.slidesharecdn.com/worldhealthstatisticsreport2023-230522010451-e103b2c4/85/World-Health-Statistics-Report-2023-65-320.jpg)
![19. Poliomyelitis (website). Geneva: World Health Organization; 2022 (https://www.who.int/news-room/fact-sheets/detail/
poliomyelitis, accessed 8 March2023).
20. Global Polio Eradication Initiative (website). Geneva: World Health Organization (https://polioeradication.org/polio-today/
polio-now/wild-poliovirus-list/, accessed 8 March2023)
21. Polio Eradication Strategy 2022–2026. Delivering on a promise. Geneva: World Health Organization on behalf of the Global
Polio Eradication Initiative; 2021 (https://apps.who.int/iris/bitstream/handle/10665/345967/9789240031937-eng.pdf, accessed
26 March 2023).
22. Levels and trends in child malnutrition. UNICEF/WHO/World Bank Group Joint Child Malnutrition Estimates. New York (NY),
Geneva and Washington (DC): United Nations Children’s Fund, World Health Organization and the World Bank Group; 2023.
23. Global anaemia estimates, 2021 edition. Geneva: World Health Organization, 2021 (https://www.who.int/data/gho/data/
themes/topics/anaemia_in_women_and_children, accessed 5 April 2023).
24. Global health estimates 2019: deaths by cause, age, sex, by country and by region, 2000–2019. Global Health Observatory
data. Geneva: World Health Organization; 2020 (https://www.who.int/data/global-health-estimates, accessed 3 April 2023).
25. Stöckl H, Devries K, Rotstein A, Abrahams N, Campbell J, Watts C et al. The global prevalence of intimate partner homicide:
a systematic review. Lancet. 2013;382(9895):859–65.
26. Violence against women prevalence estimates, 2018. Geneva: World Health Organization; 2021 (https://www.who.int/
publications/i/item/9789240022256, accessed 3 April 2023).
27. Global and regional estimates of violence against women: prevalence and health impacts of intimate partner violence and non-
partner sexual violence. Geneva: World Health Organization; 2013 (https://www.who.int/publications/i/item/9789241564625,
accessed 3 April 2023).
28. Preventing disease through healthy environments: a global assessment of the burden of disease from environmental risks.
Geneva: World Health Organization; 2018 (https://www.who.int/publications/i/item/9789241565196, accessed 24 March
2023). The updated 2016 data tables for the WHO publication Preventing disease through healthy environments. Geneva:
World Health Organization; 2019 are also available via the same link.
29. Progress on household drinking water, sanitation and hygiene 2000–2020: five years into the SDGs. Geneva: World Health
Organization and the United Nations Children’s Fund; 2021 (https://washdata.org/sites/default/files/2022-01/jmp-2021-
wash-households-highlights.pdf, accessed 7 February 2023).
30. Progress on wastewater treatment – Global status and acceleration needs for SDG indicator 6.3.1. New York (NY) and Geneva:
United Nations Human Settlements Programme and World Health Organization; 2021 (https://www.unwater.org/publications/
progress-wastewater-treatment-2021-update, accessed 16 May 2023).
31. SDG indicators database. New York (NY): United Nations Department of Economic and Social Affairs (https://unstats.un.org/
sdgs/dataportal/database, accessed 22 April 2023).
32. Public health and environment [online database]. Global Health Observatory data. Geneva: World Health Organization (https://
www.who.int/data/gho/data/themes/public-health-and-environment, accessed 9 April 2023).
33. Official development assistance for the water sector (water supply and sanitation, agricultural water resources, and hydro-
electric power plants), 2023. Creditor reporting system (CRS). Paris: Organization for Economic Co-operation and Development
(https://stats.oecd.org/Index.aspx?DataSetCode=crs1, accessed 22 April 2023).
34. Strong systems and sound investments: evidence on and key insights into accelerating progress on sanitation, drinking-water
and hygiene. The UN-Water global analysis and assessment of sanitation and drinking-water (GLAAS) 2022 report. Geneva:
World Health Organization; 2022 (https://glaas.who.int/glaas/un-water-global-analysis-and-assessment-of-sanitation-and-
drinking-water-(glaas)-2022-report, accessed 22 April 2023).
35. WHO global air quality guidelines: particulate matter (PM2.5
and PM10
), ozone, nitrogen dioxide, sulfur dioxide and carbon monoxide.
Geneva, World Health Organization; 2021 (https://apps.who.int/iris/bitstream/handle/10665/345329/9789240034228-eng.
pdf, accessed 24 March 2023).
36. The public health impacts of chemicals: knowns and unknowns – 2021 data addendum. Geneva: World Health Organization;
2021 (https://www.who.int/publications/i/item/WHO-HEP-ECH-EHD-21.01, accessed 22 April 2023).
68
World health statistics 2023 – Monitoring health for the SDGs](https://image.slidesharecdn.com/worldhealthstatisticsreport2023-230522010451-e103b2c4/85/World-Health-Statistics-Report-2023-78-320.jpg)
![37. Coverage of essential health services (SDG 3.8.1) [online database]. Global Health Observatory. Geneva: World Health
Organization; 2023. (https://www.who.int/data/gho/data/themes/topics/service-coverage).
38. SDG 3.8.2 Catastrophic health spending (and related indicators) [online database]. Global Health Observatory. Geneva: World
Health Organization; 2023. (https://www.who.int/data/gho/data/themes/topics/financial-protection).
39. Estimates and projections of family planning indicators 2022. New York (NY): United Nations Department of Economic
and Social Affairs, Population Division; 2022 (https://www.un.org/development/desa/pd/data/family-planning-indicators,
accessed 6 April 2013).
40. WHO recommendations on antenatal care for a positive pregnancy experience. Geneva: World Health Organization; 2016 (https://
www.who.int/publications/i/item/9789241549912, accessed 7 April 2023).
41. Maternal and reproductive health. Global Health Observatory data. Geneva: World Health Organization (https://www.who.
int/data/gho/data/themes/maternal-and-reproductive-health, accessed 7 April 2023).
42. UNICEF/WHO joint database on births attended by skilled health personnel (https://data.unicef.org/topic/maternal-health/
delivery-care/, accessed 7 April 2023).
43. WHO/UNICEF Joint Estimates of National Immunization Coverage (WUENIC), 2021 revision (https://immunizationdata.who.
int, accessed 7 April 2023).
44. Perin J, Mulick A, Yeung D, Villavicencio F, Lopez G, Strong KL et al. Global, regional, and national causes of under-5 mortality
in 2000–19: an updated systematic analysis with implications for the Sustainable Development Goals. Lancet Child
Adolescent Health. 2021;6(2):106-15 (https://www.thelancet.com/journals/lanchi/article/PIIS2352-4642(21)00311-4/fulltext,
accessed 7 April 2023).
45. Children aged 5 years with pneumonia symptoms taken to a healthcare provider (%). Global Health Observatory data.
Geneva: World Health Organization (https://www.who.int/data/gho/data/indicators/indicator-details/GHO/children-aged-
5-years-with-pneumonia-symptoms-taken-to-a-healthcare-provider-(-), access 7 April 2023).
46. NCD Risk Factor Collaboration (NCD-RisC). Worldwide trends in hypertension prevalence and progress in treatment and
control from 1990 to 2019: a pooled analysis of 1201 population-representative studies with 104 million participants.
Lancet. 2021;398(10304):957–80.
47. Assessing national capacity for the prevention and control of noncommunicable diseases: report of the 2019 global survey.
Geneva: World Health Organization; 2020 (https://www.who.int/publications/i/item/9789240002319, accessed 7 April 2023).
48. Global health estimates 2019: disease burden by cause, age, sex, by country and by region, 2000–2019. Geneva, World
Health Organization; 2020 (https://www.who.int/data/gho/data/themes/mortality-and-global-health-estimates, accessed
22 April 2023).
49. Mental health atlas 2020. Geneva: World Health Organization; 2021 (https://www.who.int/publications/i/item/9789240036703,
accessed 22 April 2023).
50. Moitra M, Santomauro D, Collins PY, Vos T, Whiteford H, Saxena S et al. The global gap in treatment coverage for major
depressive disorder in 84 countries from 2000–2019: a systematic review and Bayesian meta-regression analysis. PLoS Med.
2022;19(2):e1003901. doi:10.1371/journal.pmed.1003901.
51. Stelmach R, Kocher EL, Kataria I, Jackson-Morris AM, Saxena S, Nugent R. The global return on investment from preventing
and treating adolescent mental disorders and suicide: a modelling study. BMJ Glob Health. 2022;7e007759. doi:10.1136/
bmjgh-2021-007759.
52. Mekonen T, Chan GCK, Connor J, Hall W, Hides L, Leung J. Treatment rates for alcohol use disorders: a systematic review
and meta-analysis. Addiction. 2021;116(10):2617–34. doi:10.1111/add.15357.
53. World Drug Report 2021. Vienna: United Nations Office on Drugs and Crime; 2021 (https://www.unodc.org/unodc/en/data-
and-analysis/wdr2021.html, accessed 22 April 2023).
54. Degenhardt L, Glantz M, Evans-Lacko S, Sadikova E, Sampson N, Thornicroft G et al. Estimating treatment coverage for people
with substance use disorders: an analysis of data from the World Mental Health Surveys. World Psychiatry. 2017;16(3):299–307.
doi: 10.1002/wps.20457.
55. Feigin VL, Vos T, Nichols E, Owolabi MO, Carroll WM, Dichgans M, et al. The global burden of neurological disorders: translating
evidence into policy. Lancet Neurol. 2020 Mar;19(3):255-265. doi: 10.1016/S1474-4422(19)30411-9.
69
Summary status of the health-related SDGs and GPW 13 indicators](https://image.slidesharecdn.com/worldhealthstatisticsreport2023-230522010451-e103b2c4/85/World-Health-Statistics-Report-2023-79-320.jpg)


![Footnotes
a World population prospects: 2022 revision. New York (NY): United Nations, Department of Economic and Social Affairs,
Population Division; 2022 (https://population.un.org/wpp/, accessed 30 April 2023). For Member States with a total population
less than 90 000, the male, female values are not shown but are included in the regional and global sums. Male and female
may not sum to both sexes due to rounding.
b Global health estimates 2019: Life expectancy, 2000–2019. Geneva: World Health Organization; 2020 (https://www.who.
int/data/gho/data/themes/mortality-and-global-health-estimates/, accessed 30 April 2023). WHO Member States with a
population of less than 90 000 in 2019 were not included in the analysis.
c Trends in maternal mortality 2000 to 2020: estimates by WHO, UNICEF, UNFPA, World Bank Group and UNDESA/Population
Division. Geneva: World Health Organization; 2023 (https://www.who.int/publications/i/item/9789240068759, accessed
30 April 2023). WHO Member States excluded due to small populations: Andorra, Cook Islands, Dominica, Marshall Islands,
Monaco, Nauru, Niue, Palau, Saint Kitts and Nevis, San Marino and Tuvalu.
d UNICEF/WHO joint database on births attended by skilled health personnel, 2023 (https://data.unicef.org/topic/maternal-
health/delivery-care/, accessed 30 April 2023); Global Health Observatory (GHO) data (https://www.who.int/data/gho/data/
indicators/indicator-details/GHO/births-attended-by-skilled-health-personnel-(-), accessed 30 April 2023).
e Levels and trends in child mortality. Report 2022. Estimates developed by the UN Inter-agency Group for Child Mortality
Estimation. United Nations Children’s Fund, World Health Organization, World Bank Group and United Nations Population
Division. New York: United Nations Children’s Fund; 2023 (https://data.unicef.org/resources/levels-and-trends-in-child-mortality/,
accessed 30 April 2023).
f AIDSinfo [online database]. Geneva: Joint United Nations Programme on HIV/AIDS (UNAIDS) (http://aidsinfo.unaids.org);
and HIV/AIDS [online database], Global Health Observatory (GHO) data. Geneva: World Health Organization (https://www.
who.int/data/gho/data/indicators/indicator-details/GHO/new-hiv-infections-(per-1000-uninfected-population), accessed
30 April 2023).
g Global tuberculosis report 2022. Geneva: World Health Organization; 2022 (https://www.who.int/publications/i/
item/9789240061729, accessed 30 April 2023).
h World malaria report 2022. Geneva: World Health Organization; 2022 (https://www.who.int/publications/i/item/9789240064898,
accessed 30 April 2023). “-” indicates countries or regions that are malaria-free.
i Global and country estimates of immunization coverage and chronic HBV infection. Geneva: World Health Organization (http://
situatedlaboratories.net/who-hepB-dashboard/src/#global-strategies, accessed 30 April 2023).
j Neglected tropical diseases [online database]. Global Health Observatory (GHO) data. Geneva: World Health Organization
(https://www.who.int/data/gho/data/themes/topics/topic-details/GHO/neglected-tropical-diseases, accessed 30 April
2023). Global and regional aggregates include imputation of incomplete reports.
k Global health estimates 2019: deaths by cause, age, sex, by country and by region, 2000–2019. Geneva: World Health
Organization; 2020 (https://www.who.int/data/gho/data/themes/mortality-and-global-health-estimates/, accessed 2 May
2022). WHO Member States with a population of less than 90 000 in 2019 were not included in the analysis.
l WHO Global Information System on Alcohol and Health (GISAH) [online database]. Global Health Observatory (GHO) data.
Geneva: World Health Organization (https://www.who.int/data/gho/data/themes/topics/topic-details/GHO/levels-of-
consumption/, accessed 30 April 2023).
m World Contraceptive Use 2022. New York (NY): United Nations, Department of Economic and Social Affairs, Population
Division (https://www.un.org/development/desa/pd/data/world-contraceptive-use, accessed 30 April 2023). Global and
regional aggregates are from the Estimates and Projections of Family Planning Indicators 2022. New York (NY): United Nations,
Department of Economic and Social Affairs, Population Division.
n Most recent updates provided by the Population Division, of the UN Department of Economic and Social Affairs to the SDG
Indicators, Global SDG Database (https://unstats.un.org/sdgs/indicators/database, accessed 30 April 2023). Global and
regional aggregates are from the World population prospects: the 2022 revision. New York: United Nations, Department of
Economic and Social Affairs, Population Division.](https://image.slidesharecdn.com/worldhealthstatisticsreport2023-230522010451-e103b2c4/85/World-Health-Statistics-Report-2023-126-320.jpg)
![o Coverage of essential health services (SDG 3.8.1) [online database]. Global Health Observatory. Geneva: World Health
Organization; 2023. (https://www.who.int/data/gho/data/themes/topics/service-coverage). These values were part of the
May 2023 update and may have since changed due to updated tracer indicated values.
p SDG 3.8.2 Catastrophic health spending (and related indicators) [online database]. Global Health Observatory. Geneva: World
Health Organization; 2023. (https://www.who.int/data/gho/data/themes/topics/financial-protection).
q Public health and environment [online database]. Global Health Observatory (GHO) data. Geneva: World Health Organization
(https://www.who.int/data/gho/data/themes/public-health-and-environment/GHO/public-health-and-environment, accessed
30 April 2023). WHO Member States with a population of less than 90 000 in 2019 were not included in the analysis.
r Public health and environment [online database]. Global Health Observatory (GHO) data. Geneva: World Health Organization
(https://www.who.int/data/gho/data/themes/public-health-and-environment/GHO/public-health-and-environment, accessed
30 April 2023). WHO Member States with a population of less than 90 000 in 2019 were not included in the analysis.
s WHO global report on trends in prevalence of tobacco use 2000–2025, fourth edition. Geneva: World Health Organization;
2021 (https://www.who.int/publications/i/item/9789240039322, accessed 2 May 2022).
t WHO/UNICEF Joint Estimates of National Immunization Coverage (WUENIC), 2022 revision. (https://immunizationdata.who.
int/listing.html?topic=coveragelocation=, accessed 30 April 2023).
u Official development assistance for the health sectors, 2021. Creditor reporting system (CRS) of the Organization for Economic
Co-operation and Development (OECD) (https://stats.oecd.org/Index.aspx?DataSetCode=crs1, accessed 30 April 2023).
Per capita figures were calculated by WHO using population estimates from: World population prospects: 2022 revision,
United Nations, Department of Economic and Social Affairs, Population Division. Includes CRS purpose codes for medical
research (12182) and basic health (122:I.2.b).
v Data collected with the WHO Essential Medicines and Health Products Price and Availability Monitoring Mobile Application
(WHO EMP MedMon): (https://www.who.int/news/item/18-02-2018-medmon-mobile-application, accessed 30 April 2023) and
Health Action International’s Medicine Prices, Availability, Affordability Price Components database (HAI/WHO): (https://
haiweb.org/what-we-do/price-availability-affordability/price-availability-data/, accessed 30 April 2023).
w Global Health Workforce Statistics [online database]. Global Health Observatory data. Geneva: World Health Organization
(https://www.who.int/data/gho/data/themes/topics/topic-details/GHO/health-workforce, accessed 30 April 2023). Country
comparisons are affected by differences in the occupations included. Refer to the source for country-specific definitions and
other descriptive metadata. Global and regional aggregates were calculated using country data between 2014 and 2021.
x International Health Regulations (2005) – States Parties Annual Self-Assessment Reports – Monitoring Framework [online
database]. Global Health Observatory data. Geneva: World Health Organization (https://extranet.who.int/e-spar/, accessed
30 April 2023). Responses received for SPAR 2022 annual report as of 31 March 2023. Regional and global averages may
include two IHR States Parties not shown in the table (Liechtenstein and Holy See). Data for Afghanistan was provided by
the WHO Country Office in Afghanistan.
y Global Antimicrobial Resistance and Use Surveillance System (GLASS). Geneva: World Health Organization; 2022. Global
values shown are median of country figures and are not population weighted averages.
z Global Health Expenditure Database. Geneva: World Health Organization (https://apps.who.int/nha/database, accessed 30 April
3023). The WHO regional and global averages are unweighted. This indicator is presented here because it could constitute
the health-related portion of the SDG Indicator 1.a.2.
aa Levels and trends in child malnutrition. UNICEF/WHO/World Bank Group Joint Child Malnutrition Estimates. New York (NY),
Geneva and Washington (DC): United Nations Children’s Fund, World Health Organization and the World Bank Group; 2023.
(https://www.who.int/teams/nutrition-and-food-safety/monitoring-nutritional-status-and-food-safety-and-events/joint-child-
malnutrition-estimates, accessed 30 April 2023).
ab Global anaemia estimates, 2021 edition. Geneva: World Health Organization, 2021 (https://www.who.int/data/gho/data/
themes/topics/anaemia_in_women_and_children, accessed 30 April 2023).
ac Violence against women prevalence estimates, 2018. Global, regional and national prevalence estimates for intimate partner
violence against women and global and regional prevalence estimates for non-partner sexual violence against women. Geneva:
World Health Organization; 2021 (https://www.who.int/publications/i/item/9789240022256, accessed 2 May 2022). Given](https://image.slidesharecdn.com/worldhealthstatisticsreport2023-230522010451-e103b2c4/85/World-Health-Statistics-Report-2023-127-320.jpg)
![the lack of consensus on the definition and standardized measurement of psychological intimate partner violence, the current
estimates include only physical and/or sexual partner violence. As the majority of the available survey data on intimate partner
violence are for women aged 15–49 years, with sparse data for women aged 15 years and older, the estimates are presented
for the 15–49 years age group.
ad Progress on household drinking water, sanitation and hygiene 2000-2020: five years into the SDGs. Geneva: World Health
Organization and the United Nations Children’s Fund; 2021 (https://washdata.org/sites/default/files/2022-01/jmp-2021-wash-
households_3.pdf, accessed 30 April 2023). Comparable estimates are only shown for countries with recent primary data.
Global and regional aggregates are calculated to include country data not shown in the table.
ae United Nations Global SDG Indicators Data Platform (https://unstats.un.org/sdgs/dataportal, accessed 25 April 2023).
af Official development assistance for the water sector (water supply and sanitation, agricultural water resources, and hydro‑electric
power plants), 2023 as of 23 March 2023. Creditor reporting system (CRS) of the Organization for Economic Co-operation and
Development (OECD) (https://stats.oecd.org/Index.aspx?DataSetCode=crs1, accessed 30 April 2023). Includes CRS purpose
codes for water supply and sanitation (CRS 140XX), agricultural water resources (CRS 31140), and hydro-electric power plants
(CRS 23220). Global aggregate includes country and regional data not shown in the table.
ag Public health and environment [online database]. Global Health Observatory data. Geneva: World Health Organization
(https://www.who.int/data/gho/data/themes/public-health-and-environment/GHO/public-health-and-environment, accessed
30 April 2023).
ah Data from Global Polio Eradication Initiative as of 12 April 2023 (https://polioeradication.org/polio-today/polio-now/wild-
poliovirus-list/, accessed 12 April 2023).
ai Risk factors in noncommunicable diseases [online database]. Global Health Observatory data. Geneva: World Health Organization
(https://www.who.int/data/gho/data/themes/topics/topic-details/GHO/noncommunicable-diseases---risk-factors, accessed
30 April 2023). This indicator is presented here as a proxy for the GPW 13 indicator “age-standardized prevalence of raised
blood pressure among persons aged 18+ years”, as the estimates are more recent.
aj Risk factors in noncommunicable diseases [online database]. Global Health Observatory data. Geneva: World Health Organization
(https://www.who.int/data/gho/data/themes/topics/topic-details/GHO/noncommunicable-diseases---risk-factors, accessed
30 April 2023).
ak Non-standard definition. For more details see: UNICEF/WHO joint database on births attended by skilled health personnel
(footnote “d”).
al Proportion of institutional births (%) used as proxy for the SDG indicator.
am Non-standard definition. For more details see: World Contraceptive Use 2021 (footnote “m”).
an Estimate refers to smoking only, but is expected to be similar to all tobacco use.
ao Data for capital city only.
ap Data from private sector only.
aq Oedema data was not considered in the analysis.
ar Non-standard definition. For more details, see respective survey(s) comments available at: https://www.who.int/data/gho/
data/indicators/indicator-details/GHO/gho-jme-country-children-aged-5-years-wasted-br-(-weight-for-height--2-sd) (accessed
30 April 2023).
as Most recent input data is before 2000, interpret with caution.
at Data collection excluded some regions or populations. For more details, see respective survey(s) comments available at: https://
www.who.int/data/gho/data/indicators/indicator-details/GHO/gho-jme-country-children-aged-5-years-wasted-br-(-weight-for-
height--2-sd) (accessed 30 April 2023).
au For high-income countries classified as high-income in the 2021 fiscal year with no information on clean fuel use, usage is
assumed to be 100%.
av Only hospital consumption is reported.
aw Only community consumption is reported.
ax Only public sector reported.](https://image.slidesharecdn.com/worldhealthstatisticsreport2023-230522010451-e103b2c4/85/World-Health-Statistics-Report-2023-128-320.jpg)

The World Health Statistics 2023 report by the World Health Organization provides a comprehensive overview of global health trends and challenges, focusing on progress towards the Sustainable Development Goals (SDGs). It highlights significant achievements in global health prior to the COVID-19 pandemic, which exacerbated existing inequalities and disrupted essential health services, resulting in increased mortality and healthcare disparities. The report emphasizes the urgent need for increased investment and targeted interventions to meet SDG targets by 2030 while addressing the ongoing impacts of climate change on health.


![CTEV [ clubfoot] DR ARUN LAL ,DR MOHAMED ASHRAF travancore medical college k...](https://cdn.slidesharecdn.com/ss_thumbnails/ctevclubfootdrarunlaldrmohamedashraftravancoremedicalcollegekollamkeralaindia-260208063247-18fc466c-thumbnail.jpg?width=640&height=640&fit=bounds)


