Download to read offline


![66 | WORLD DEVELOPMENT REPORT 2024
a. World Bank 2024.
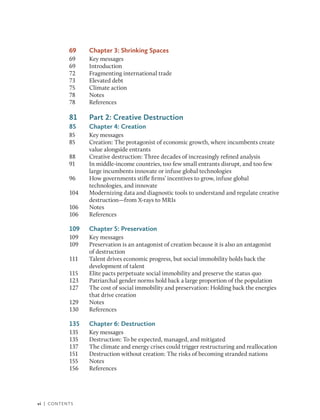
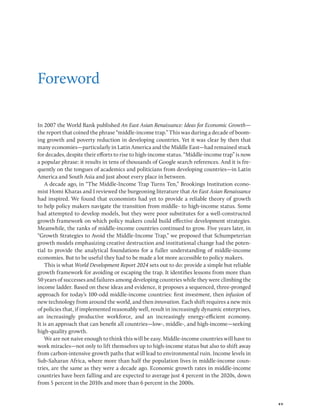
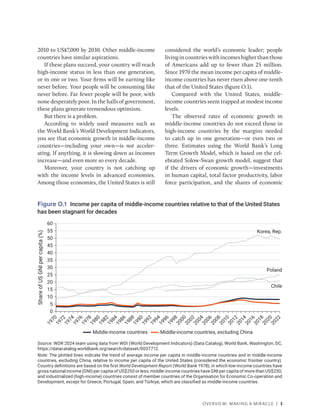
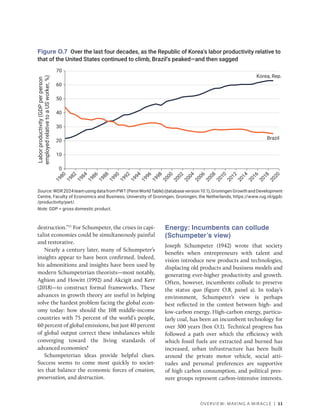
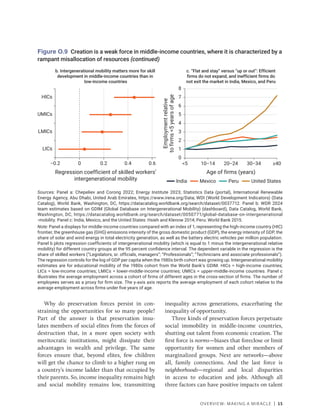
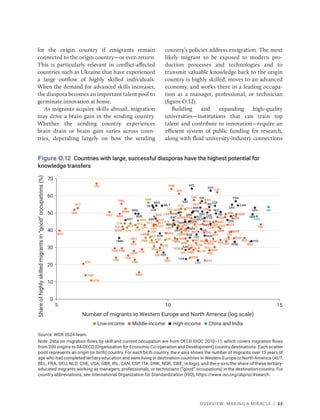
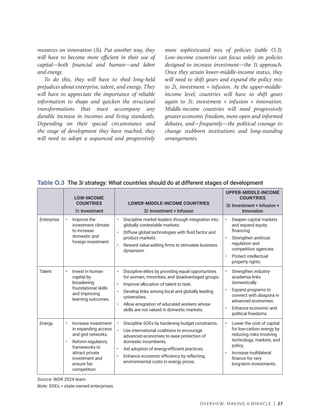
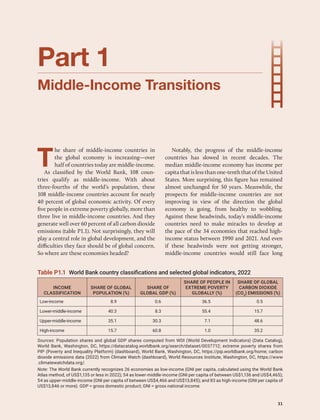
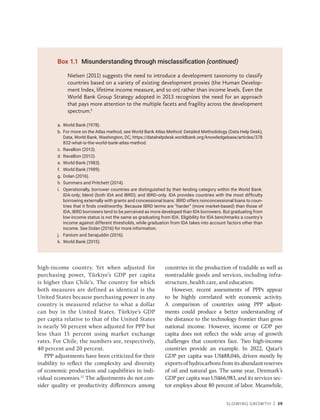
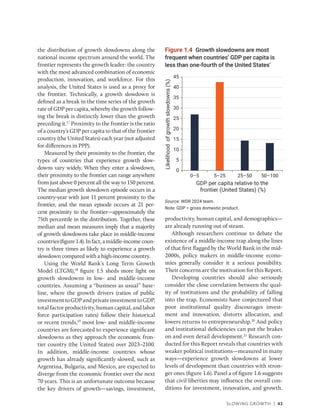
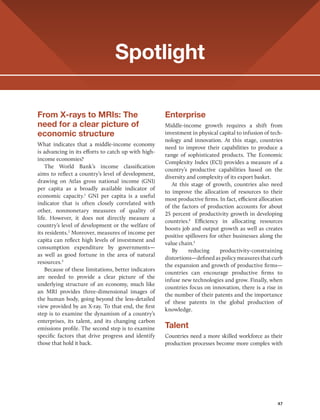
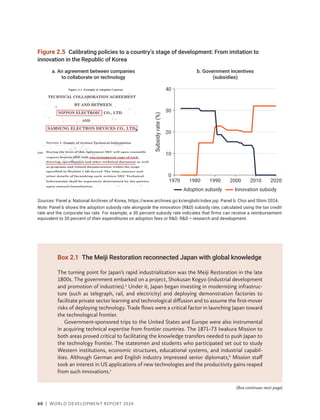
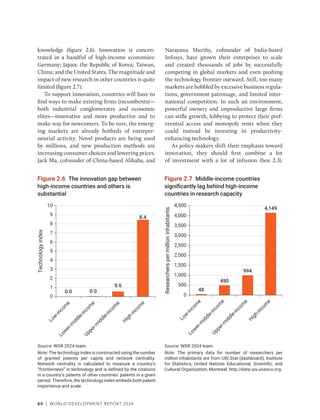
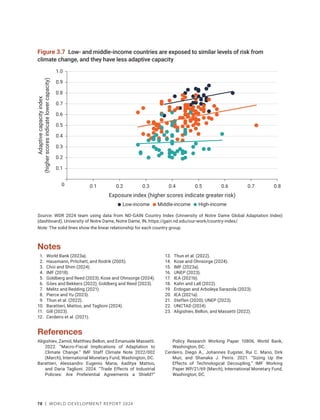
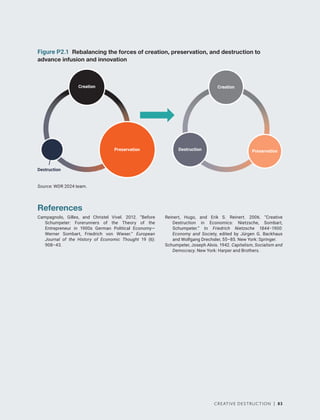
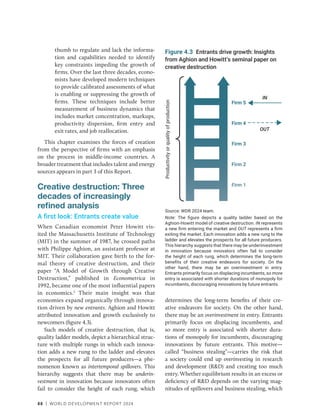
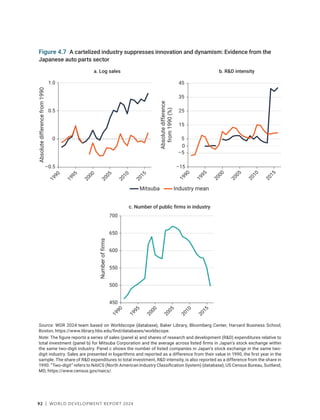
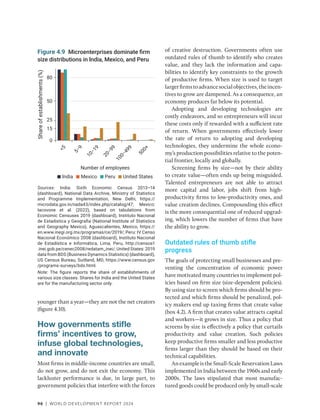
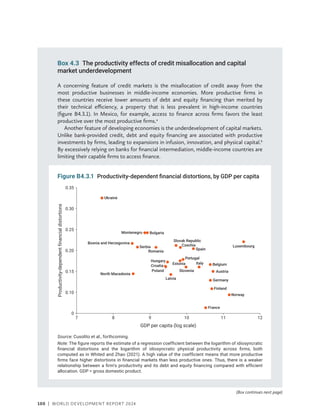
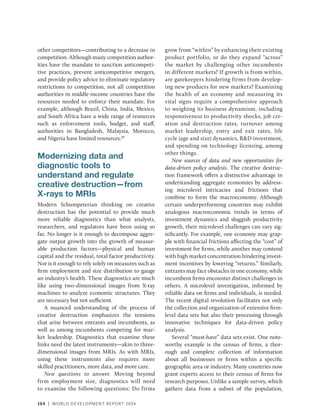
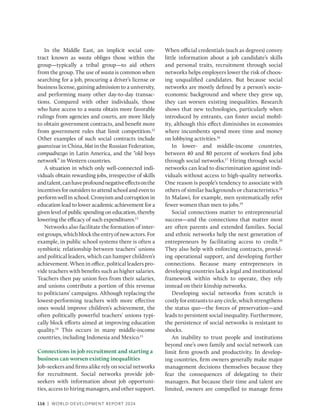
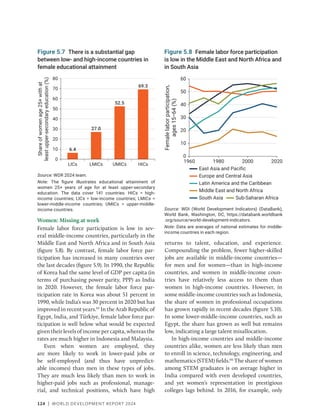
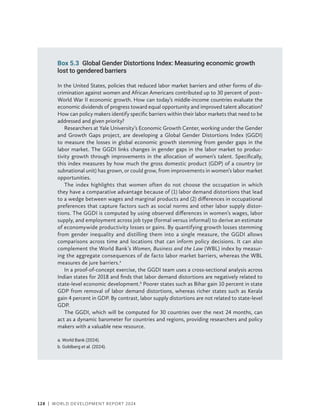
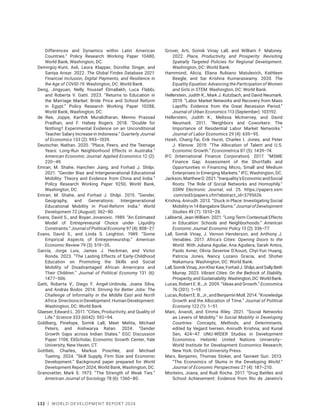
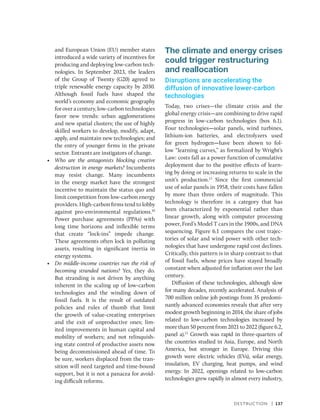
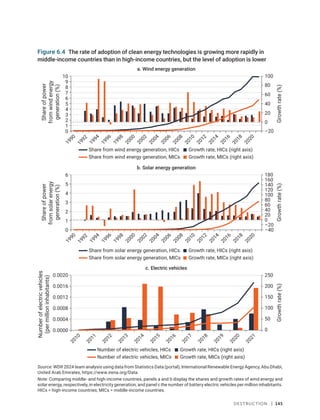
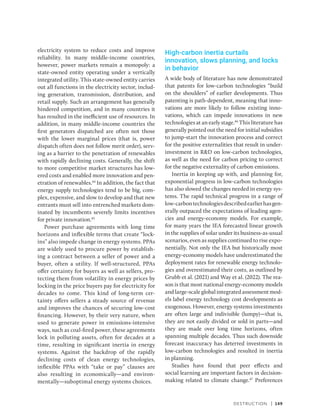
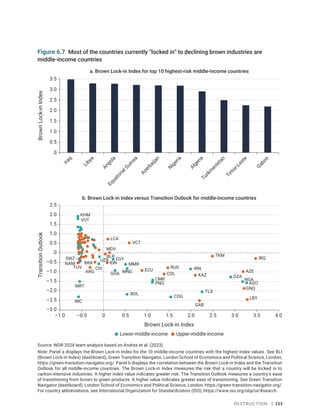
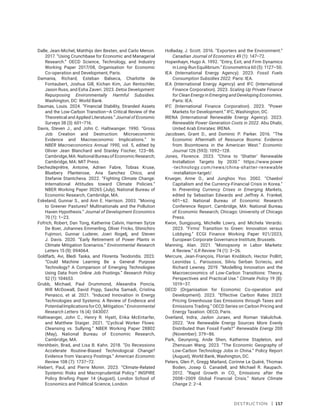
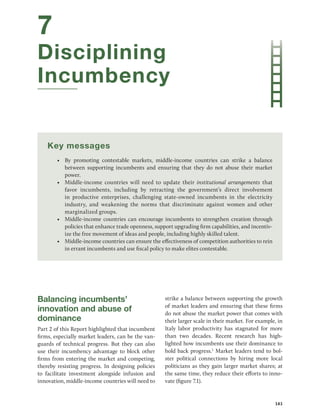
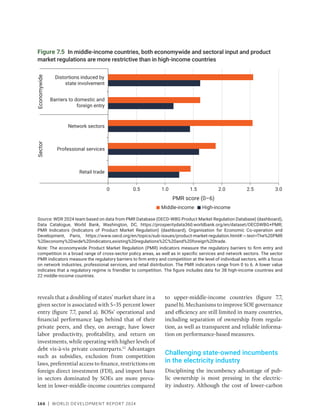
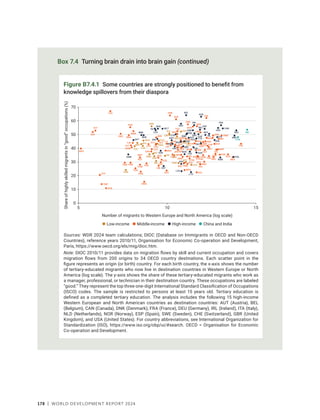
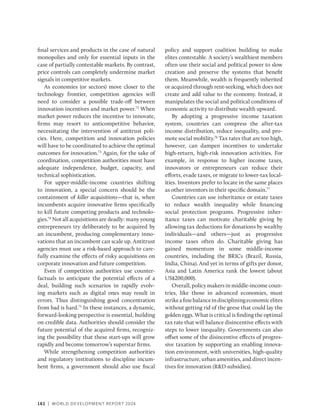
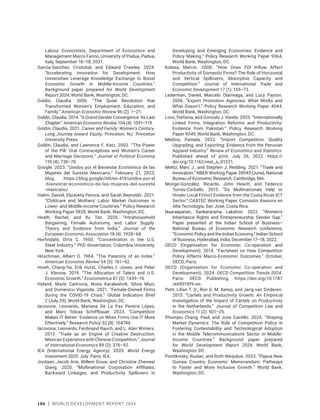
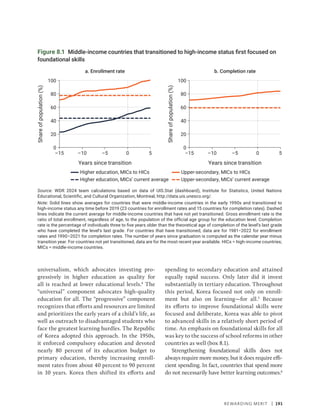
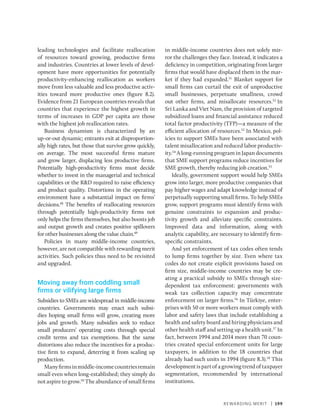
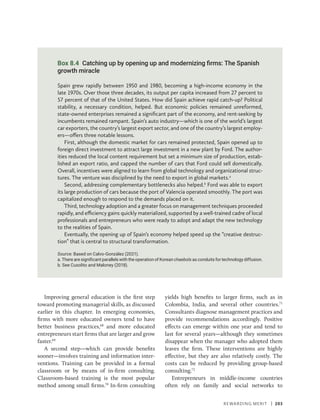
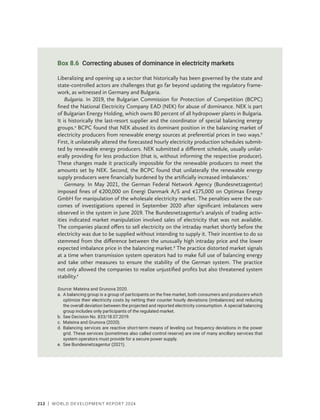
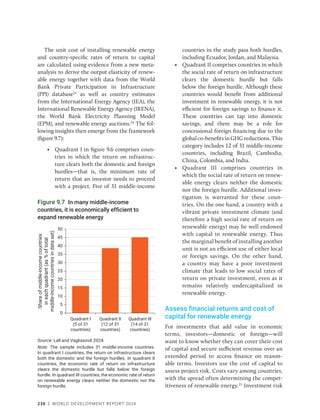
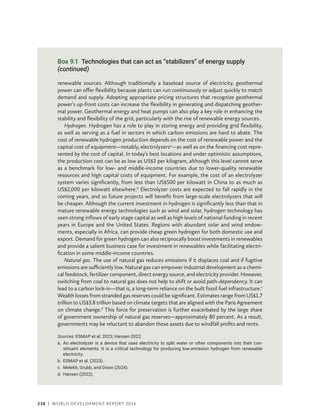
Box 2.3 The magic of investment accelerations (continued)
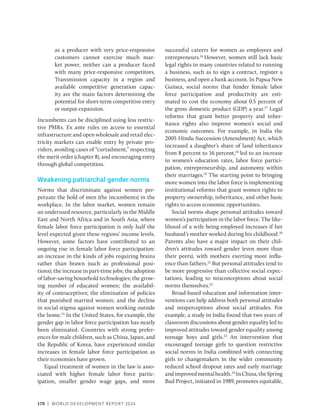
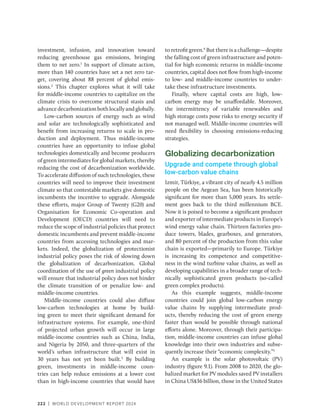
And they should not bet the farm—or even a
field—on leapfrogging. Infusion is imperative. A
review of the literature on middle-income traps
highlights that countries often try to make pre-
mature leaps from investment to innovation.
According to Gill and Kharas (2015, 28–29),
[Some countries tried] to leapfrog
prematurely into “knowledge economies,”
with none of the institutional
infrastructure in place to accomplish this.
Poor quality universities, low levels of
human capital, limited venture capital,
regulatory
barriers and incomplete rule
of law present significant barriers to
becoming an innovation-driven economy.
Middle-income countries that invest
heavily and prematurely in trying to
become “knowledge economies” can find
low returns to such investments. The
combination of wasted fiscal spending
and a faulty growth diagnostic can lead
to substandard performance—another
example of the middle-income trap.
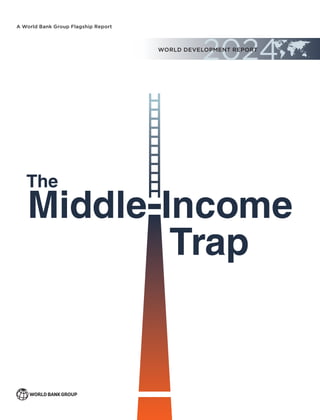
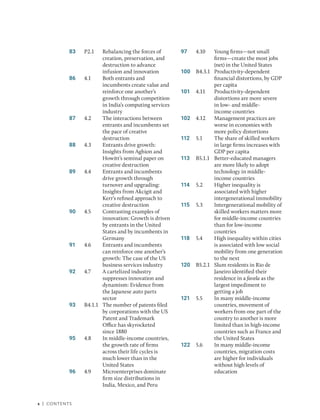
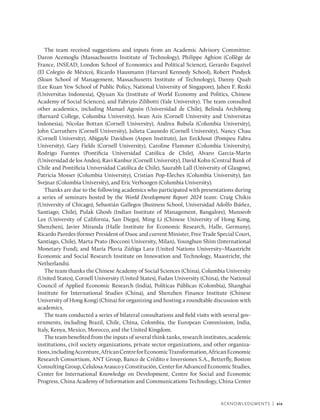
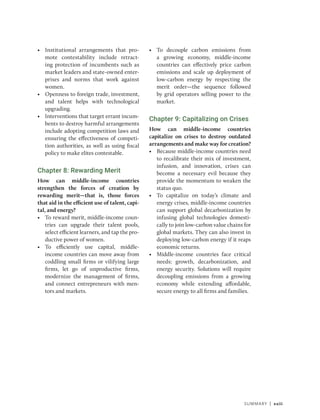
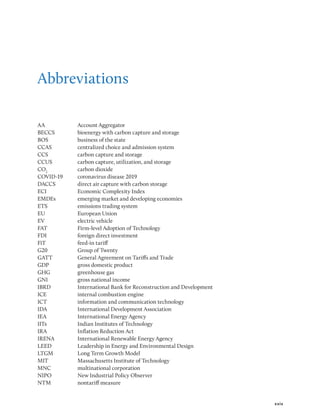
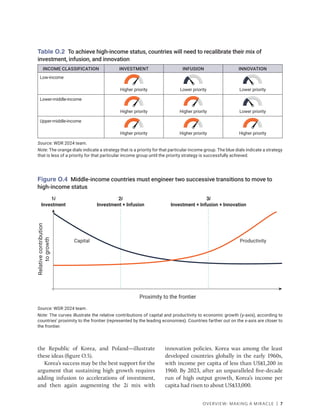
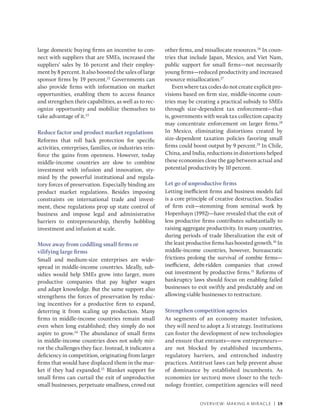
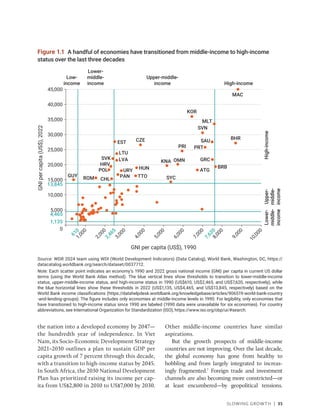
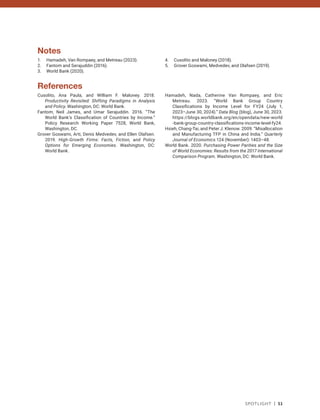
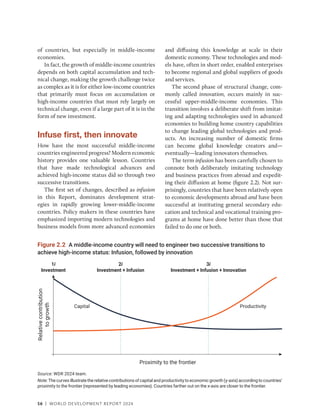
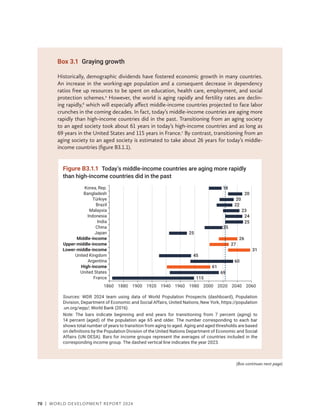
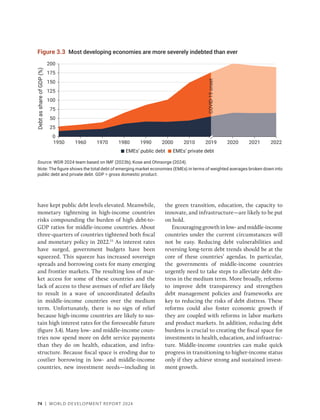
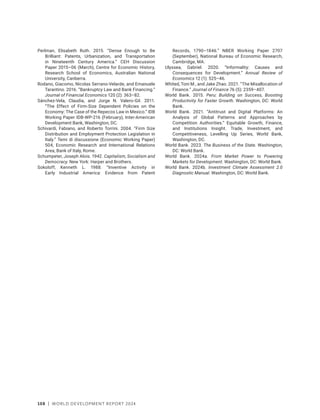
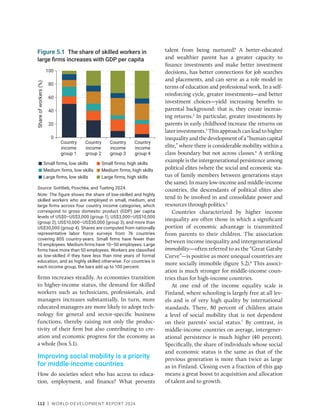
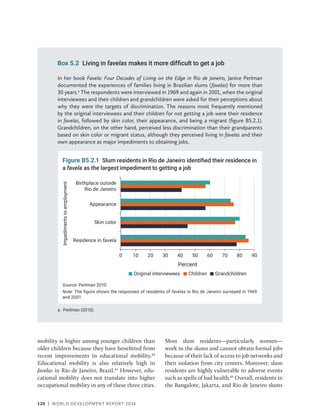
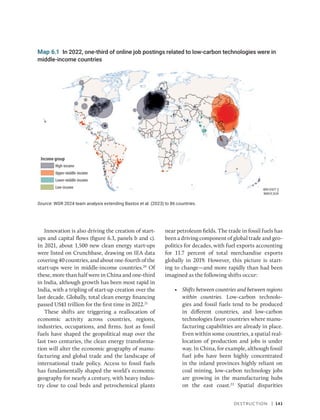
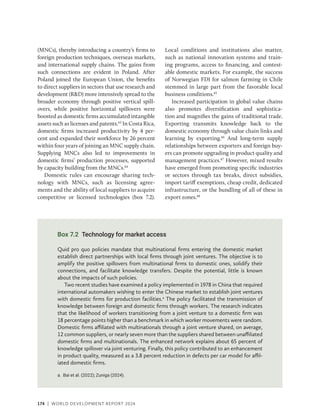
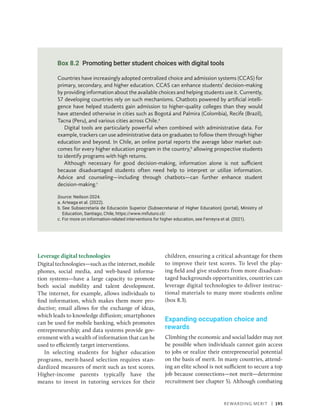
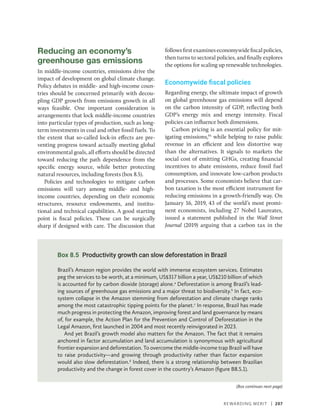
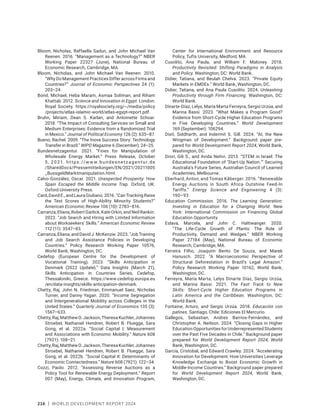
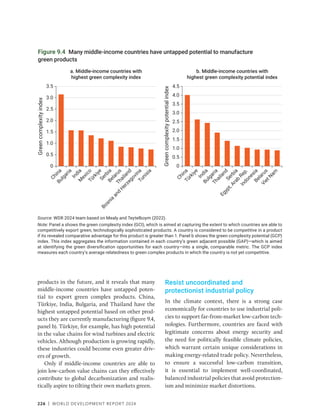
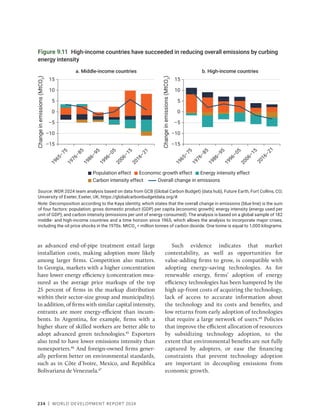
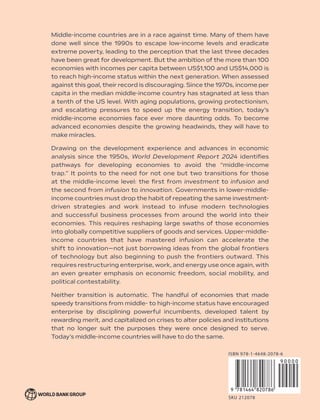
Figure B2.3.1 Investment growth accelerations: Colombia, Republic of
Korea, and Türkiye
Sources: Dieppe 2021; Feenstra, Inklaar, and Timmer 2015; World Bank 2024; Database Profiles
(dashboard), Our Data, Haver Analytics, New York, https://www.haver.com/our-data; WDI (World
Development Indicators) (Data Catalog), World Bank, Washington, DC, https://datacatalog
.worldbank.org/search/dataset/0037712.
Note: Investment refers to gross fixed capital formation. The sample period is 1980–2022.
Bars are simple averages of growth in investment and total factor productivity (TFP).
Acceleration years cover the full duration of the episodes. Nonacceleration years exclude
acceleration years that are not included in this box (see World Bank 2024, box 3.1).
–1
0
1
2
3
4
–4
0
4
8
12
16
Investment TFP
(right axis)
Investment TFP
(right axis)
Investment TFP
(right axis)
Colombia Korea, Rep. Türkiye
Acceleration years Nonacceleration years
Investment
growth
(%)
TFP
growth
(%)](https://image.slidesharecdn.com/worlddevelopmentreport2024-240805082550-605477af/85/World-Bank-World-Development-Report-2024-98-320.jpg)
![Structural Stasis | 67
Notes
1. Nassif, Feijó, and Araújo (2015).
2. Branstetter and Kwon (2018).
3. Gill and Kharas (2007).
4. Mokyr (2018).
5. Solow (1957). Technical change is an economic term
meaning a change in the amount of output produced
from the same amount of inputs.
6. Lucas (1988); Romer (1990).
7. Toniolo (1998).
8. Fernández-Villaverde and Ohanian (2018). In the 1950s,
for example, Italian firms benefited from sponsored
training trips for their managers, enabling them to
acquire modern management practices from firms in
the United States. Some firms also received loans to
procure modern machinery from the United States
(technology transfer). Specifically, firms that engaged
in both management and technology transfers wit-
nessed the most substantial long-term productivity
growth, highlighting the important role of infusion
(Giorcelli 2019).
9. Chuah, Loayza, and Nguyen (2018).
10. Acemoglu, Aghion, and Zilibotti (2006); Gerschenkron
(1962); König et al. (2022); Zilibotti (2017).
11. Mokyr (2023).
12. Choi and Shim (2023).
13. World Bank (1978).
14. Zilibotti (2017).
15. Mokyr (2023).
References
Acemoglu, Daron, Philippe Aghion, and Fabrizio Zilibotti.
2006. “Distance to Frontier, Selection, and Economic
Growth.” Journal of the European Economic Association
4 (1): 37–74.
Beasley, William G. 1972. The Meiji Restoration. Stanford,
CA: Stanford University Press.
Branstetter, Lee G., and Namho Kwon. 2018. “South Korea’s
Transition from Imitator to Innovator: The Role of
External Demand Shocks.” Journal of the Japanese and
International Economies 49 (September): 28–42.
Bukowski, Maciej, Iga Magda, Łukasz Marć, and Julian
Zawistowski. 2006. “Źródła i perspektyw wzrostu pro-
duktywności pracy w Polsce” [Sources and prospects
of productivity growth in Poland]. December, Instytut
Badań Strukturalnych, Warsaw.
Choi, Jaedo, and Younghun Shim. 2023. “Technology
Adoption and Late Industrialization.” STEG
Working Paper WP033 rev. (September), Structural
Transformation and Economic Growth, Centre for
Economic Policy Research, London.
Choi, Jaedo, and Younghun Shim. 2024. “From Adoption
to Innovation: State-Dependent Technology Policy in
Developing Countries.” STEG Working Paper WP091
(March), Structural Transformation and Economic
Growth, Centre for Economic Policy Research,
London.
Chuah, Lay Lian, Norman V. Loayza, and Ha Nguyen.
2018. “Resource Misallocation and Productivity Gaps
in Malaysia.” Policy Research Working Paper 8368,
World Bank, Washington, DC.
Dieppe, Alistair, ed. 2021. Global Productivity: Trends,
Drivers, and Policies. Washington, DC: World Bank.
Feenstra, Robert C., Robert Inklaar, and Marcel Peter
Timmer. 2015. “The Next Generation of the Penn
World Table.” American Economic Review 105 (10):
3150–82.
Fernández-Villaverde,Jesús,andLeeEdwardOhanian.2018.
“The Lack of European Productivity Growth: Causes
and Lessons for the U.S.” PIER Working Paper 18-024,
Penn Institute for Economic Research, Department of
Economics, University of Pennsylvania, Philadelphia.
Genther, Phyllis A. 2020. A History of Japan’s Government-
Business Relationship: The Passenger Car Industry.
Michigan Papers in Japanese Studies Series. Ann
Arbor: University of Michigan Press.
Gerschenkron, Alexander. 1962. Economic Backwardness in
Historical Perspective. Cambridge, MA: Belknap Press.
Gill, Indermit Singh, and Homi Kharas. 2007. An East
Asian Renaissance: Ideas for Economic Growth. With
Deepak Bhattasali, Milan Brahmbhatt, Gaurav Datt,
Mona Haddad, Edward Mountfield, Radu Tatucu,
and Ekaterina Vostroknutova. Washington, DC:
World Bank.
Gill, Indermit Singh, and Homi Kharas. 2015. “The Middle-
Income Trap Turns Ten.” Policy Research Working
Paper 7403, World Bank, Washington, DC.
Giorcelli, Michela. 2019. “The Long-Term Effects of
Management and Technology Transfers.” American
Economic Review 109 (1): 121–52.
Gradzewicz, Michał, Jakub Growiec, Marcin Kolasa,
Łukasz Postek, and Paweł Strzelecki. 2018. “Poland’s
Uninterrupted Growth Performance: New Growth
Accounting Evidence.” Post-Communist Economies
30 (2): 238–72.
Kolasa, Marcin. 2008. “How Does FDI Inflow Affect
Productivity of Domestic Firms? The Role of Horizontal
and Vertical Spillovers, Absorptive Capacity and
Competition.” Journal of International Trade and
Economic Development 17 (1): 155–73.
König, Michael, Kjetil Storesletten, Zheng Song, and
Fabrizio Zilibotti. 2022. “From Imitation to Innovation:
Where Is All That Chinese RD Going?” Econometrica
90 (4): 1615–54.
Lange, Glenn-Marie, QuentinT. Wodon, andKevinCarey, eds.
2018. The Changing Wealth of Nations 2018: Building a
Sustainable Future. Washington, DC: World Bank.
Lucas, Robert E., Jr. 1988. “On the Mechanics of Economic
Development.” Journal of Monetary Economics 22 (1):
3–42.
Mason, Mark. 1992. American Multinationals and Japan:
The Political Economy of Japanese Capital Controls,
1899–1980. Harvard East Asian Monographs Series,](https://image.slidesharecdn.com/worlddevelopmentreport2024-240805082550-605477af/85/World-Bank-World-Development-Report-2024-99-320.jpg)


![164 | WORLD DEVELOPMENT REPORT 2024
standards provide.5
For example, the standard
connector (SC), a fiber-optic connector devel-
oped by Tyco Electronics (now known as TE
Connectivity Ltd) used in data networking and
telecommunications, has become the dominant
international standard. How? By joining national
standardization organizations in many countries,
the company influenced the standard-making
process, with the result that European and inter-
national standards refer to the SC connector.
Tyco thus gained a significant global market
share, earning an additional US$50–$100 million
in profits between 1995 and 2004.6
India’s License Raj—a system of central con-
trols introduced in 1951 regulating entry and pro-
duction activity in the registered manufacturing
sector—is another example. The system favored
incumbents and stifled Indian entrepreneurs
for more than four decades. Its dismantlement
during the 1980s and 1990s amplified entry and
business dynamism, and the effects were most
prominent in states with labor market institu-
tions that favored employers.7
Often, dominant incumbents in local markets
lobby local authorities to erect ad hoc entry bar-
riers. In Italy, such local entry regulations in the
retail market increased price margins by 8 per-
cent and reduced the productivity of incumbent
firms by 3 percent in the early 2000s.8
In Peru,
when the national competition agency (Indecopi)
strengthened its powers to dismantle local and
sector-specific regulatory and administrative
entry barriers in 2013, productivity increased sig-
nificantly, including for firms operating in down-
stream sectors or in the same municipality.9
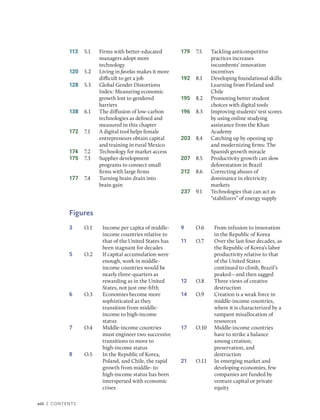
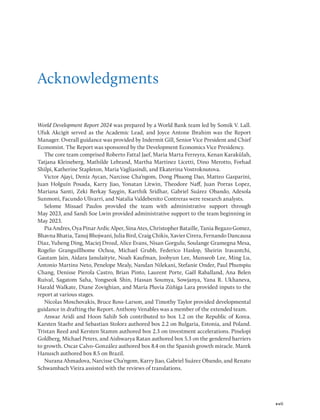
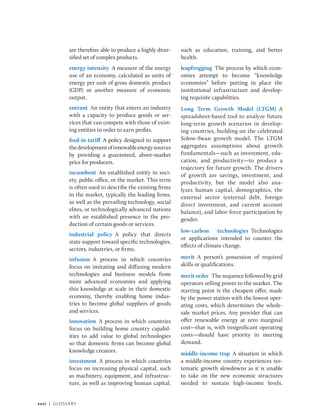
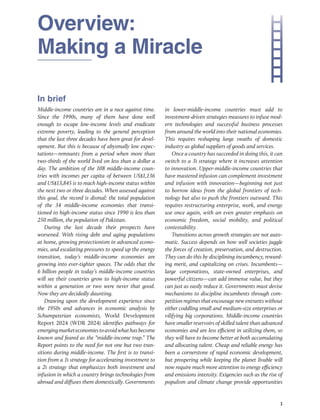
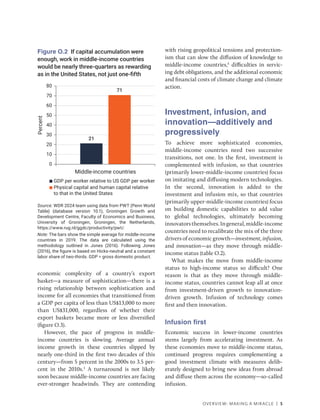
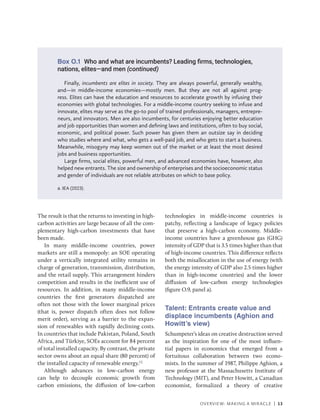
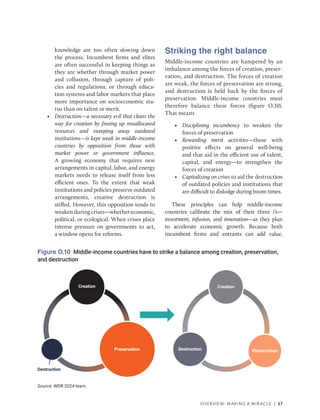
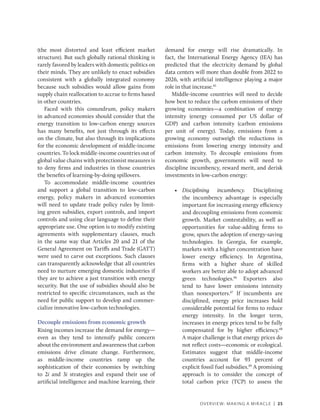
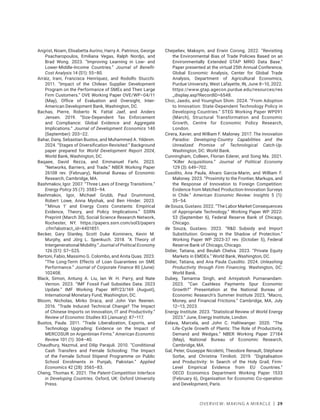
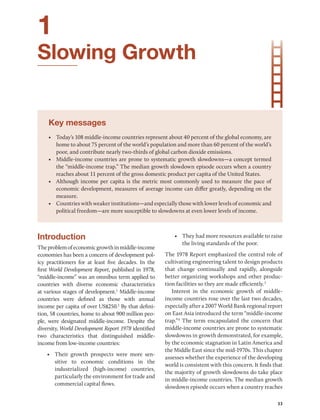
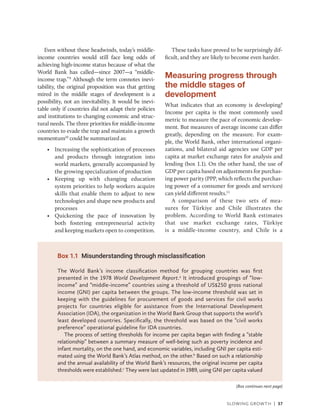
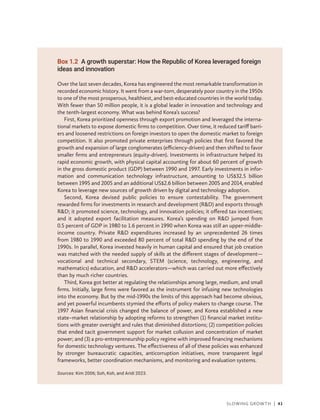
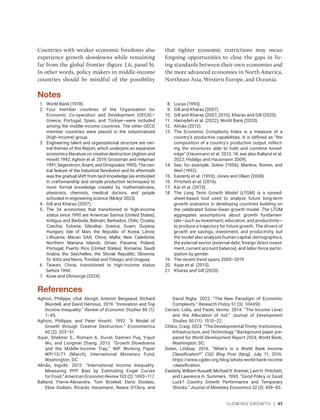
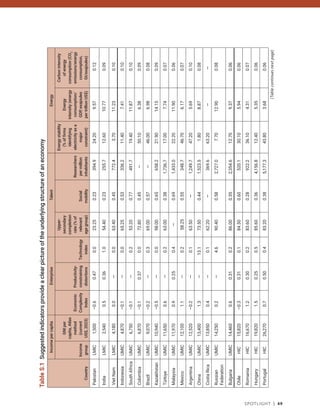
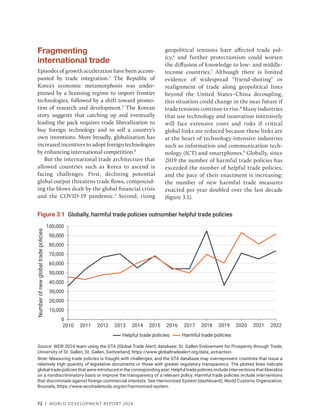
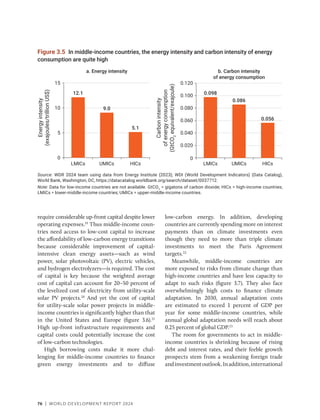
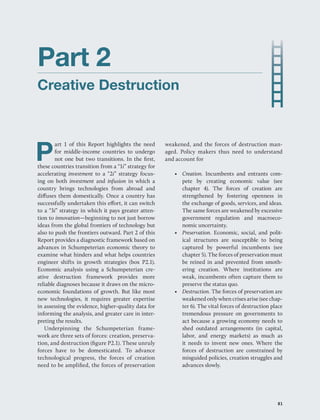
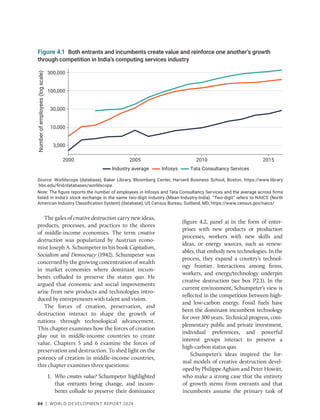
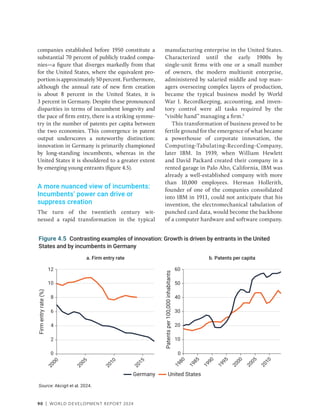
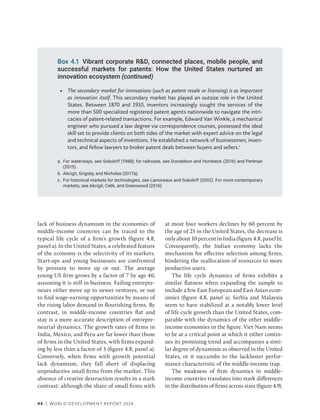
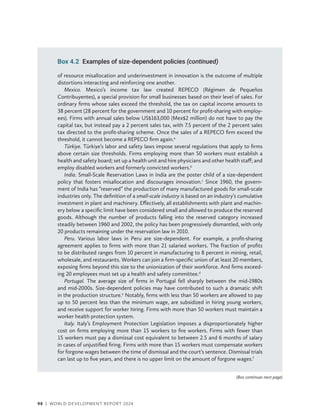
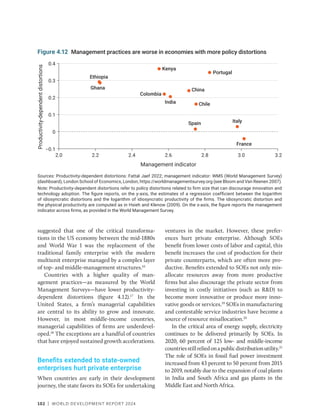
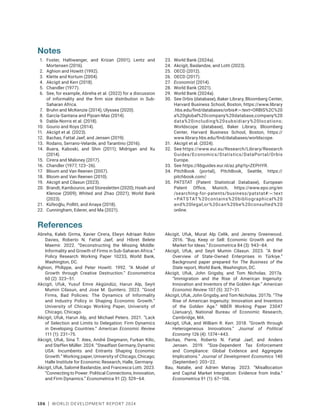
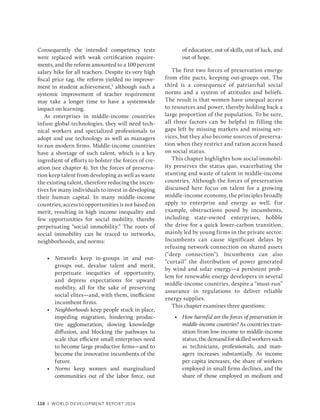
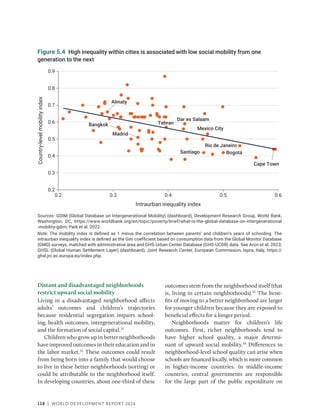
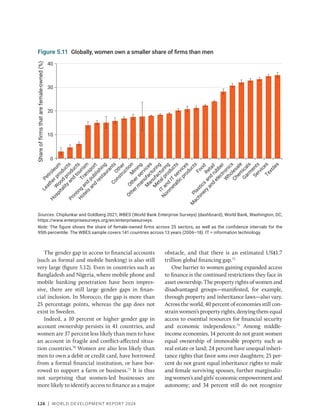
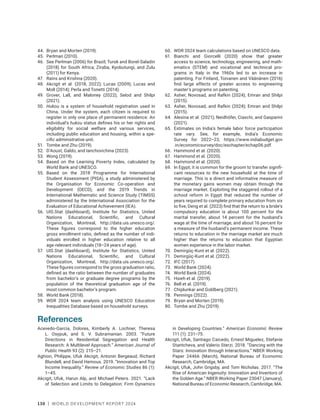
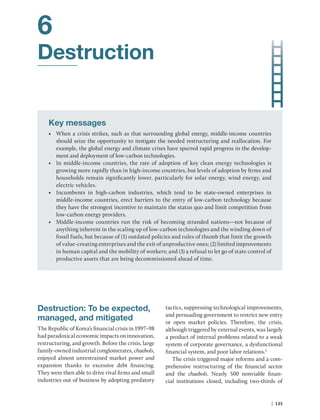
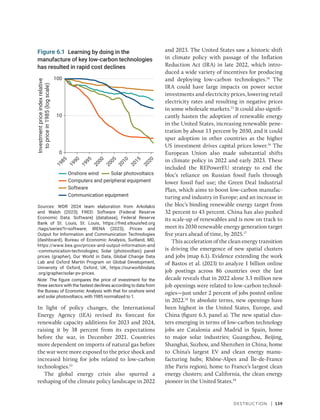
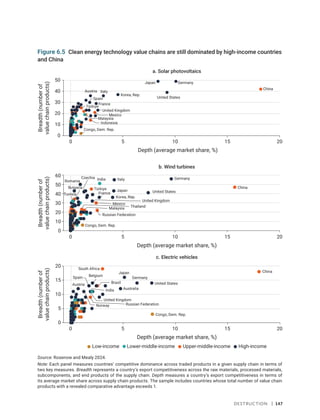
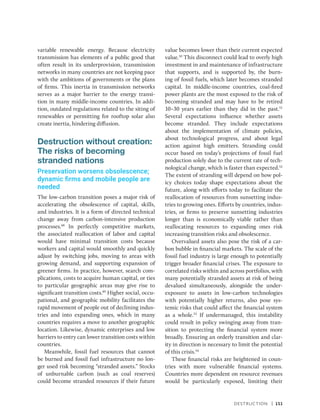
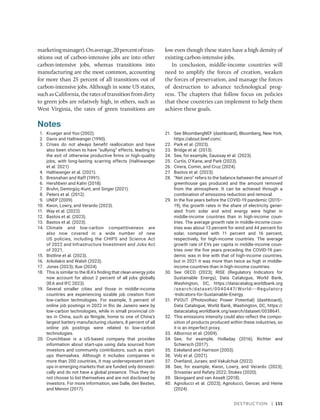
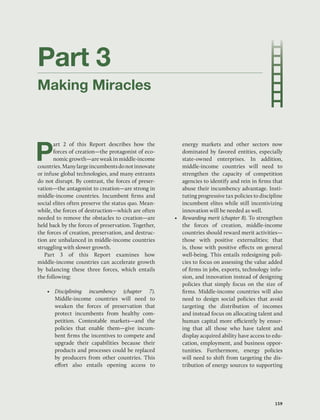
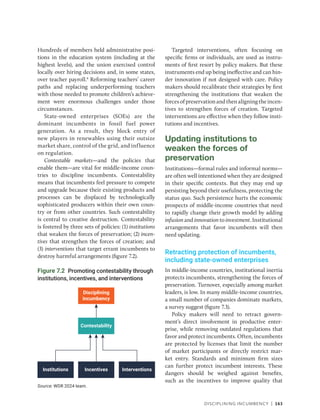
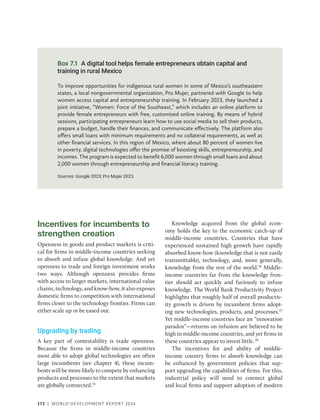
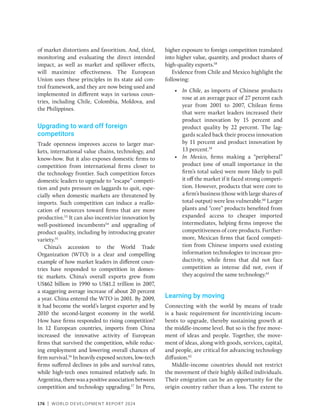
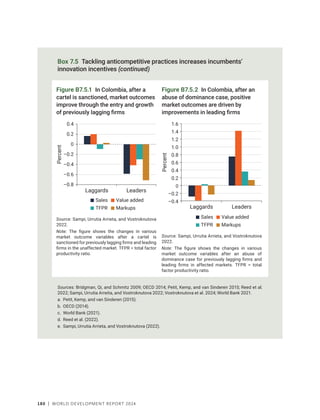
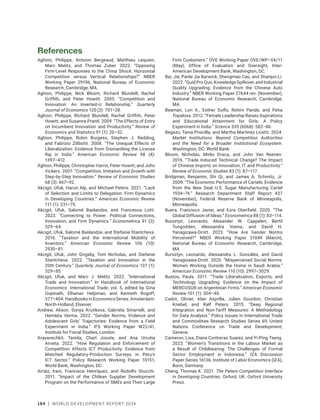
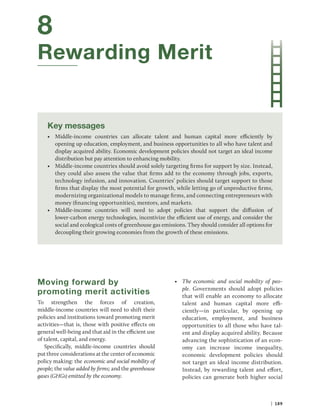
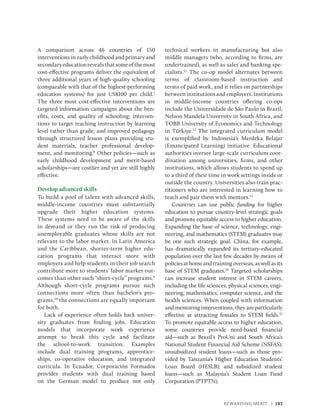
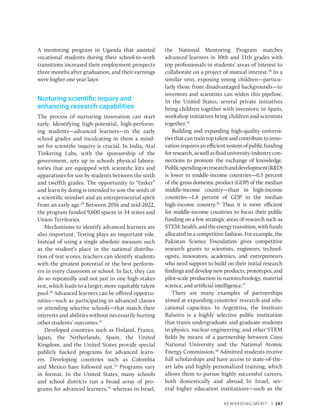
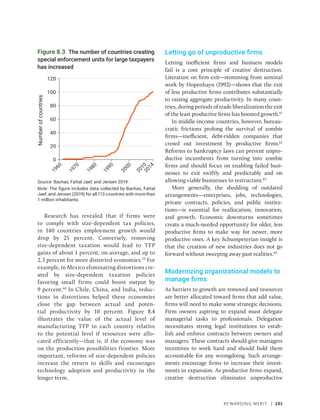
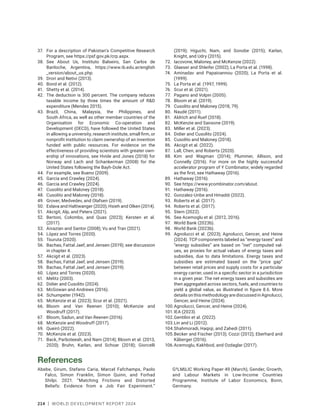
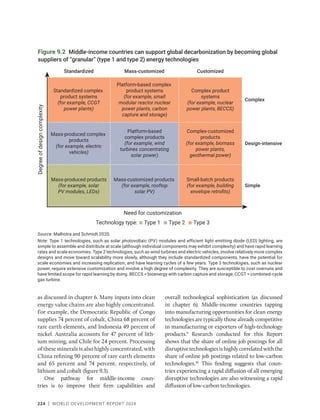
Product market regulations (PMRs), inten-
tionally or inadvertently, protect incumbents and
constrain competition (figure 7.4). These regula-
tions include regulatory barriers to firm entry and
competition in a broad range of key policy areas,
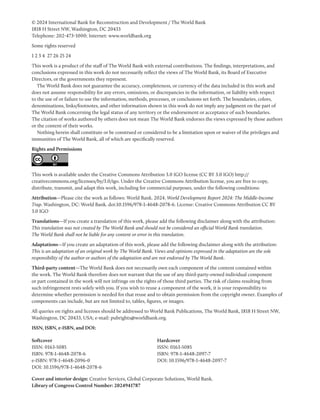
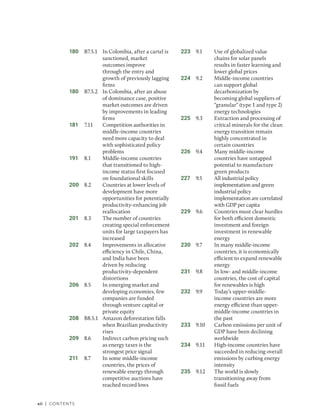
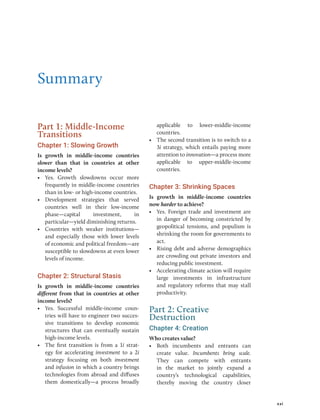
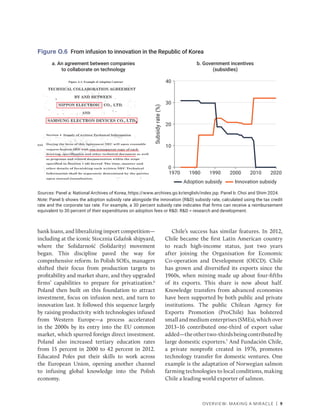
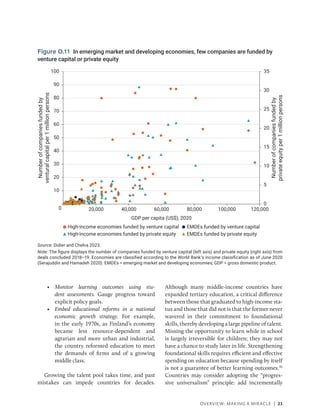
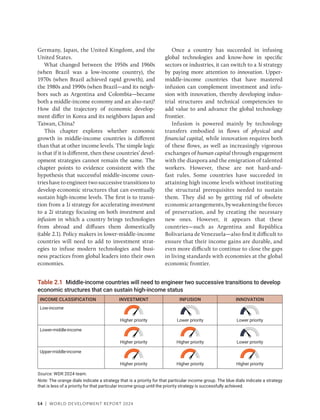
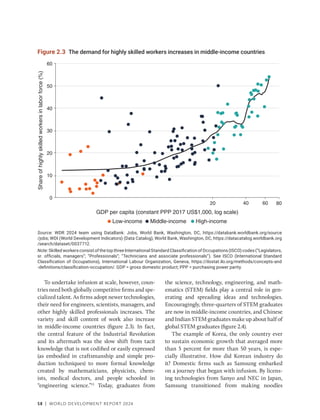
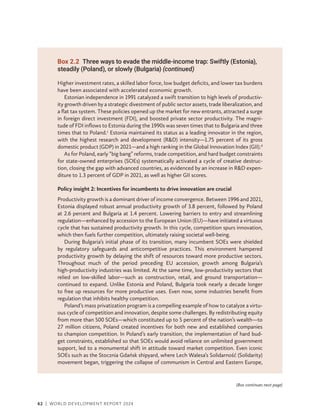
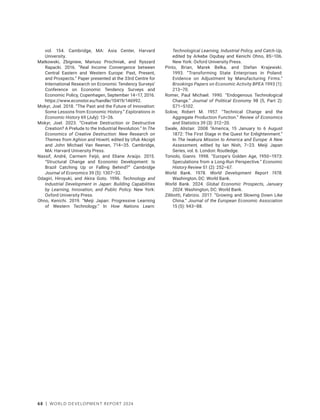
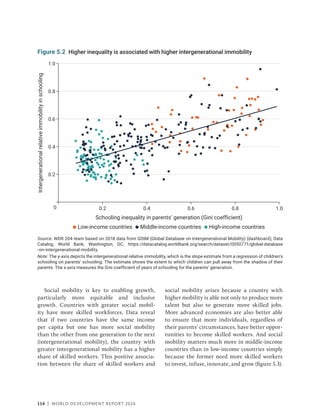
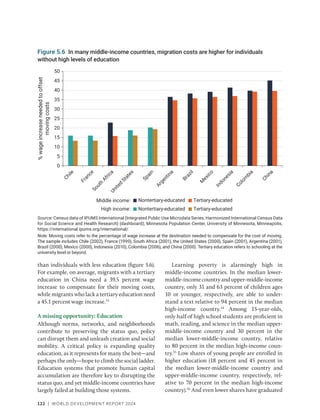
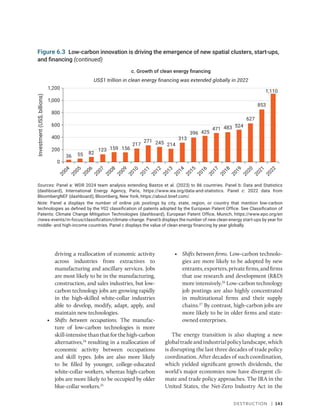
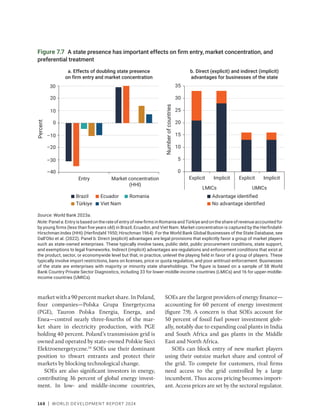
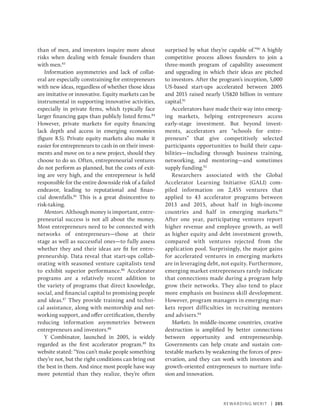
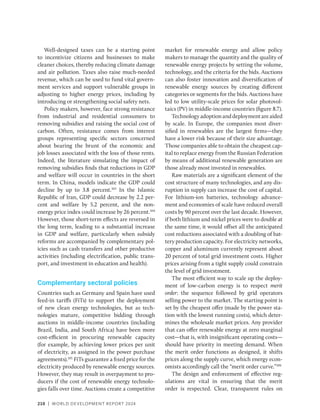
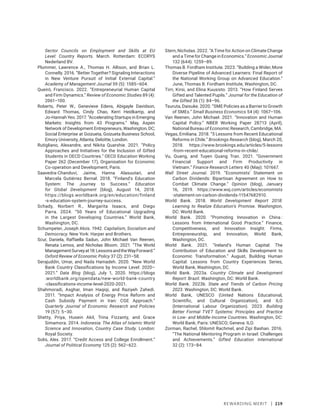
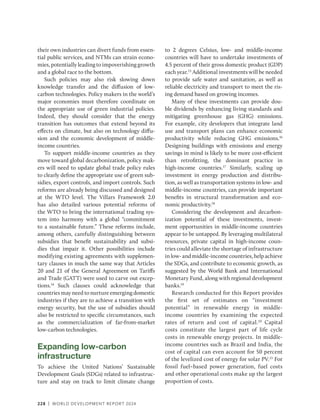
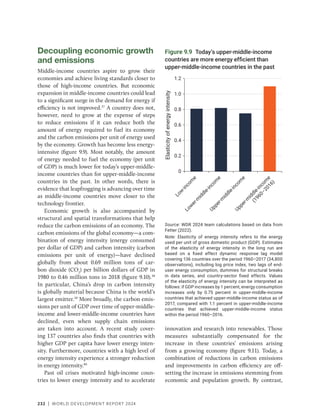
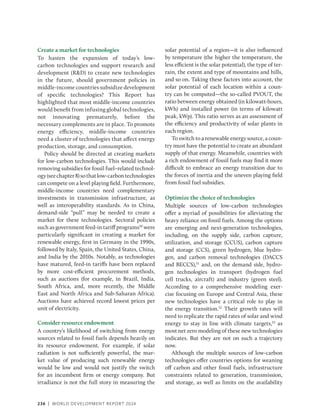
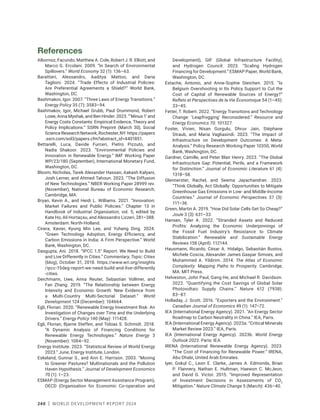
Figure 7.3 In many middle-income countries, markets are dominated by a few business
groups, as a survey suggests
Source: WDR 2024 team based on Schwab (2019).
Note: The survey question: “In your country, how do you characterize corporate activity?” [1 = dominated by a few business
groups; 7 = spread among many firms]. OECD = Organisation for Economic Co-operation and Development.
0
1
2
3
4
5
6
7
J
a
p
a
n
T
o
p
5
a
v
e
r
a
g
e
U
n
i
t
e
d
S
t
a
t
e
s
G
e
r
m
a
n
y
M
a
l
a
y
s
i
a
U
n
i
t
e
d
K
i
n
g
d
o
m
P
o
l
a
n
d
I
n
d
i
a
C
h
i
n
a
O
E
C
D
a
v
e
r
a
g
e
C
z
e
c
h
i
a
S
l
o
v
e
n
i
a
P
o
r
t
u
g
a
l
I
n
d
o
n
e
s
i
a
C
o
s
t
a
R
i
c
a
S
o
u
t
h
A
f
r
i
c
a
B
r
a
z
i
l
R
u
s
s
i
a
n
F
e
d
e
r
a
t
i
o
n
B
u
l
g
a
r
i
a
V
i
e
t
N
a
m
S
l
o
v
a
k
R
e
p
u
b
l
i
c
K
a
z
a
k
h
s
t
a
n
T
ü
r
k
i
y
e
C
h
i
l
e
C
o
l
o
m
b
i
a
M
e
x
i
c
o
K
o
r
e
a
,
R
e
p
.
R
o
m
a
n
i
a
A
r
g
e
n
t
i
n
a
Extent
of
market
dominance
(0–7)
(survey
responses)
High-income
Middle-income](https://image.slidesharecdn.com/worlddevelopmentreport2024-240805082550-605477af/85/World-Bank-World-Development-Report-2024-196-320.jpg)

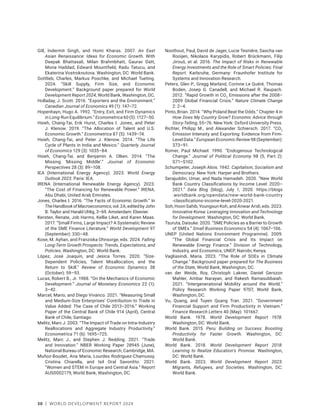
![208 | WORLD DEVELOPMENT REPORT 2024
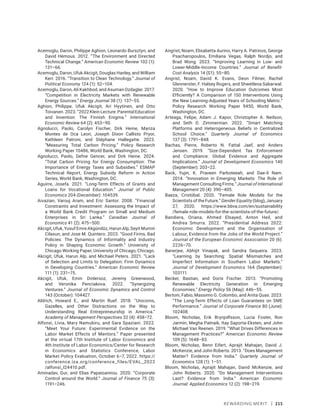
a. Hanusch (2023).
b. World Bank (2023a).
c. Lenton et al. (2023).
d. Ferreira Filho, De Souza, and Hanusch (2022); Hanusch (2023).
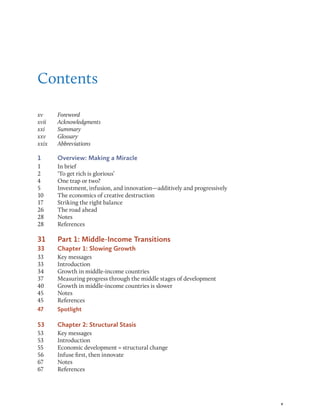
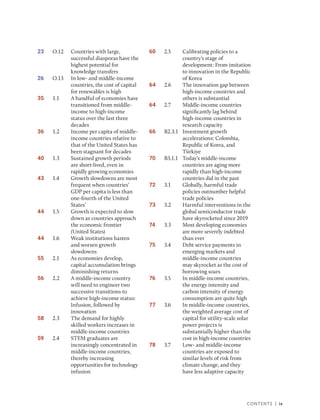
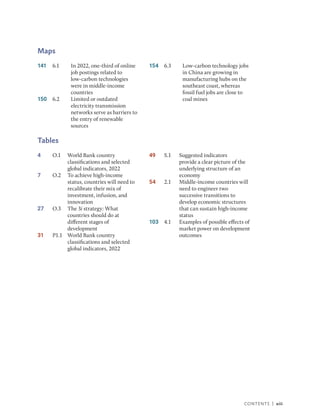
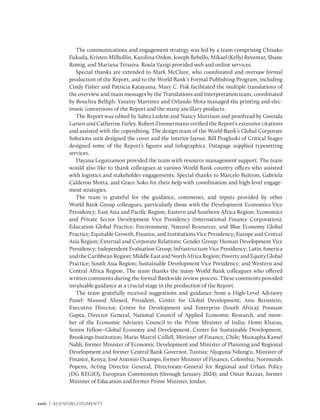
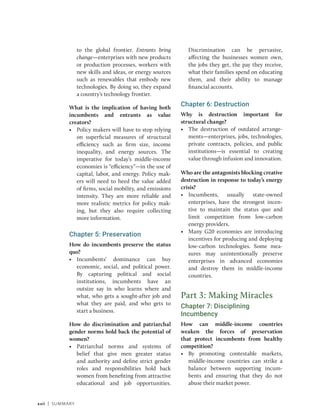
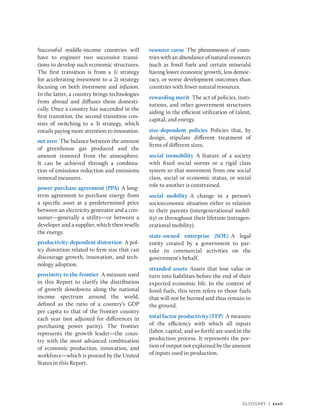
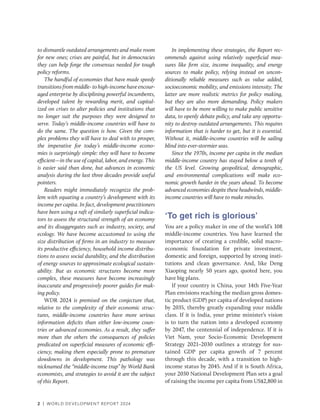
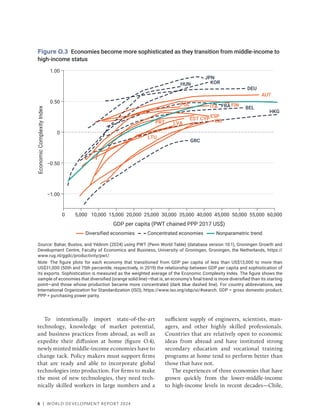
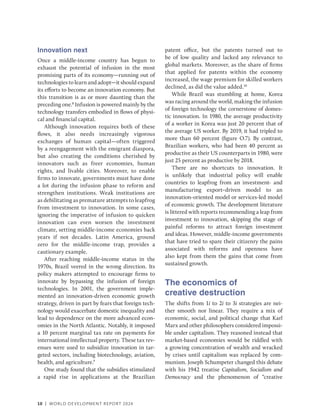
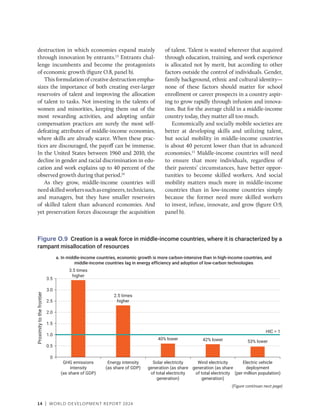
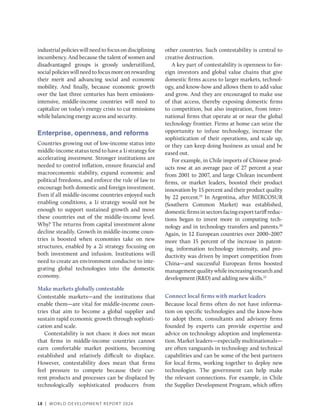
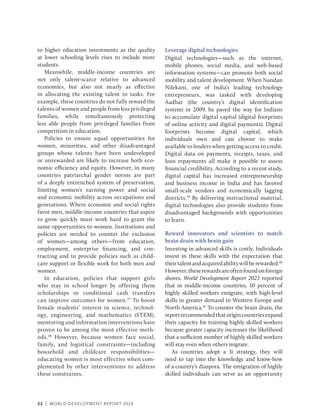
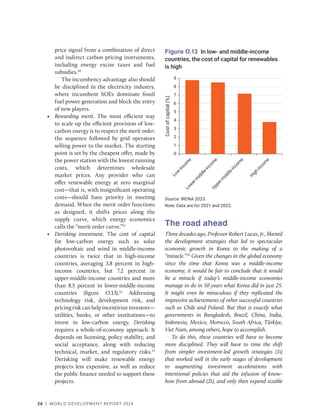
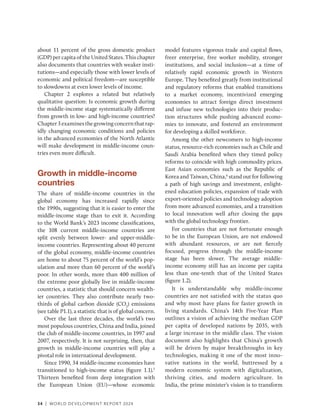
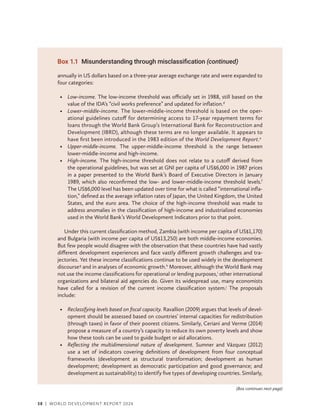
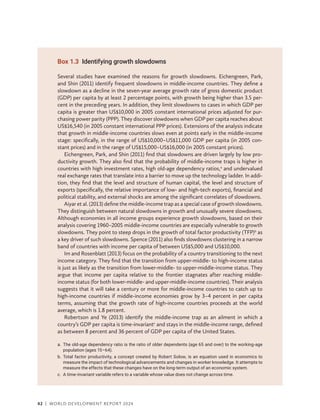
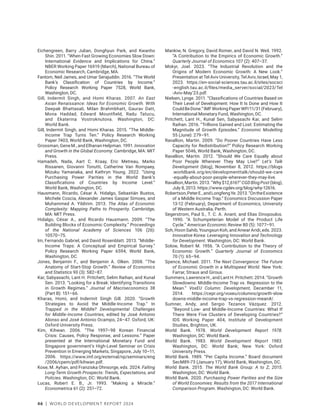
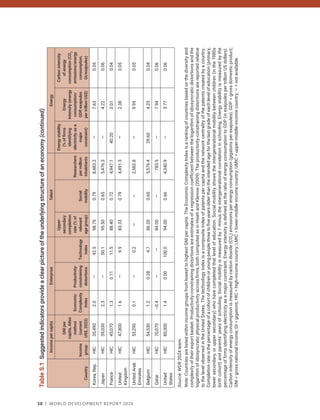
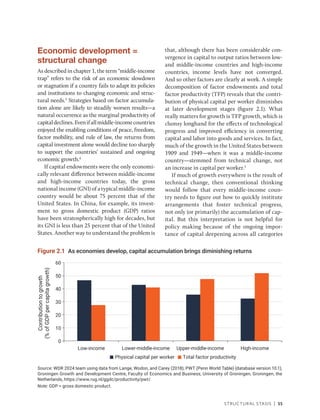
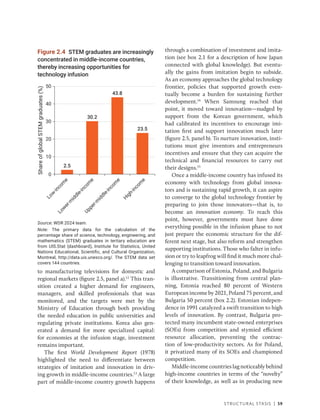
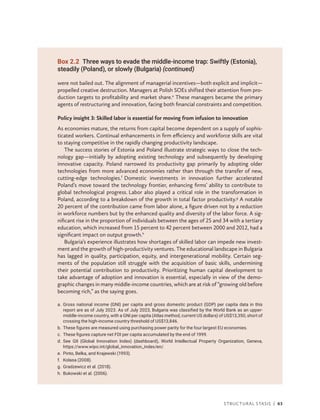
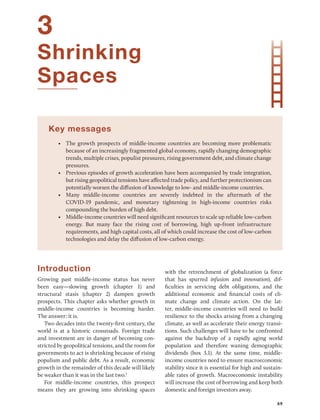
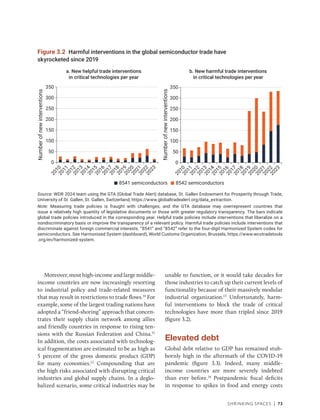
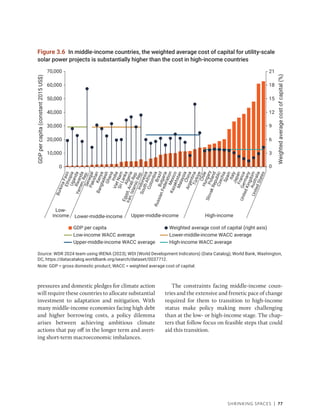
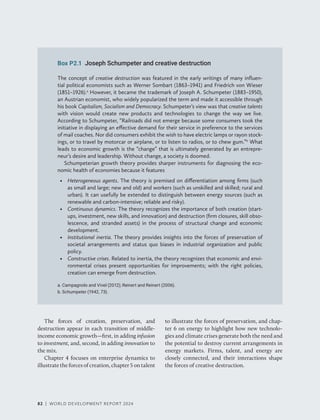
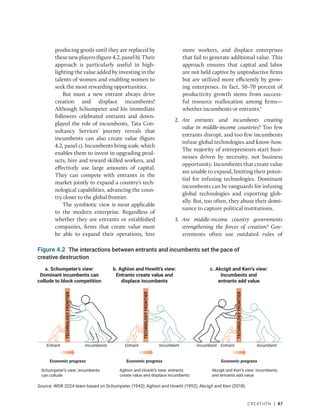
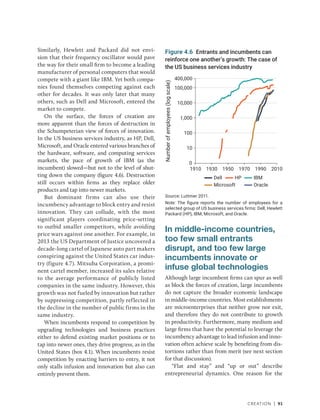
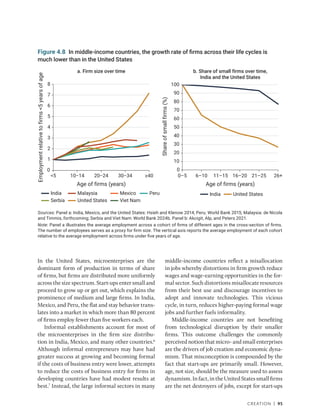
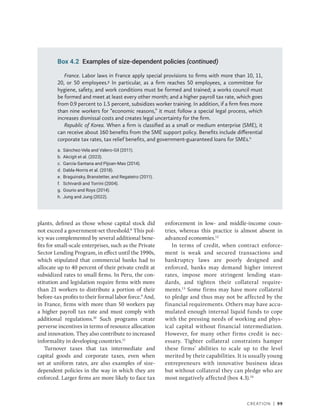
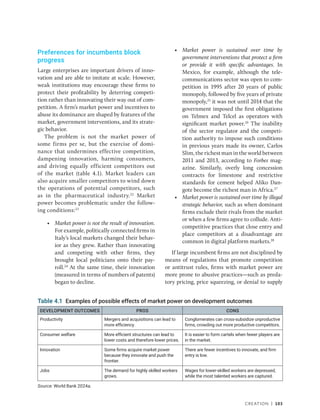
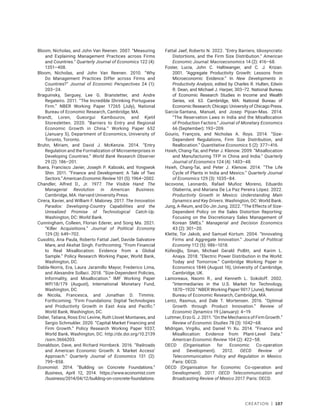
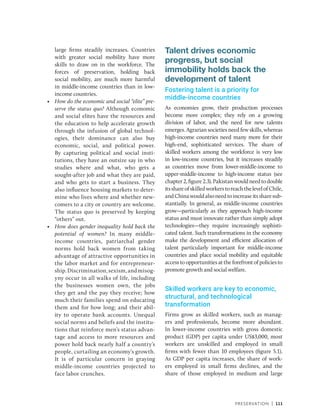
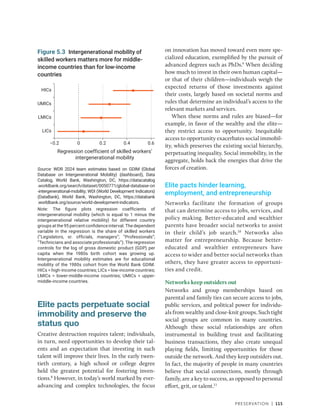
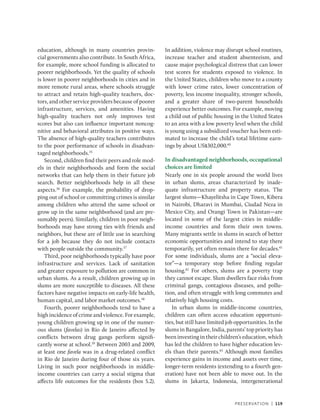
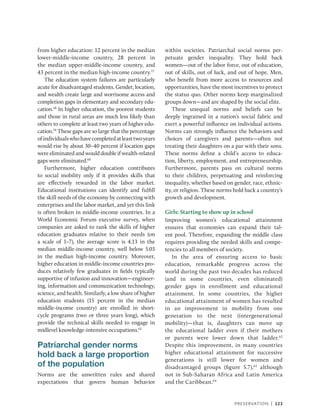
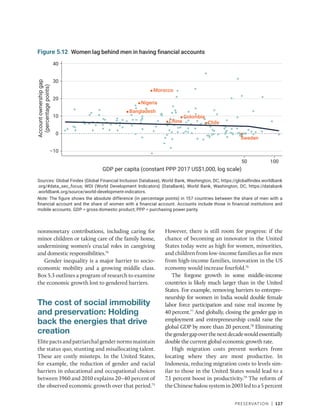
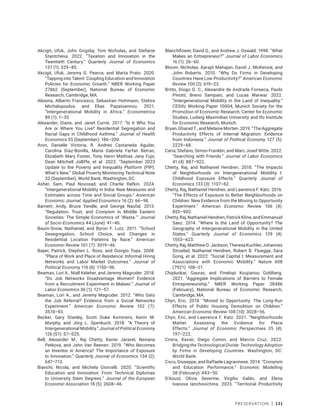
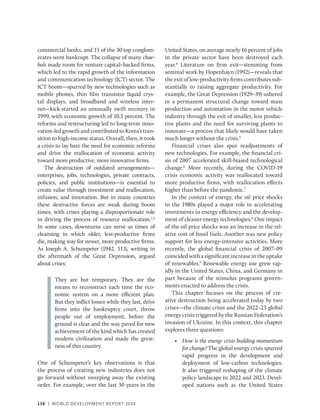
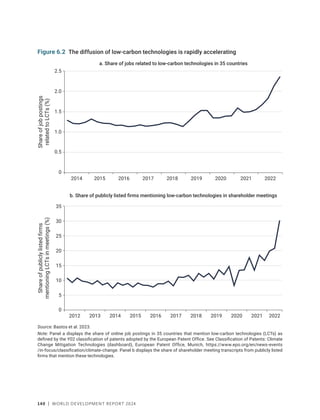
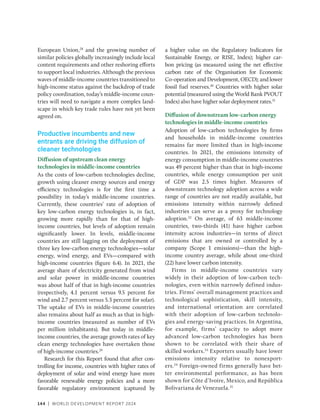
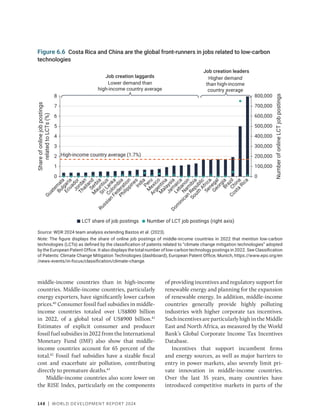
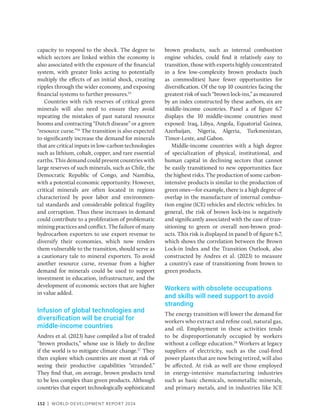
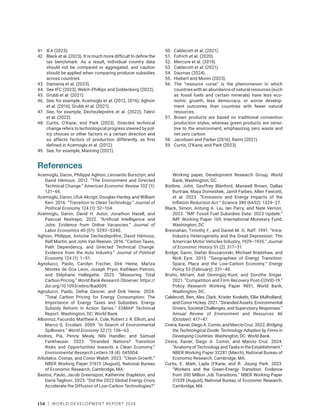
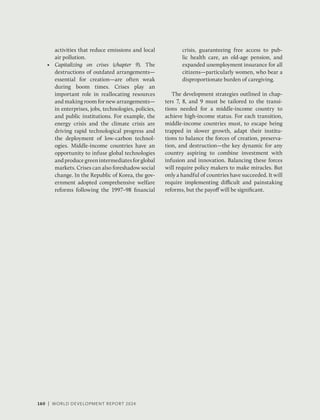
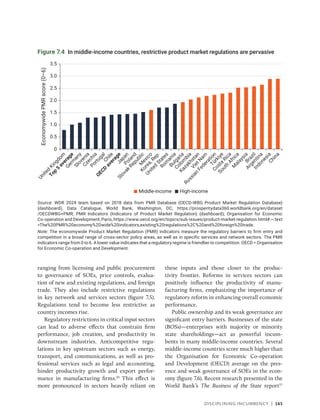
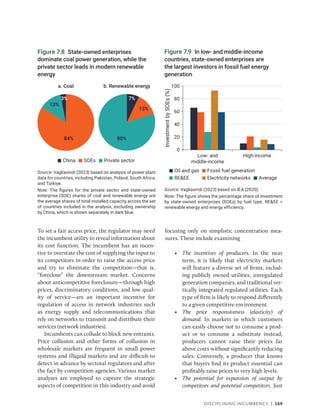
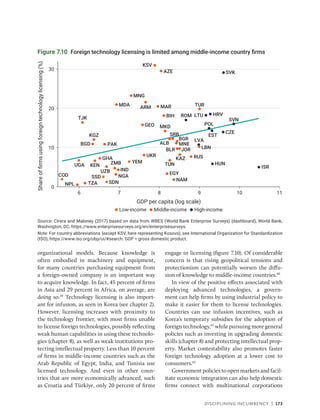
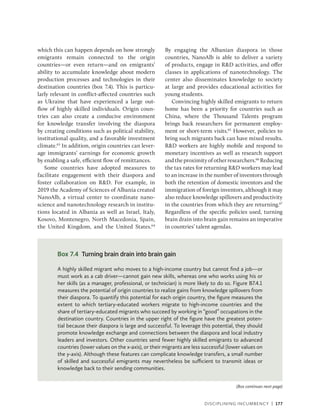
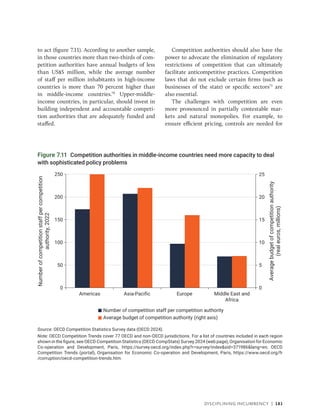
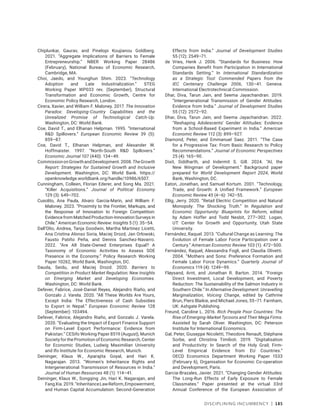
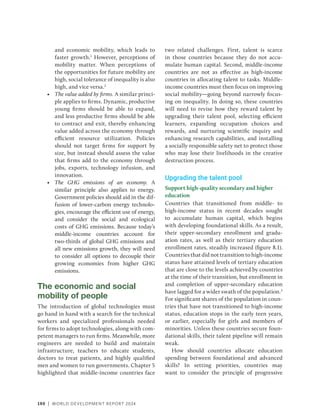
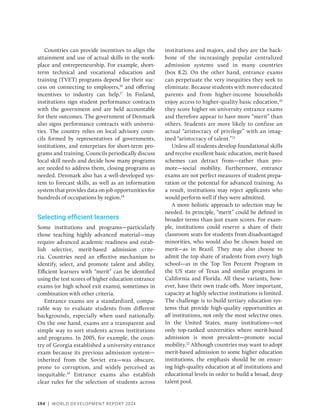
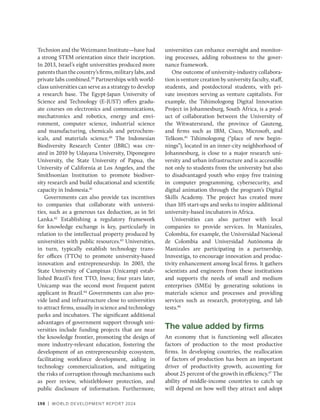
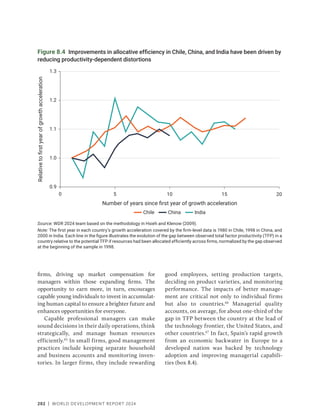
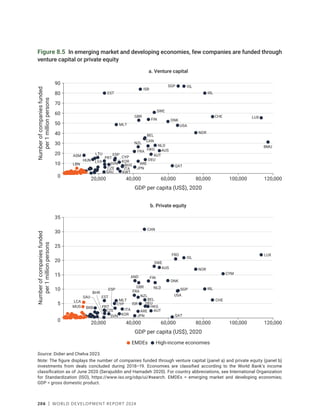
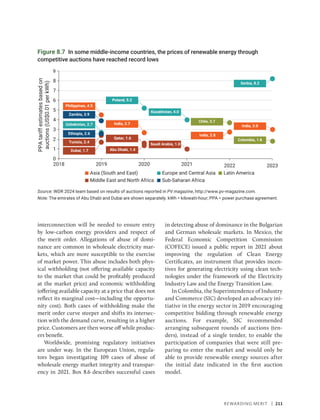
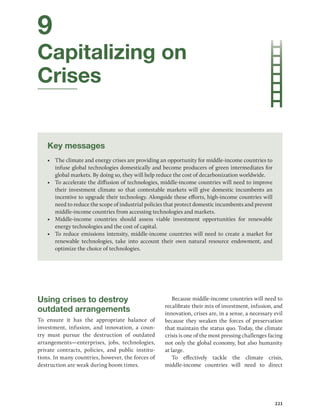
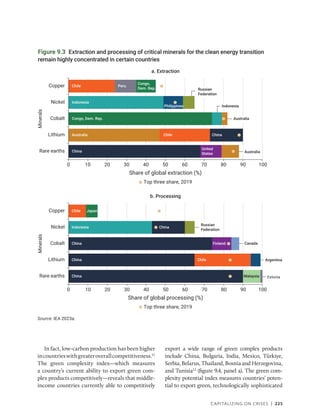
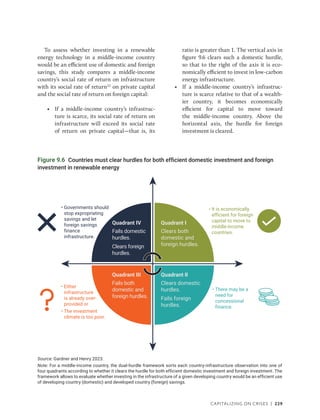
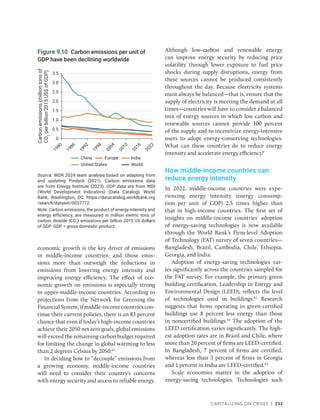
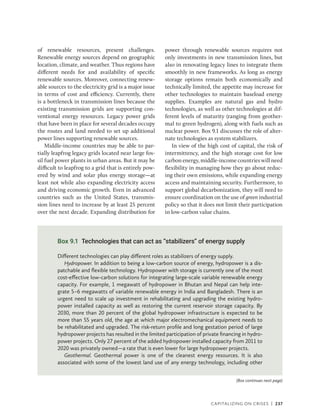
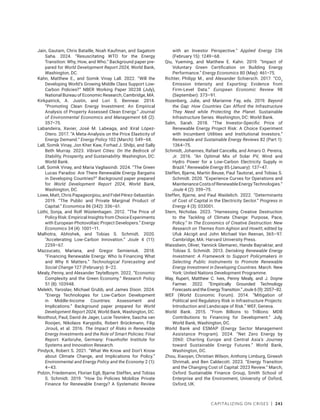
Box 8.5 Productivity growth can slow deforestation in Brazil (continued)
Source: WDR 2024 team extending Ferreira Filho, De Souza, and Hanusch (2022).
Note: Legal Amazon is the largest sociogeographic division in Brazil, containing all nine states in
the Amazon basin. km2
= square kilometer; TFP = total factor productivity.
Figure B8.5.1 Amazon deforestation falls when Brazilian productivity rises
–30
–25
–20
–15
–10
–5
0
80
85
90
95
100
105
110
115
120
125
130
1
9
9
6
1
9
9
7
1
9
9
8
1
9
9
9
2
0
0
0
2
0
0
1
2
0
0
2
2
0
0
3
2
0
0
4
2
0
0
5
2
0
0
6
2
0
0
7
2
0
0
8
2
0
0
9
2
0
1
0
2
0
1
1
2
0
1
2
2
0
1
3
2
0
1
4
2
0
1
5
2
0
1
6
2
0
1
7
2
0
1
8
2
0
1
9
2
0
2
0
2
0
2
1
2
0
2
2
Total factor productivity Net change in forest cover, Legal Amazon (right axis)
TFP
index
(1996
=
100)
Net
change
in
forest
cover
(thousands
of
km
2
)
United States “offers the most cost-effective
lever to reduce carbon emissions at the scale and
speed that [are] necessary.” Others have proposed
a strategic combination of temporary research
subsidies and carbon taxes that could steer tech-
nological advancements toward more environ-
mentally sustainable solutions.96
Direct carbon pricing instruments include car-
bon pricing signals sent through carbon taxes and
emissions trading systems (ETSs). According to
the World Bank’s State and Trends of Carbon Pricing
2023 report, these schemes currently cover a rela-
tively limited portion of global carbon emissions,
butthegreateraprogram’sscope,themoreeffective
it can be.97
The report points out that the number
of countries that have adopted direct carbon pric-
ing schemes through ETSs or carbon taxes is lim-
ited.98
Perhaps more important, so is the coverage
of such programs. With the introduction of the ETS
in China in 2021, the share of global carbon dioxide
(CO2
) emissions from fossil fuels covered by direct
carbon pricing schemes rose to about 31 percent
(amounting to about one-quarter of global GHG
emissions). Along with their coverage, average car-
bon prices have been rising over the last few years.
The carbon price in the European Union (EU)](https://image.slidesharecdn.com/worlddevelopmentreport2024-240805082550-605477af/85/World-Bank-World-Development-Report-2024-240-320.jpg)
![218 | WORLD DEVELOPMENT REPORT 2024
sistema educativo” [There’s a disconnect between what
enterprises need and what the education system pro-
vides]. País, November 29, 2022. https://www.lahora
.com.ec/pais/hay-una-desconexion-entre-lo-que-las
-empresas-necesitan-y-lo-que-se-esta-formando-en
-el-sistema-educativo/.
Lall, Saurabh A., Li-Wei Chen, and Peter W. Roberts. 2020.
“Are We Accelerating Equity Investment into Impact-
Oriented Ventures?” World Development 131 (July):
104952.
LaPorta,Rafael,FlorencioLópez‐de‐Silanes,AndreiShleifer,
and Robert W. Vishny. 1997. “Legal Determinants of
External Finance.” Journal of Finance 52 (3): 1131–50.
La Porta, Rafael, Florencio López‐de‐Silanes, Andrei
Shleifer, and Robert W. Vishny. 1998. “Law and Finance.”
Journal of Political Economy 106 (6): 1113–55.
La Porta, Rafael, Florencio López-de-Silanes, Andrei
Shleifer, and Robert W. Vishny. 1999. “Investor
Protection: Origins, Consequences, and Reform.” NBER
Working Paper 7428 (December), National Bureau of
Economic Research, Cambridge, MA.
Lee, Ju-Ho, Hyeok Jeong, and Song-Chang Hong. 2014. “Is
Korea Number One in Human Capital Accumulation?
Education Bubble Formation and Its Labor Market
Evidence.” KDI School Working Paper 14-03 (August),
KDI School of Public Policy and Management, Seoul,
Republic of Korea.
Lenton, Timothy M., David I. Armstrong McKay, Sina
Loriani, Jesse F. Abrams, Steven J. Lade, Jonathan
F. Donges, Manjana Milkoreit, et al. 2023. The Global
Tipping Points Report 2023. Exeter, UK: University of
Exeter.
Lin, Boqiang, and Aijun Li. 2012. “Impacts of Removing
Fossil Fuel Subsidies on China: How Large and How to
Mitigate?” Energy 44 (1): 741–49.
López, José Joaquín, and Jesica Torres. 2020.
“Size-Dependent Policies, Talent Misallocation, and
the Return to Skill.” Review of Economic Dynamics 38
(October): 59–93.
Mateina, Eleonora, and Anastasiya Grunova. 2020. “The
Bulgarian National Electricity Company Sanctioned for
Abuse of Dominance on the Market of Balancing Energy
of Renewables.” Kluwer Competition Law Blog (blog),
January 7, 2020. https://competitionlawblog.kluwer
competitionlaw.com/2020/01/07/.
McGowan,MügeAdalet,andDanAndrews.2016.“Insolvency
Regimes and Productivity Growth: A Framework for
Analysis.” OECD Economics Department Working Paper
1309, Organisation for Economic Co-operation and
Development, Paris.
McKenzie, David J., and Dario Sansone. 2019.
“Predicting Entrepreneurial Success Is Hard:
Evidence from a Business Plan Competition in Nigeria.”
Journal of Development Economics 141 (November):
102369.
McKenzie, David J., and Christopher M. Woodruff. 2017.
“Business Practices in Small Firms in Developing
Countries.” Management Science 63 (9): 2967–81.
McKenzie, David J., Christopher M. Woodruff, Kjetil Bjorvatn,
Miriam Bruhn, Jing Cai, Juanita Gonzalez Uribe, Simon
Quinn, Tetsushi Sonobe, and Martin Valdivia, eds. 2023.
“Training Entrepreneurs.” VoxDevLit 1 (3). https://
voxdev.org/sites/default/files/2023-11/Training
_Entrepreneurs_Issue_3.pdf.
Melitz, Marc J. 2003. “The Impact of Trade on Intra-Industry
Reallocations and Aggregate Industry Productivity.”
Econometrica 71 (6): 1695–725.
Mendes, Philip. 2015. “Integrating Intellectual Property
into Innovation Policy Formulation in Sri Lanka.”
January, World Intellectual Property Organization,
Geneva.
Miller, Amisha, Saurabh A. Lall, Markus P. Goldstein, and
Joao H. C. Montalvao. 2023. “Asking Better Questions:
The Effect of Changing Investment Organizations’
Evaluation Practices on Gender Disparities in
Funding Innovation.” Policy Research Working Paper
10625, World Bank, Washington, DC.
Muñoz-Boudet, Ana María, Lourdes Rodríguez-Chamussy,
Cristina Chiarella, and Isil Oral Savonitto. 2017. “Women
and STEM in Europe and Central Asia.” World Bank,
Washington, DC.
Murnane, Richard J., Marcus R. Waldman, John
B. Willett, Maria Soledad Bos, and Emiliana
Vegas. 2017. “The Consequences of Educational
Voucher Reform in Chile.” NBER Working Paper
23550 (June), National Bureau of Economic Research,
Cambridge, MA.
Naudé, Wim. 2011. “Entrepreneurship Is Not a Binding
Constraint on Growth and Development in the Poorest
Countries.” World Development 39 (1): 33–44.
Neilson, Christopher A. 2024. “The Rise of Coordinated
Choice and Assignment Systems in Education
Markets around the World.” Background paper pre-
pared for World Development Report 2024, World Bank,
Washington, DC.
Nieminen, Mika, and Erkki Kaukonen. 2001. Universities
and RD Networking in a Knowledge-Based Economy:
A Glance at Finnish Developments. Sitra Report 11.
Helsinki: Sitra.
NIHF (National Inventors Hall of Fame). 2022. “Behind the
NIHF Scenes: Camp Invention Is for Every Kind of Kid!”
NIHF, North Canton, OH. https://www.invent.org/blog
/behind-nihf-scenes/camp-invention-2022-all-kids.
OECD (Organisation for Economic Co-operation and
Development). 2021. “Man Enough? Measuring
Masculine Norms to Promote Women’s Empowerment.”
Social Institutions and Gender Index Series, OECD
Development Centre, Paris.
Pagano, Marco, and Paolo F. Volpin. 2005. “Managers,
Workers, and Corporate Control.” Journal of Finance
60 (2): 841–68.
Paredes, Ricardo. 2024. “Duoc and the Higher Vocational
Technical Education in Chile.” Background paper pre-
pared for World Development Report 2024, World Bank,
Washington, DC.
Pekkarinen, Tuomas, Roope Uusitalo, and Sari Pekkala Kerr.
2009. “School Tracking and Intergenerational Income
Mobility: Evidence from the Finnish Comprehensive
School Reform.” Journal of Public Economics 93 (7–8):
965–73.
Peters, Marjolein, Kees Meijer, Etienne van Nuland,
Thijs Viertelhauzen, and Ekim Sincer. 2010.](https://image.slidesharecdn.com/worlddevelopmentreport2024-240805082550-605477af/85/World-Bank-World-Development-Report-2024-250-320.jpg)


The World Development Report 2024 focuses on the 'middle-income trap,' analyzing the challenges faced by middle-income countries in achieving sustained growth and transitioning to high-income status. Key issues include slowing growth, structural stasis, and the dynamics of creative destruction, highlighting the importance of innovation and institutional reform. The report emphasizes the need for policies that foster economic mobility and encourage competition to overcome these challenges.


