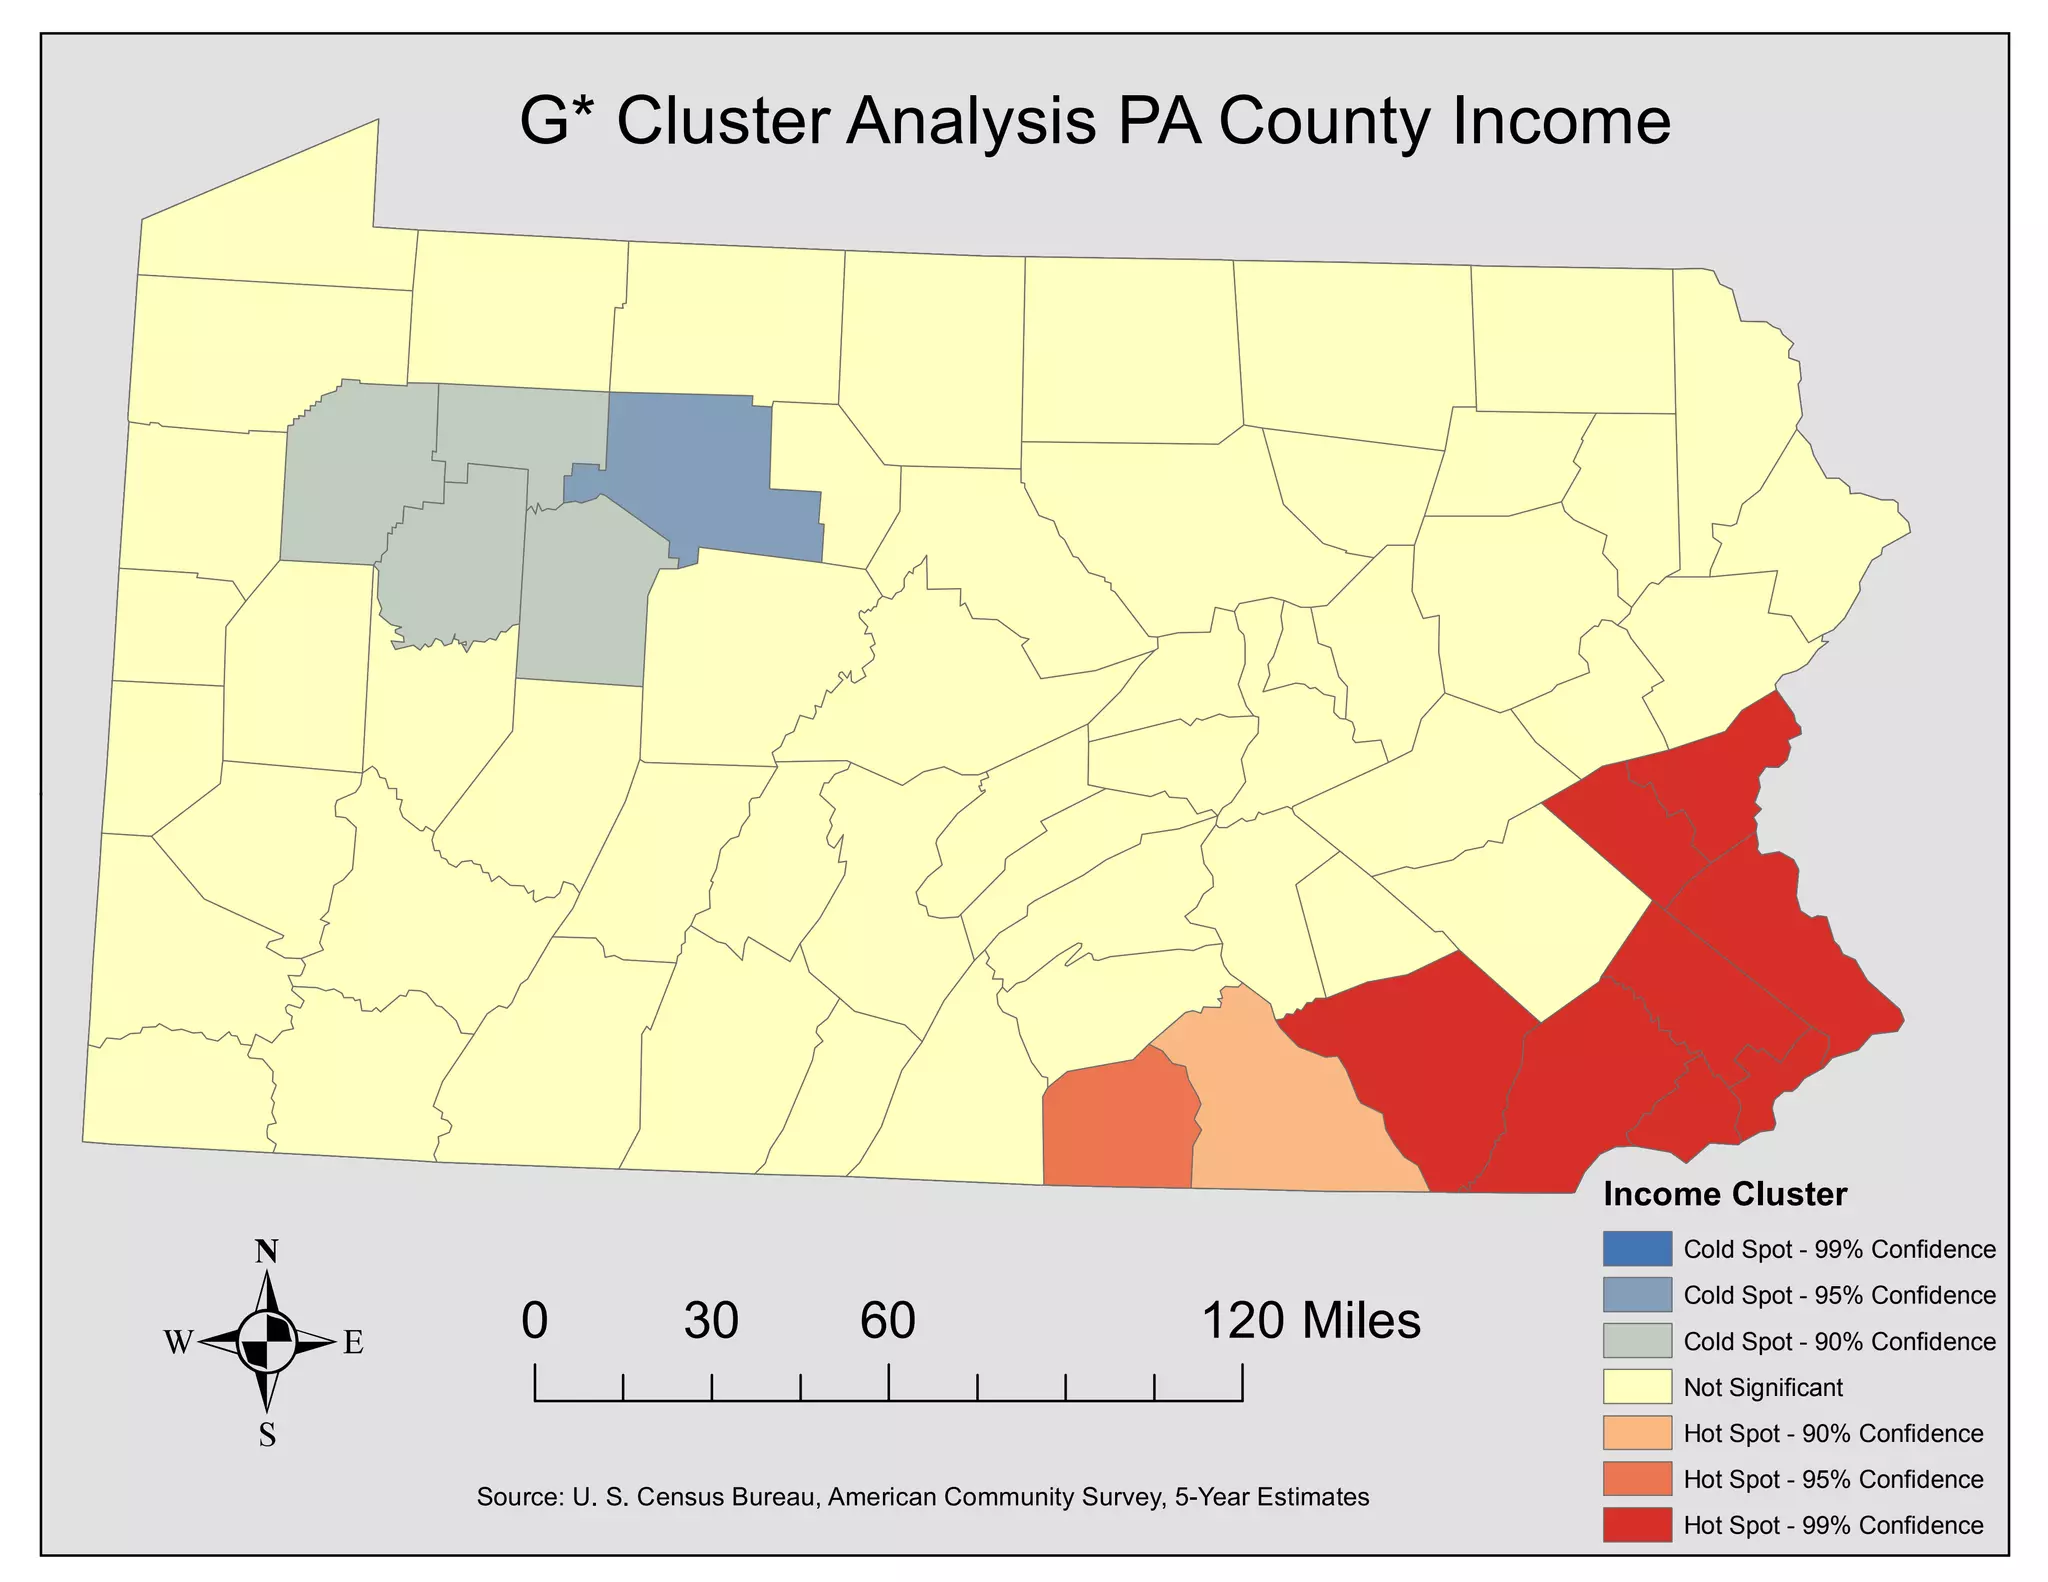
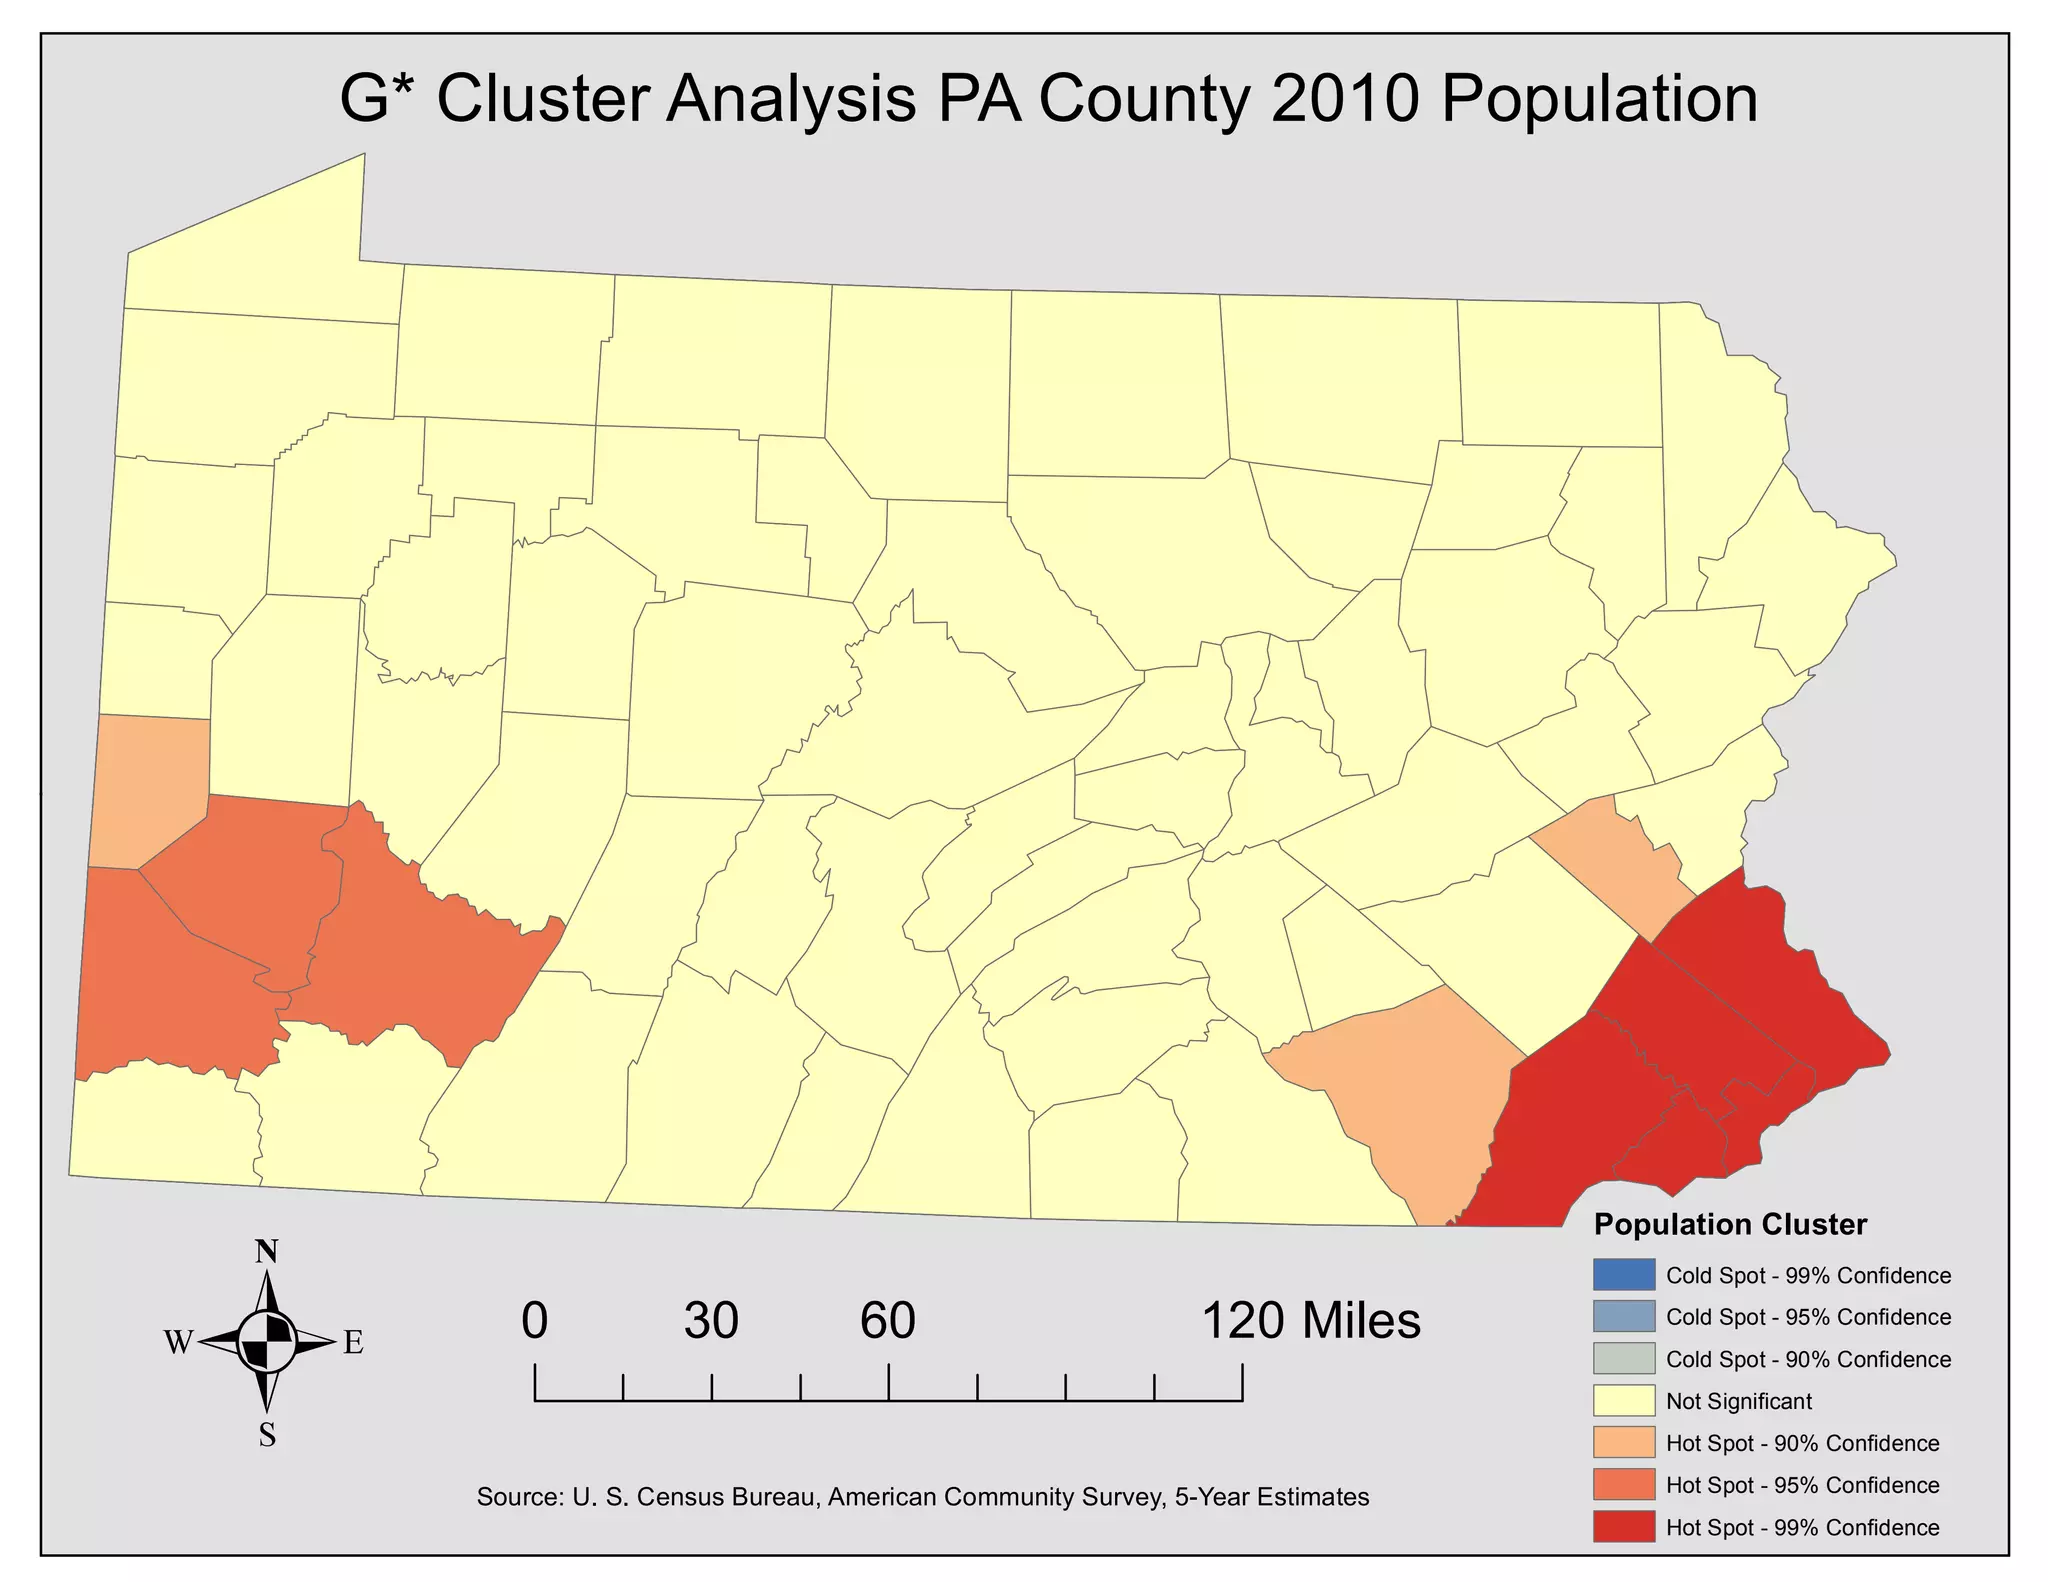
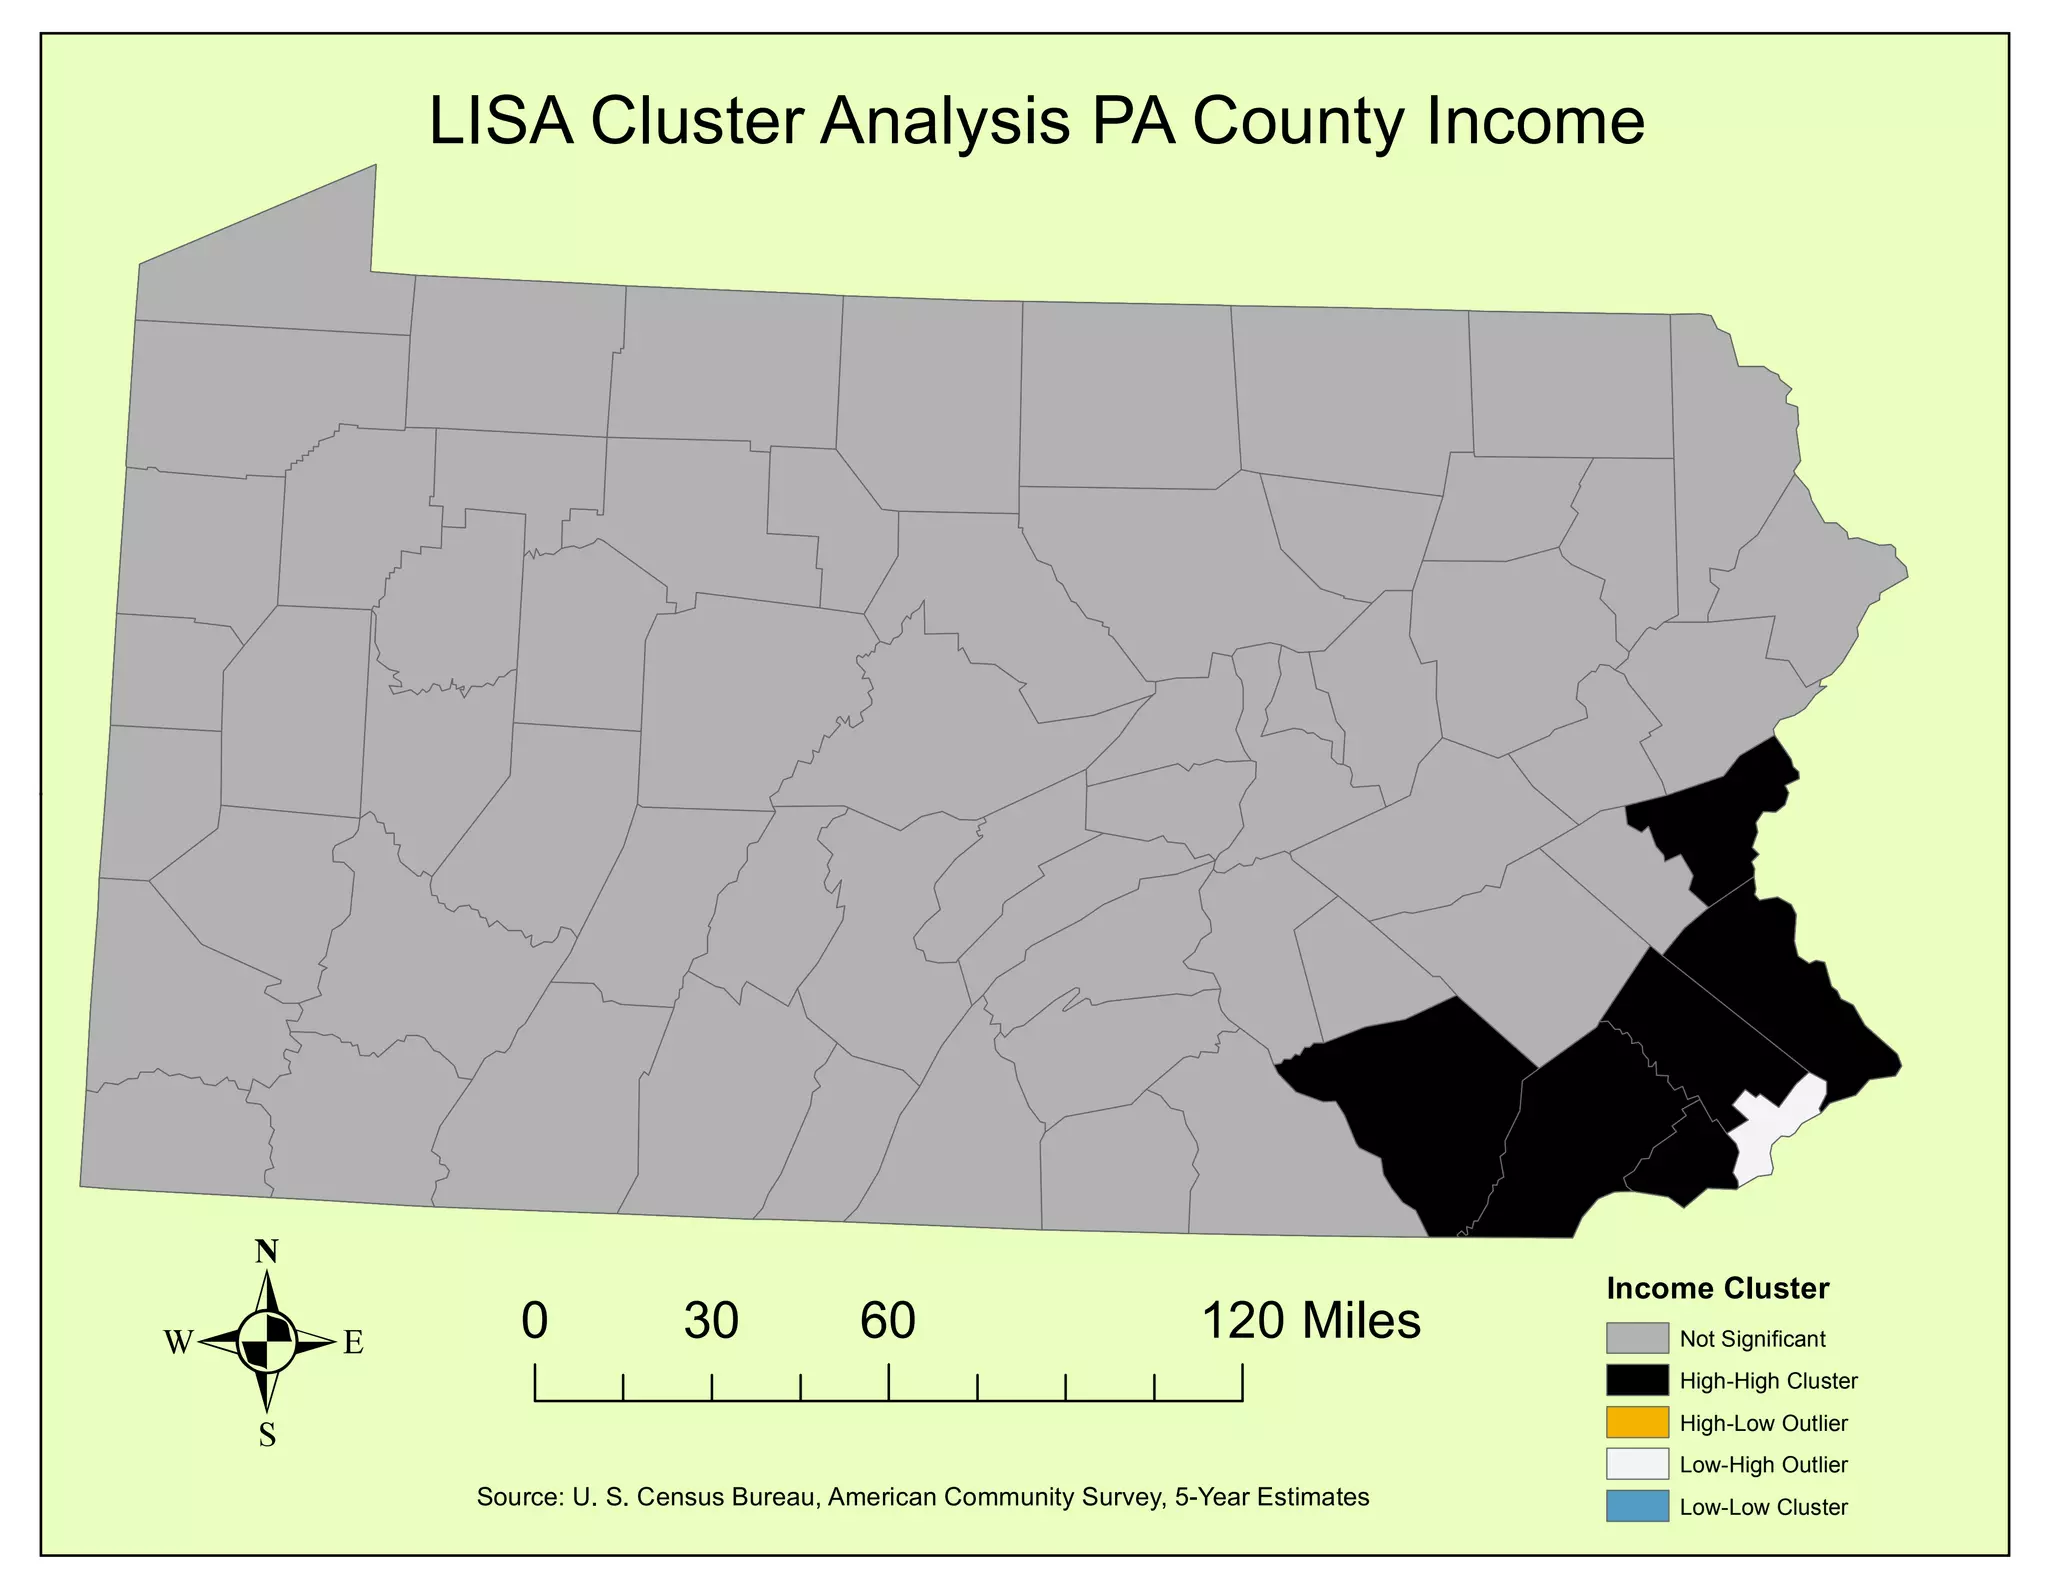
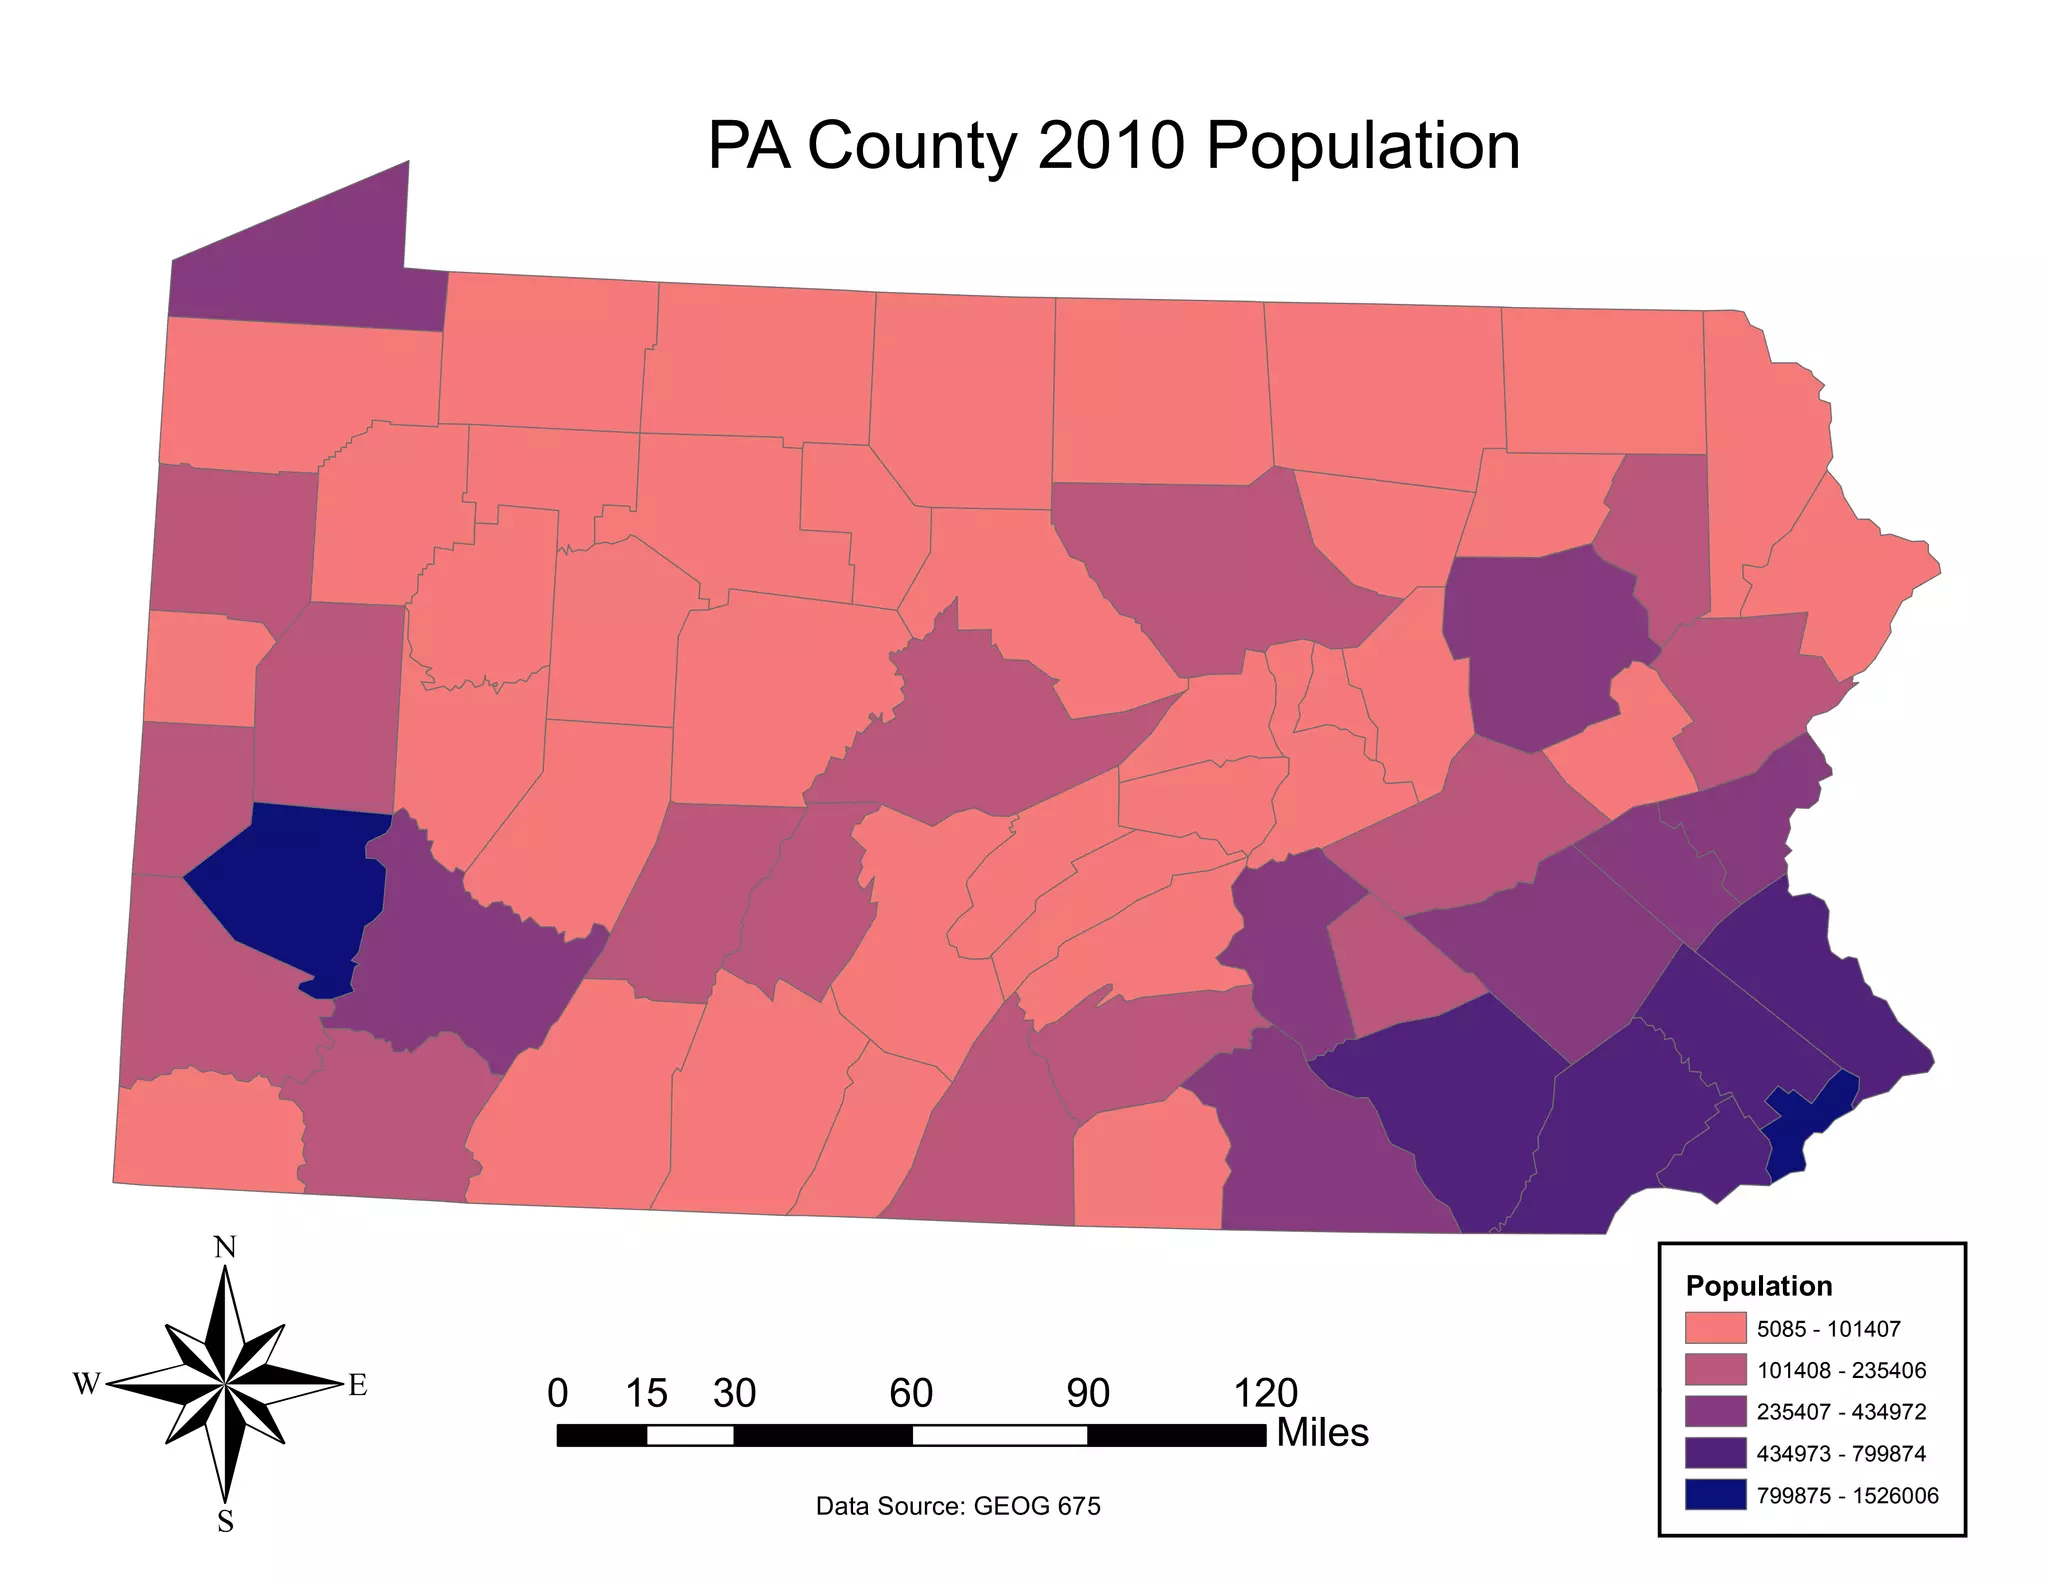
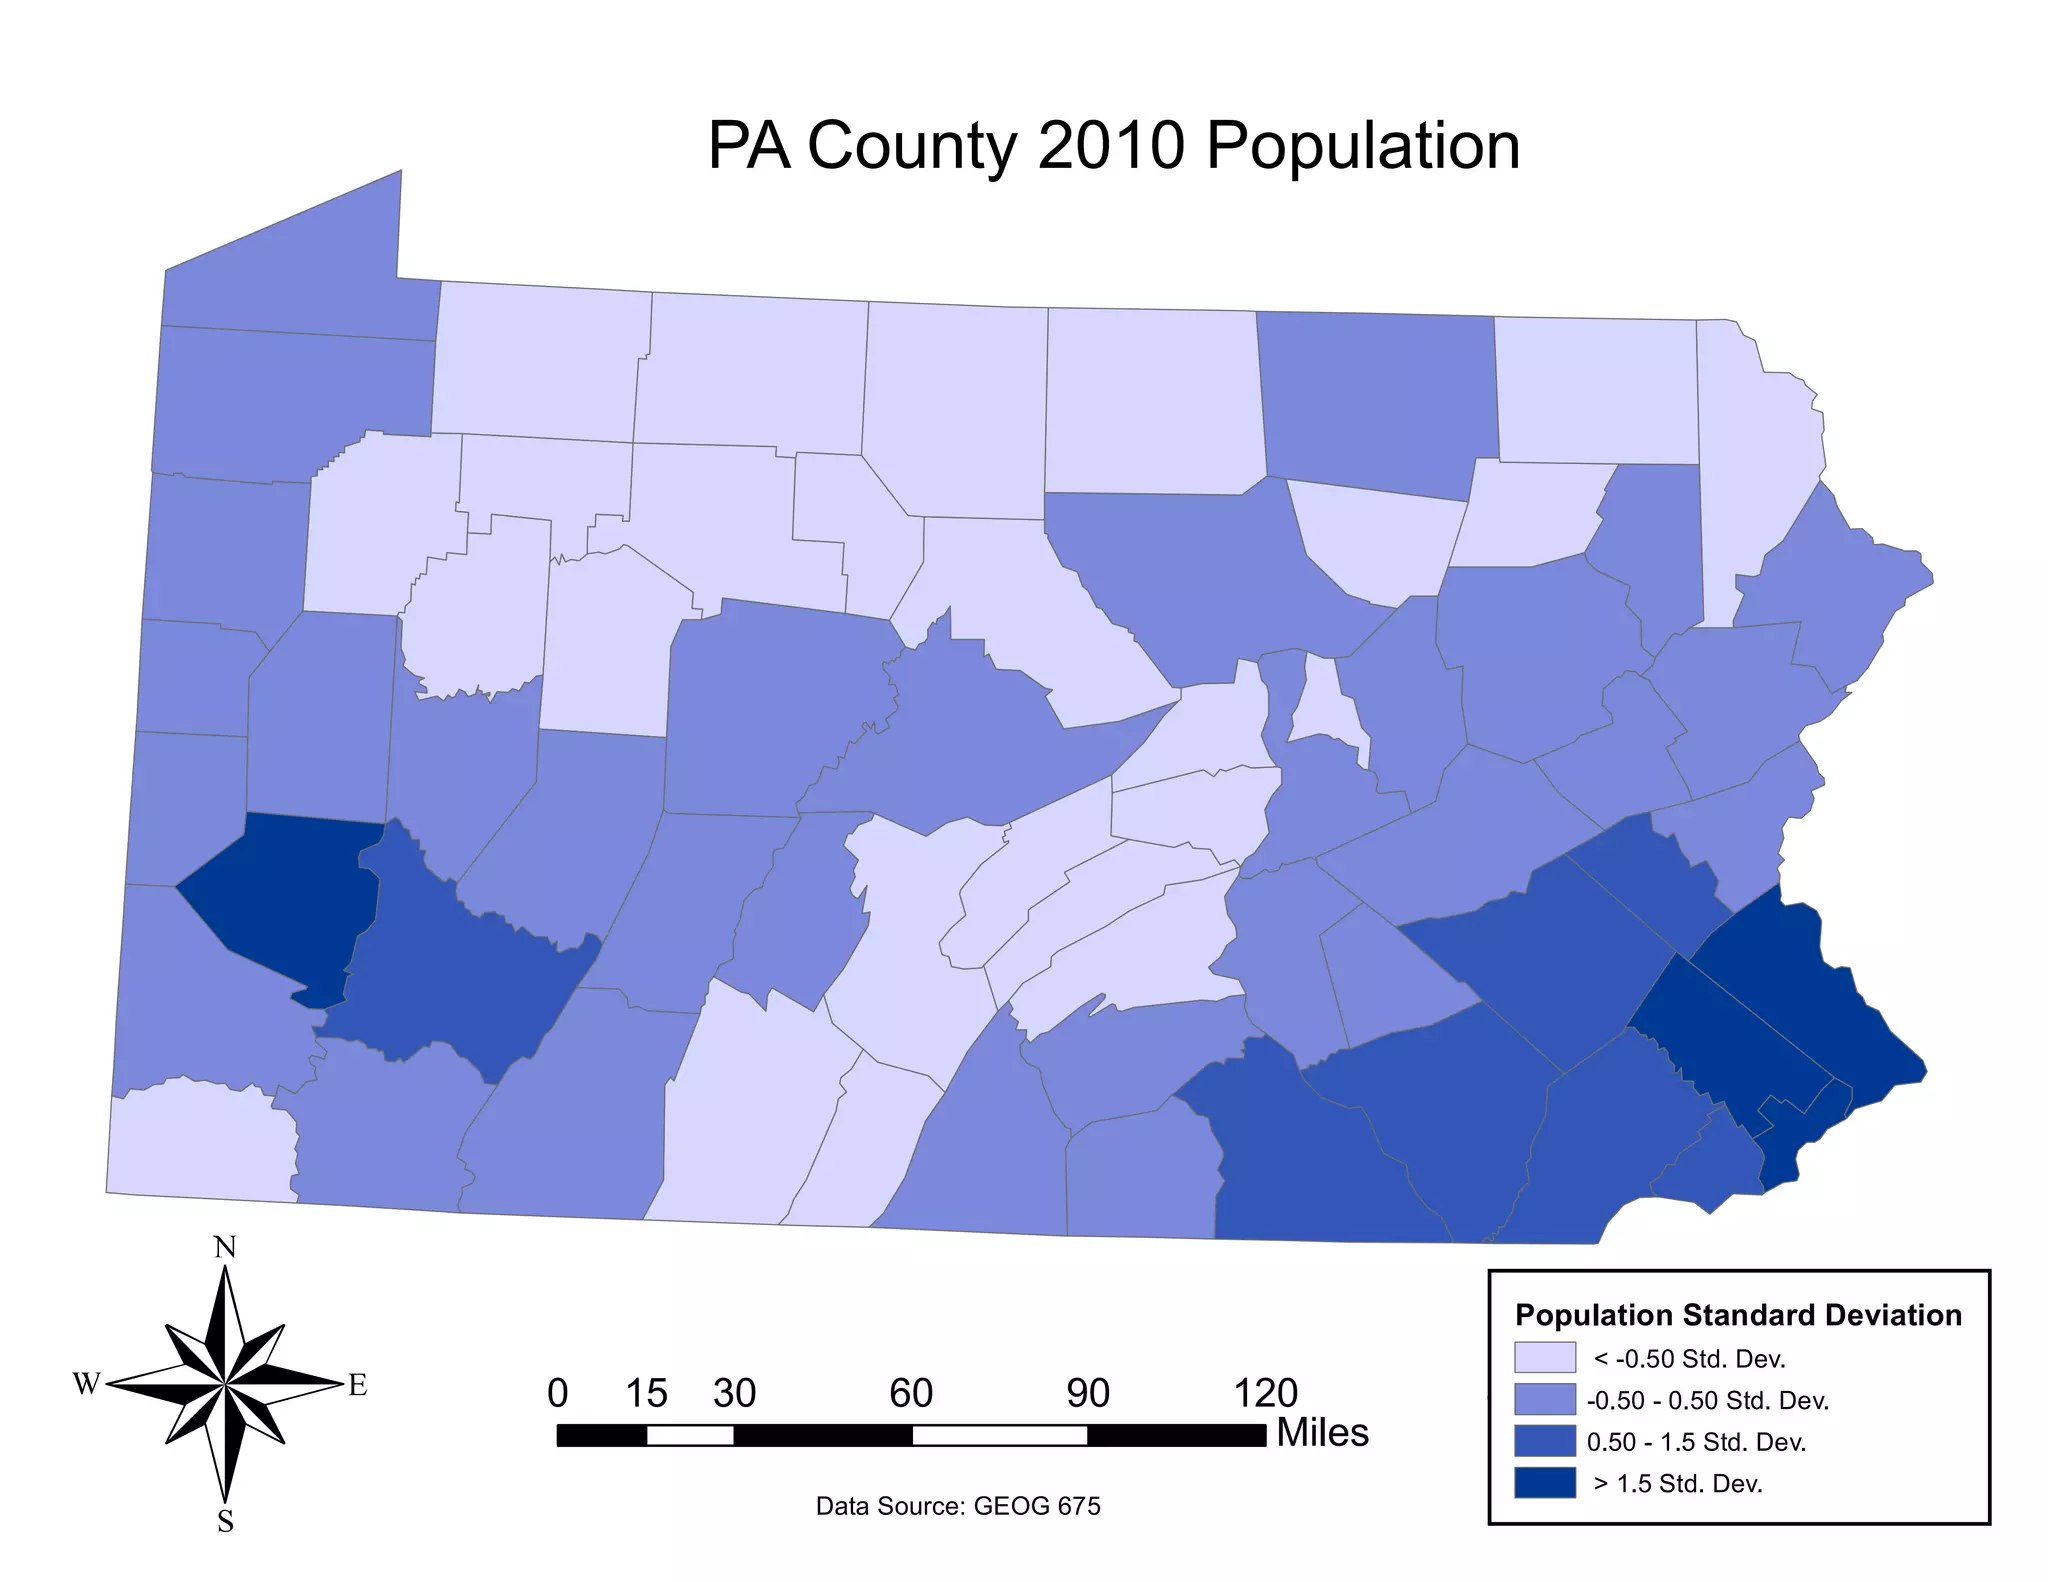
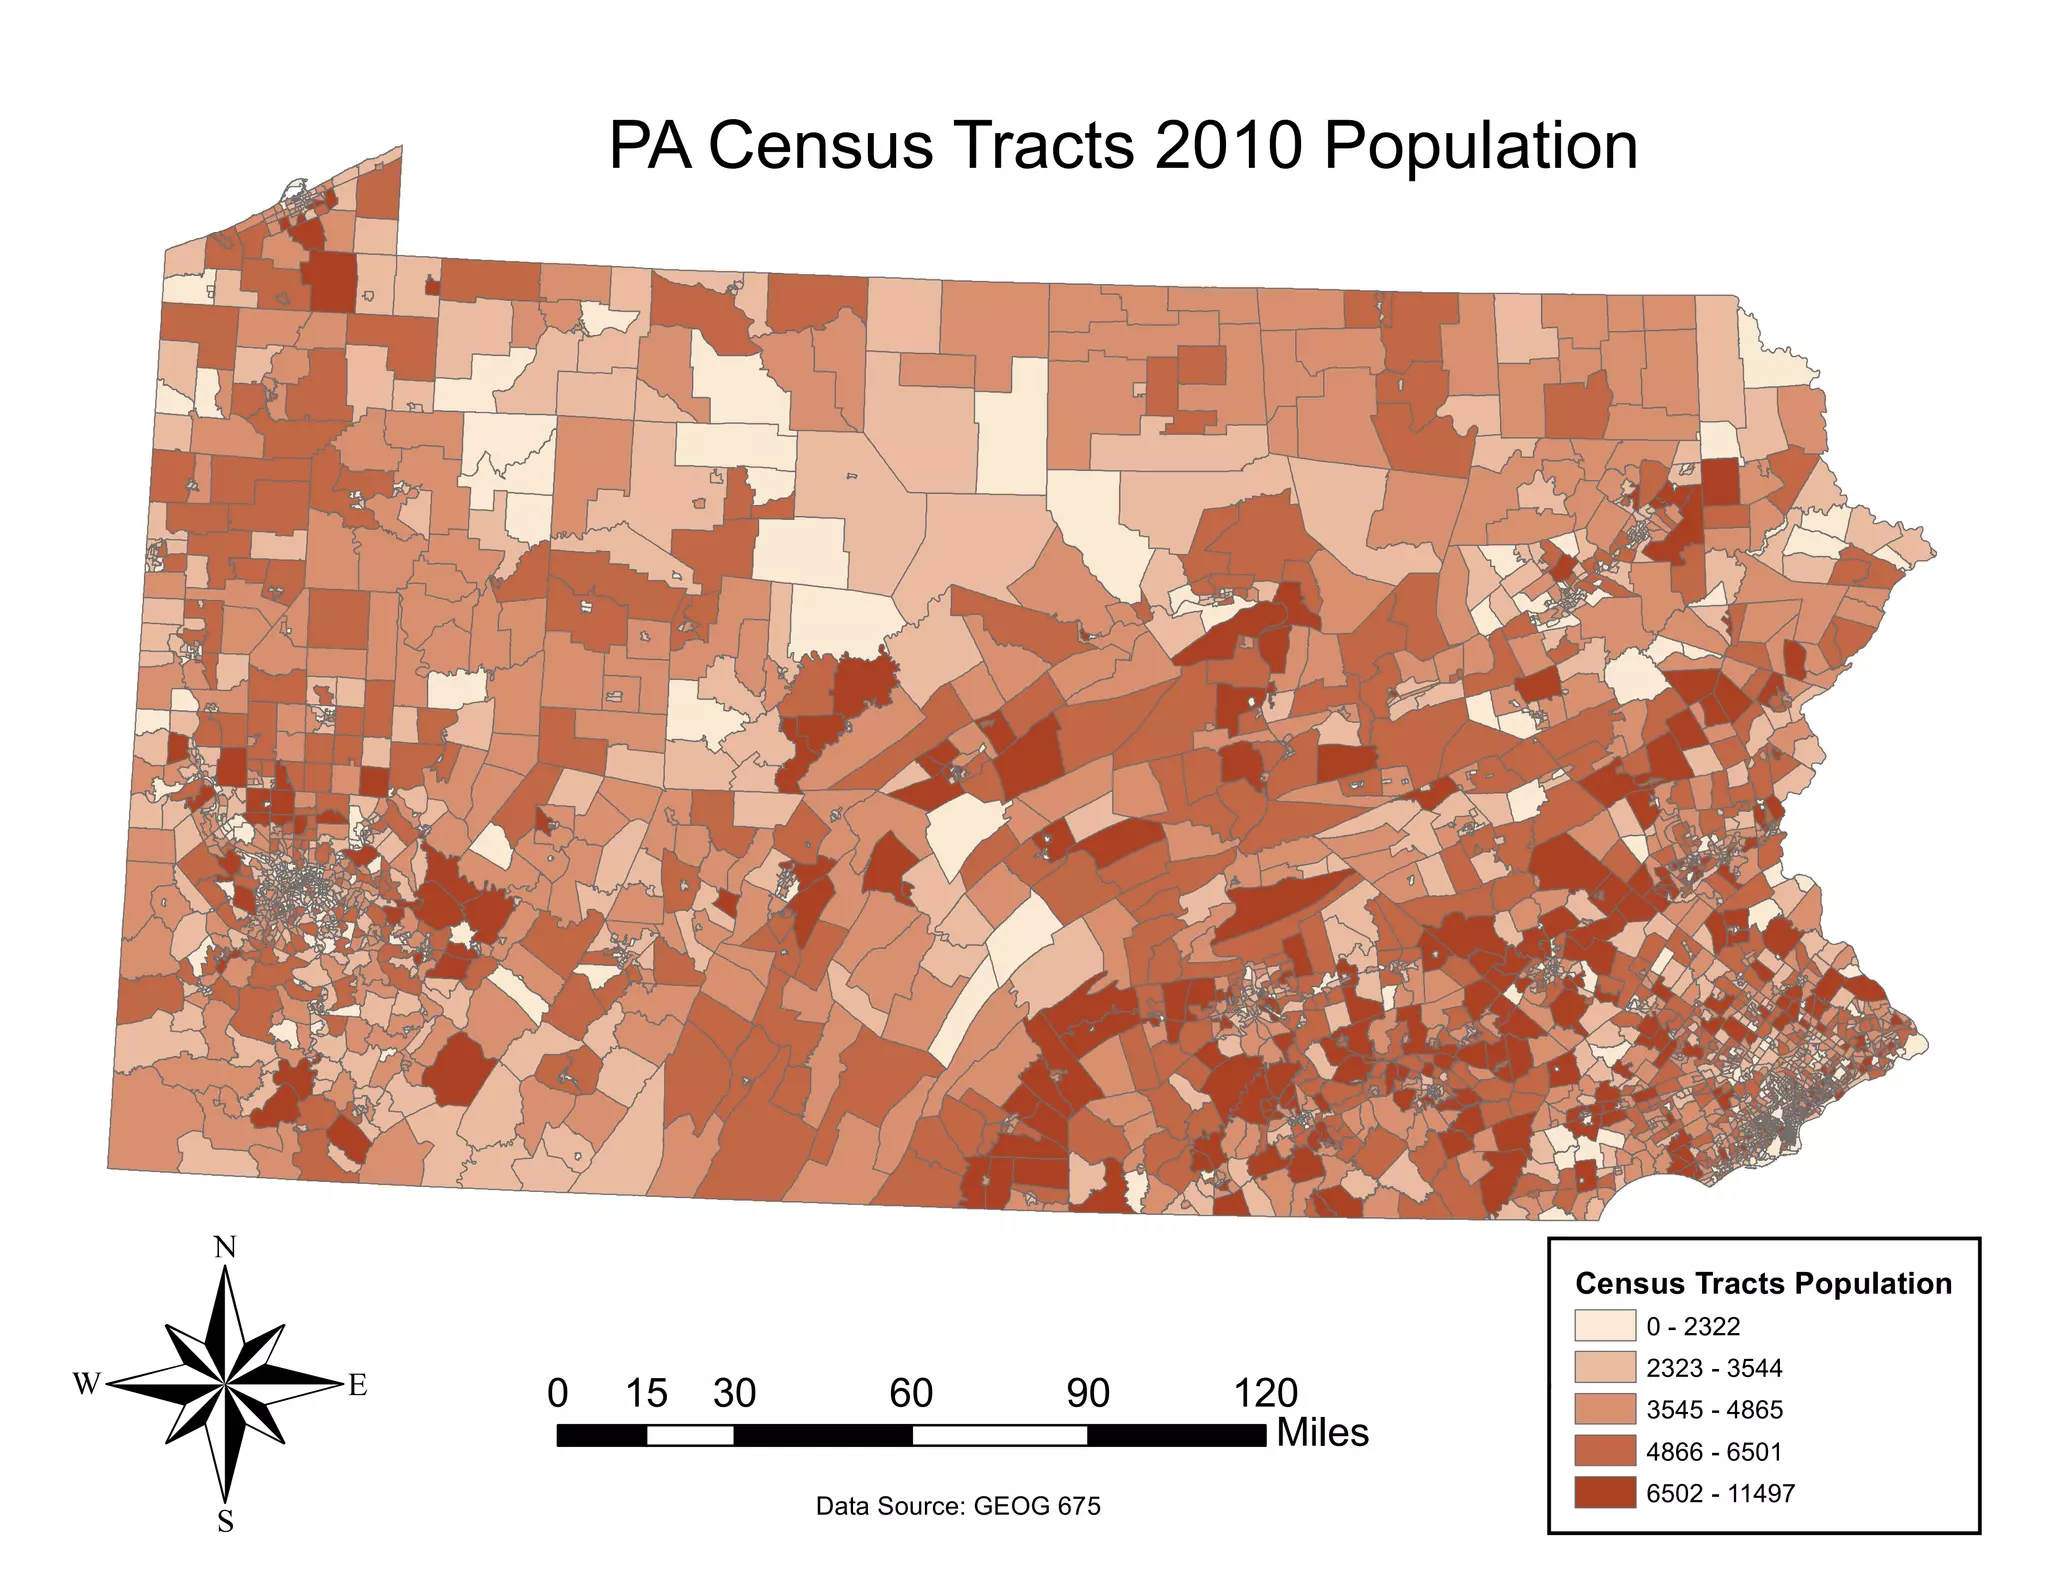
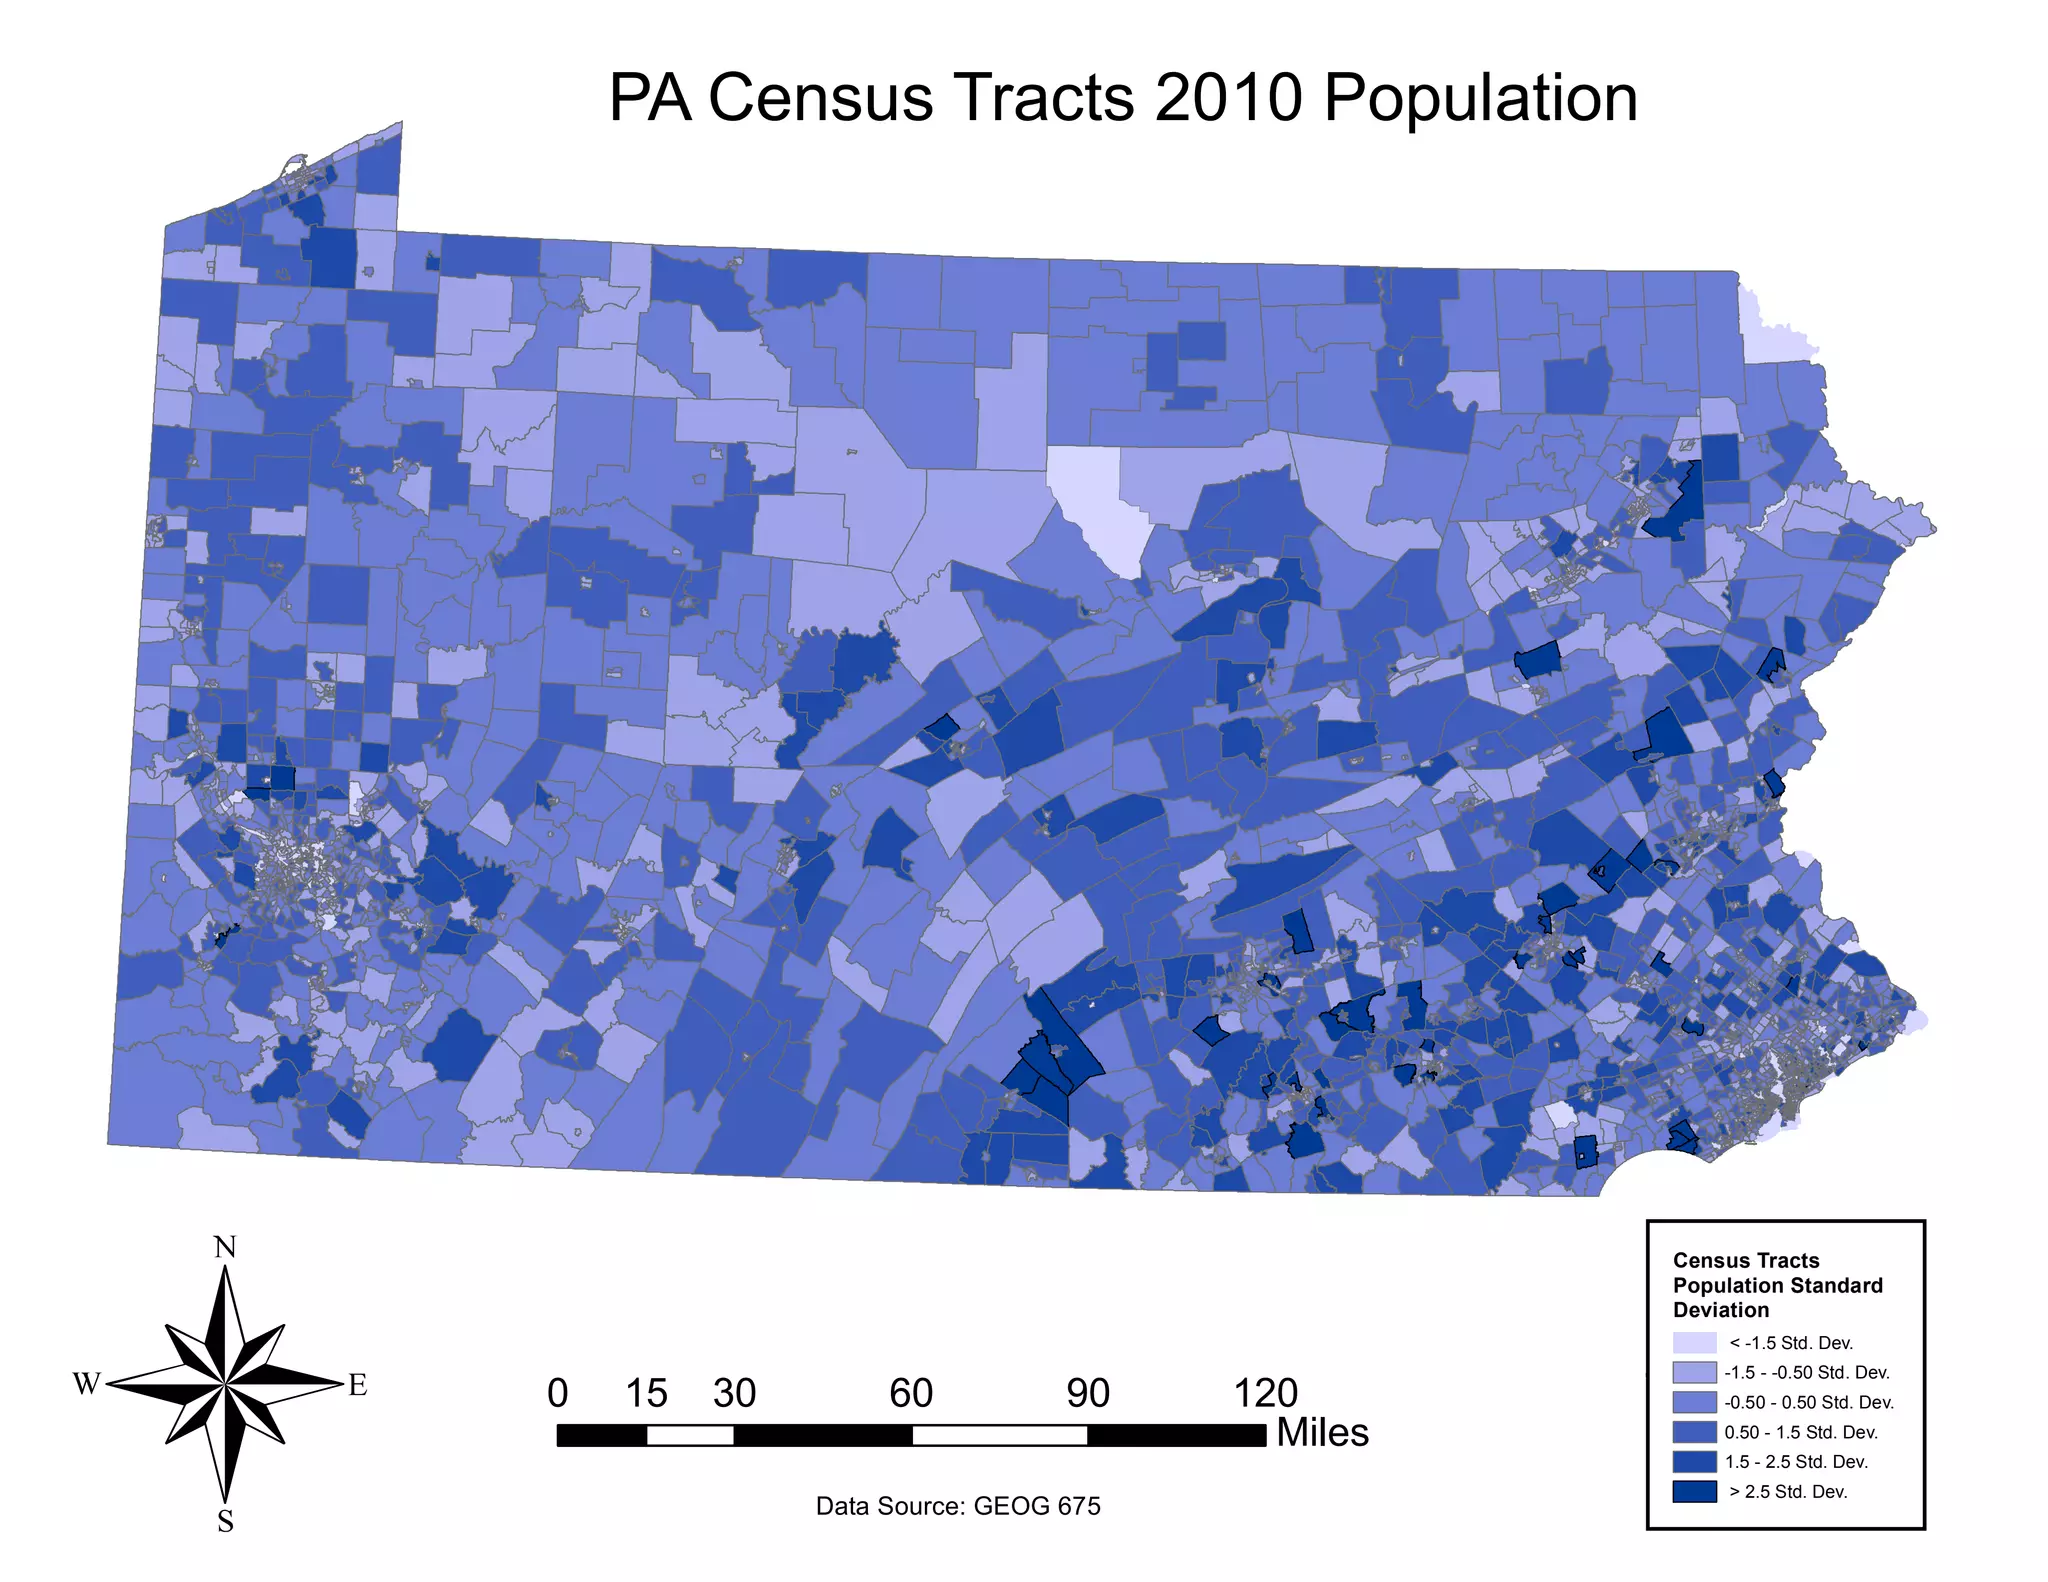
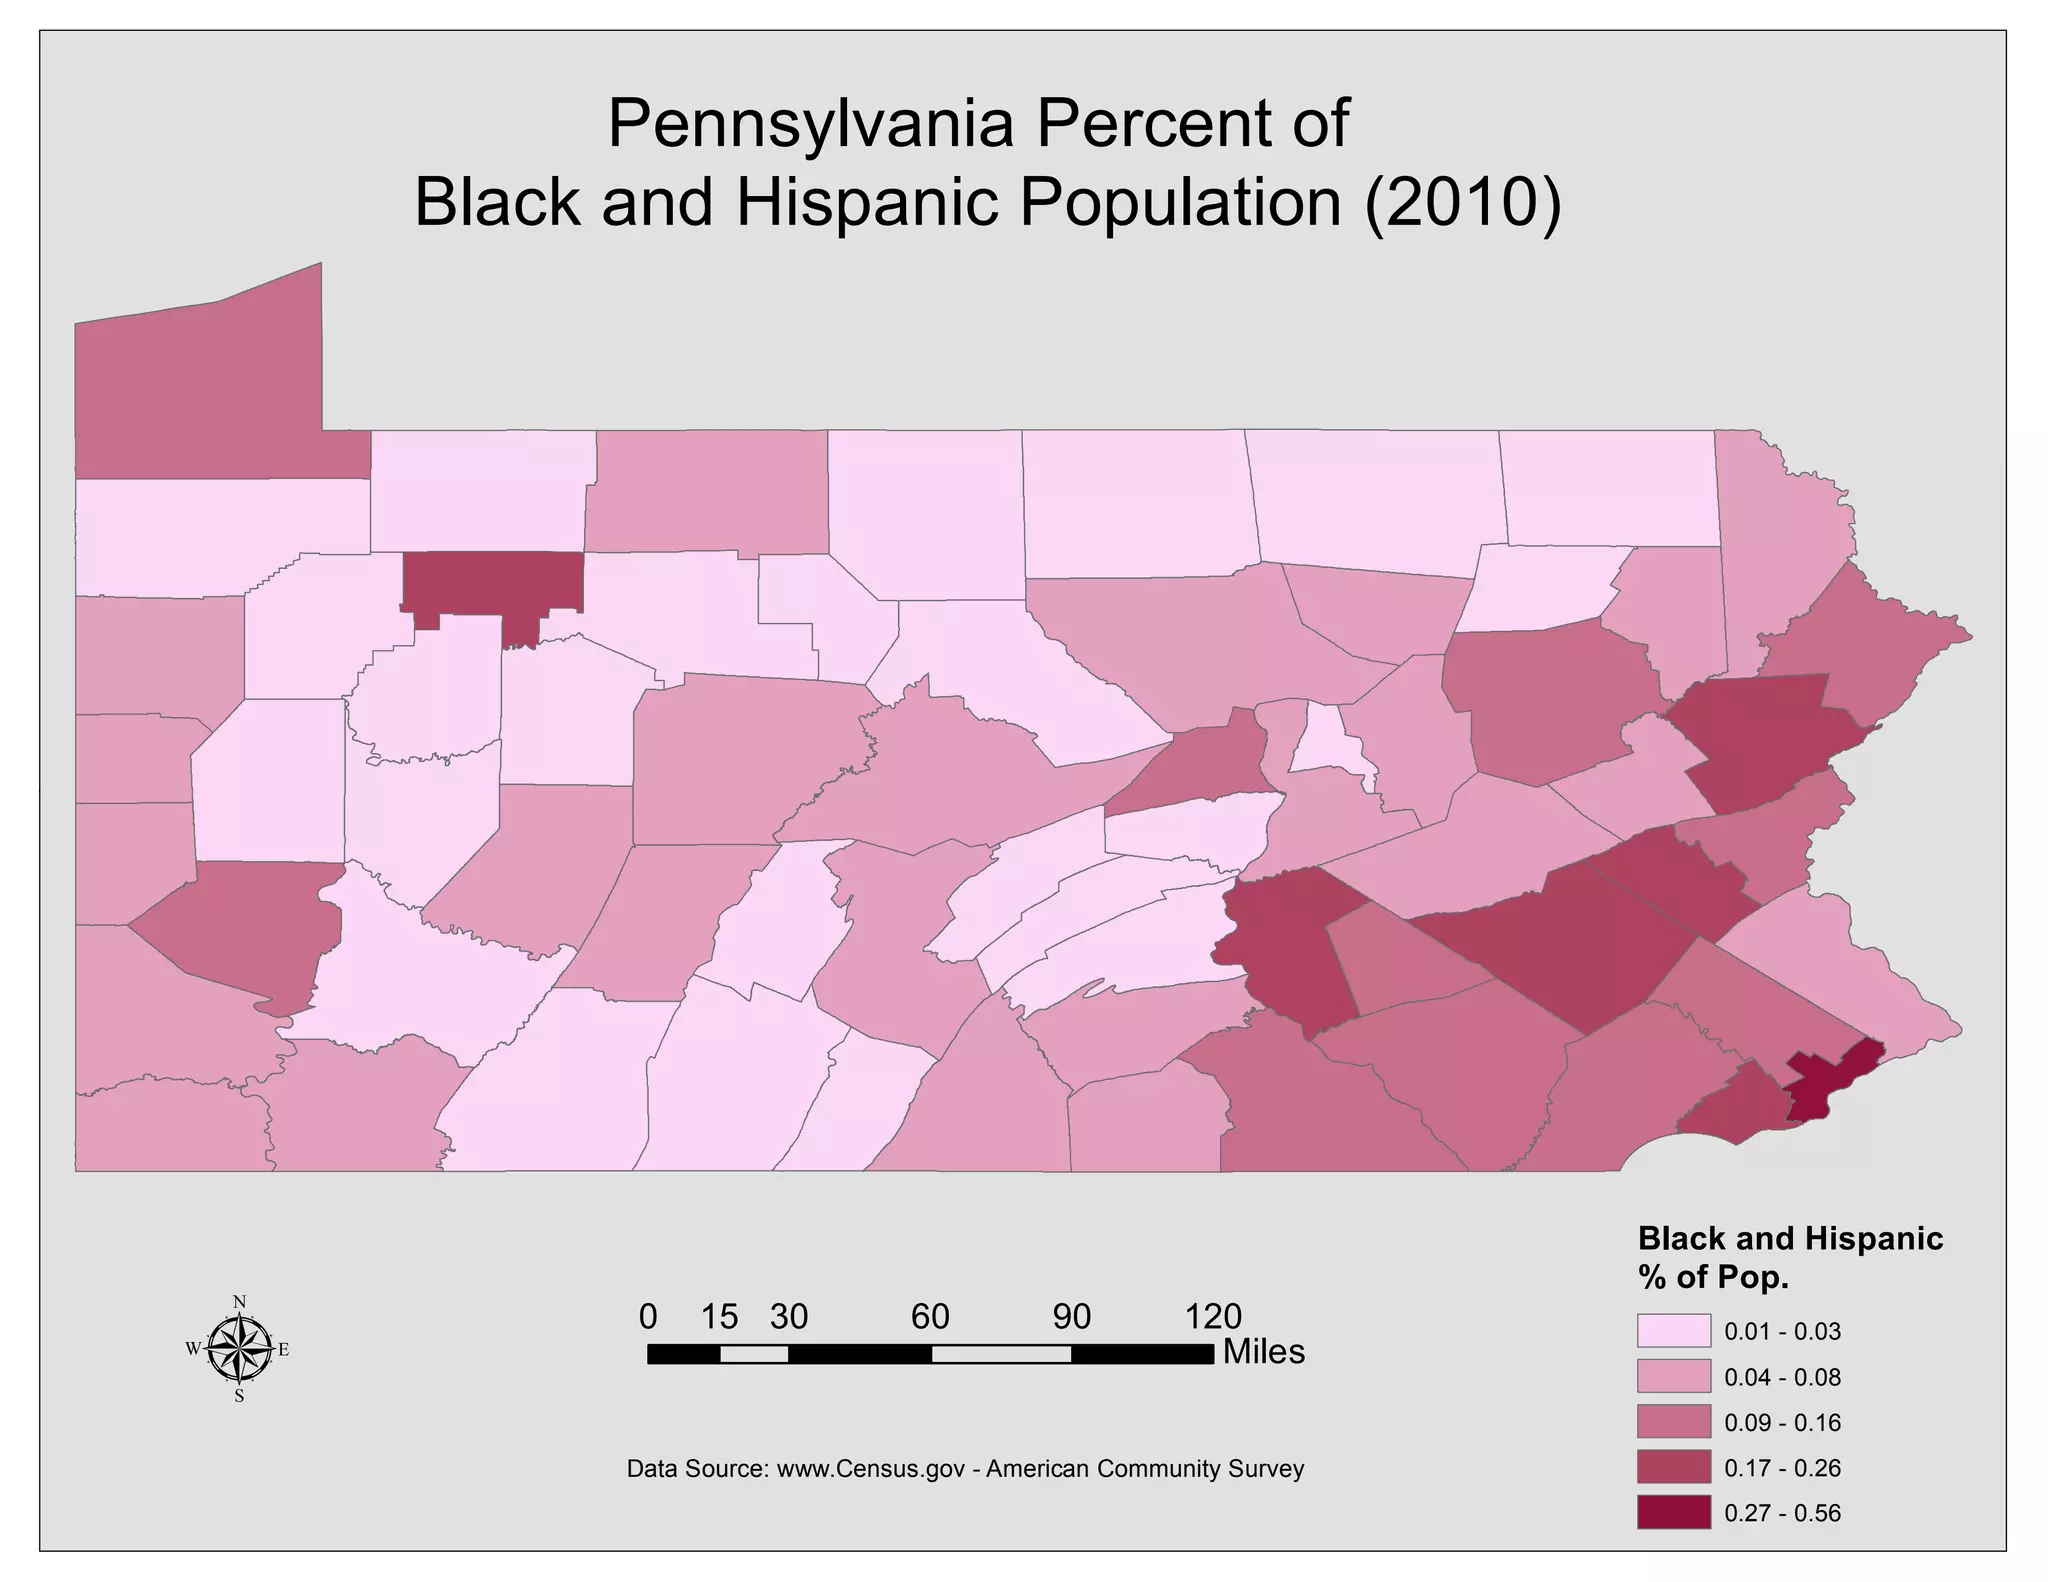
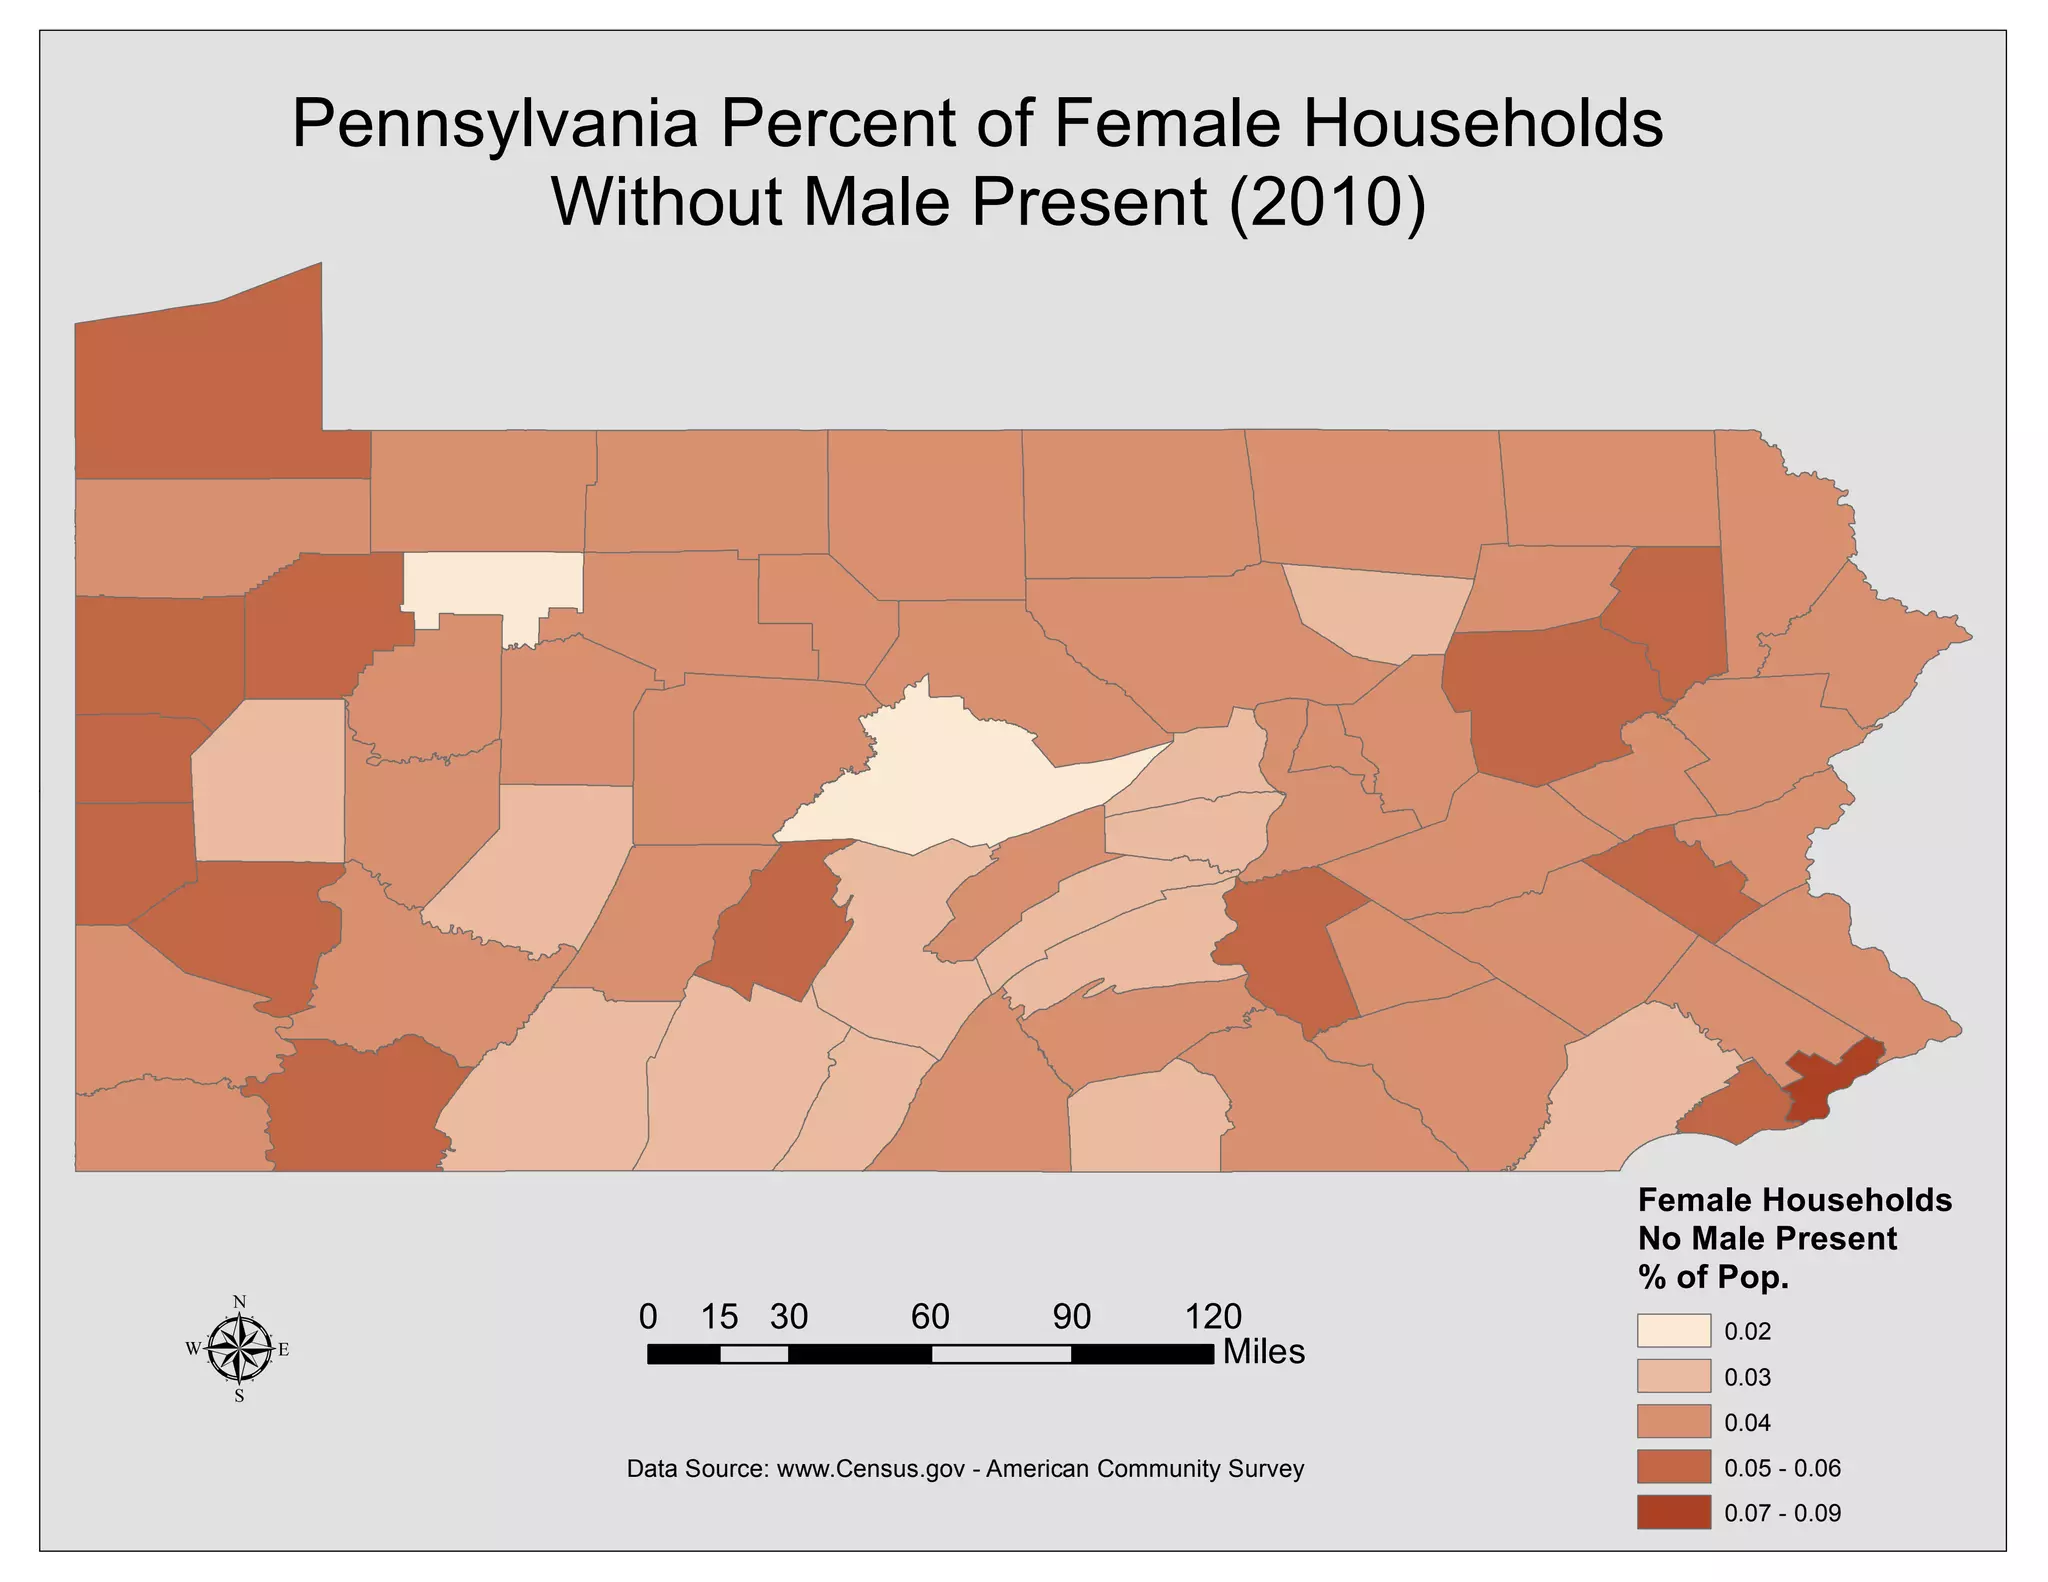
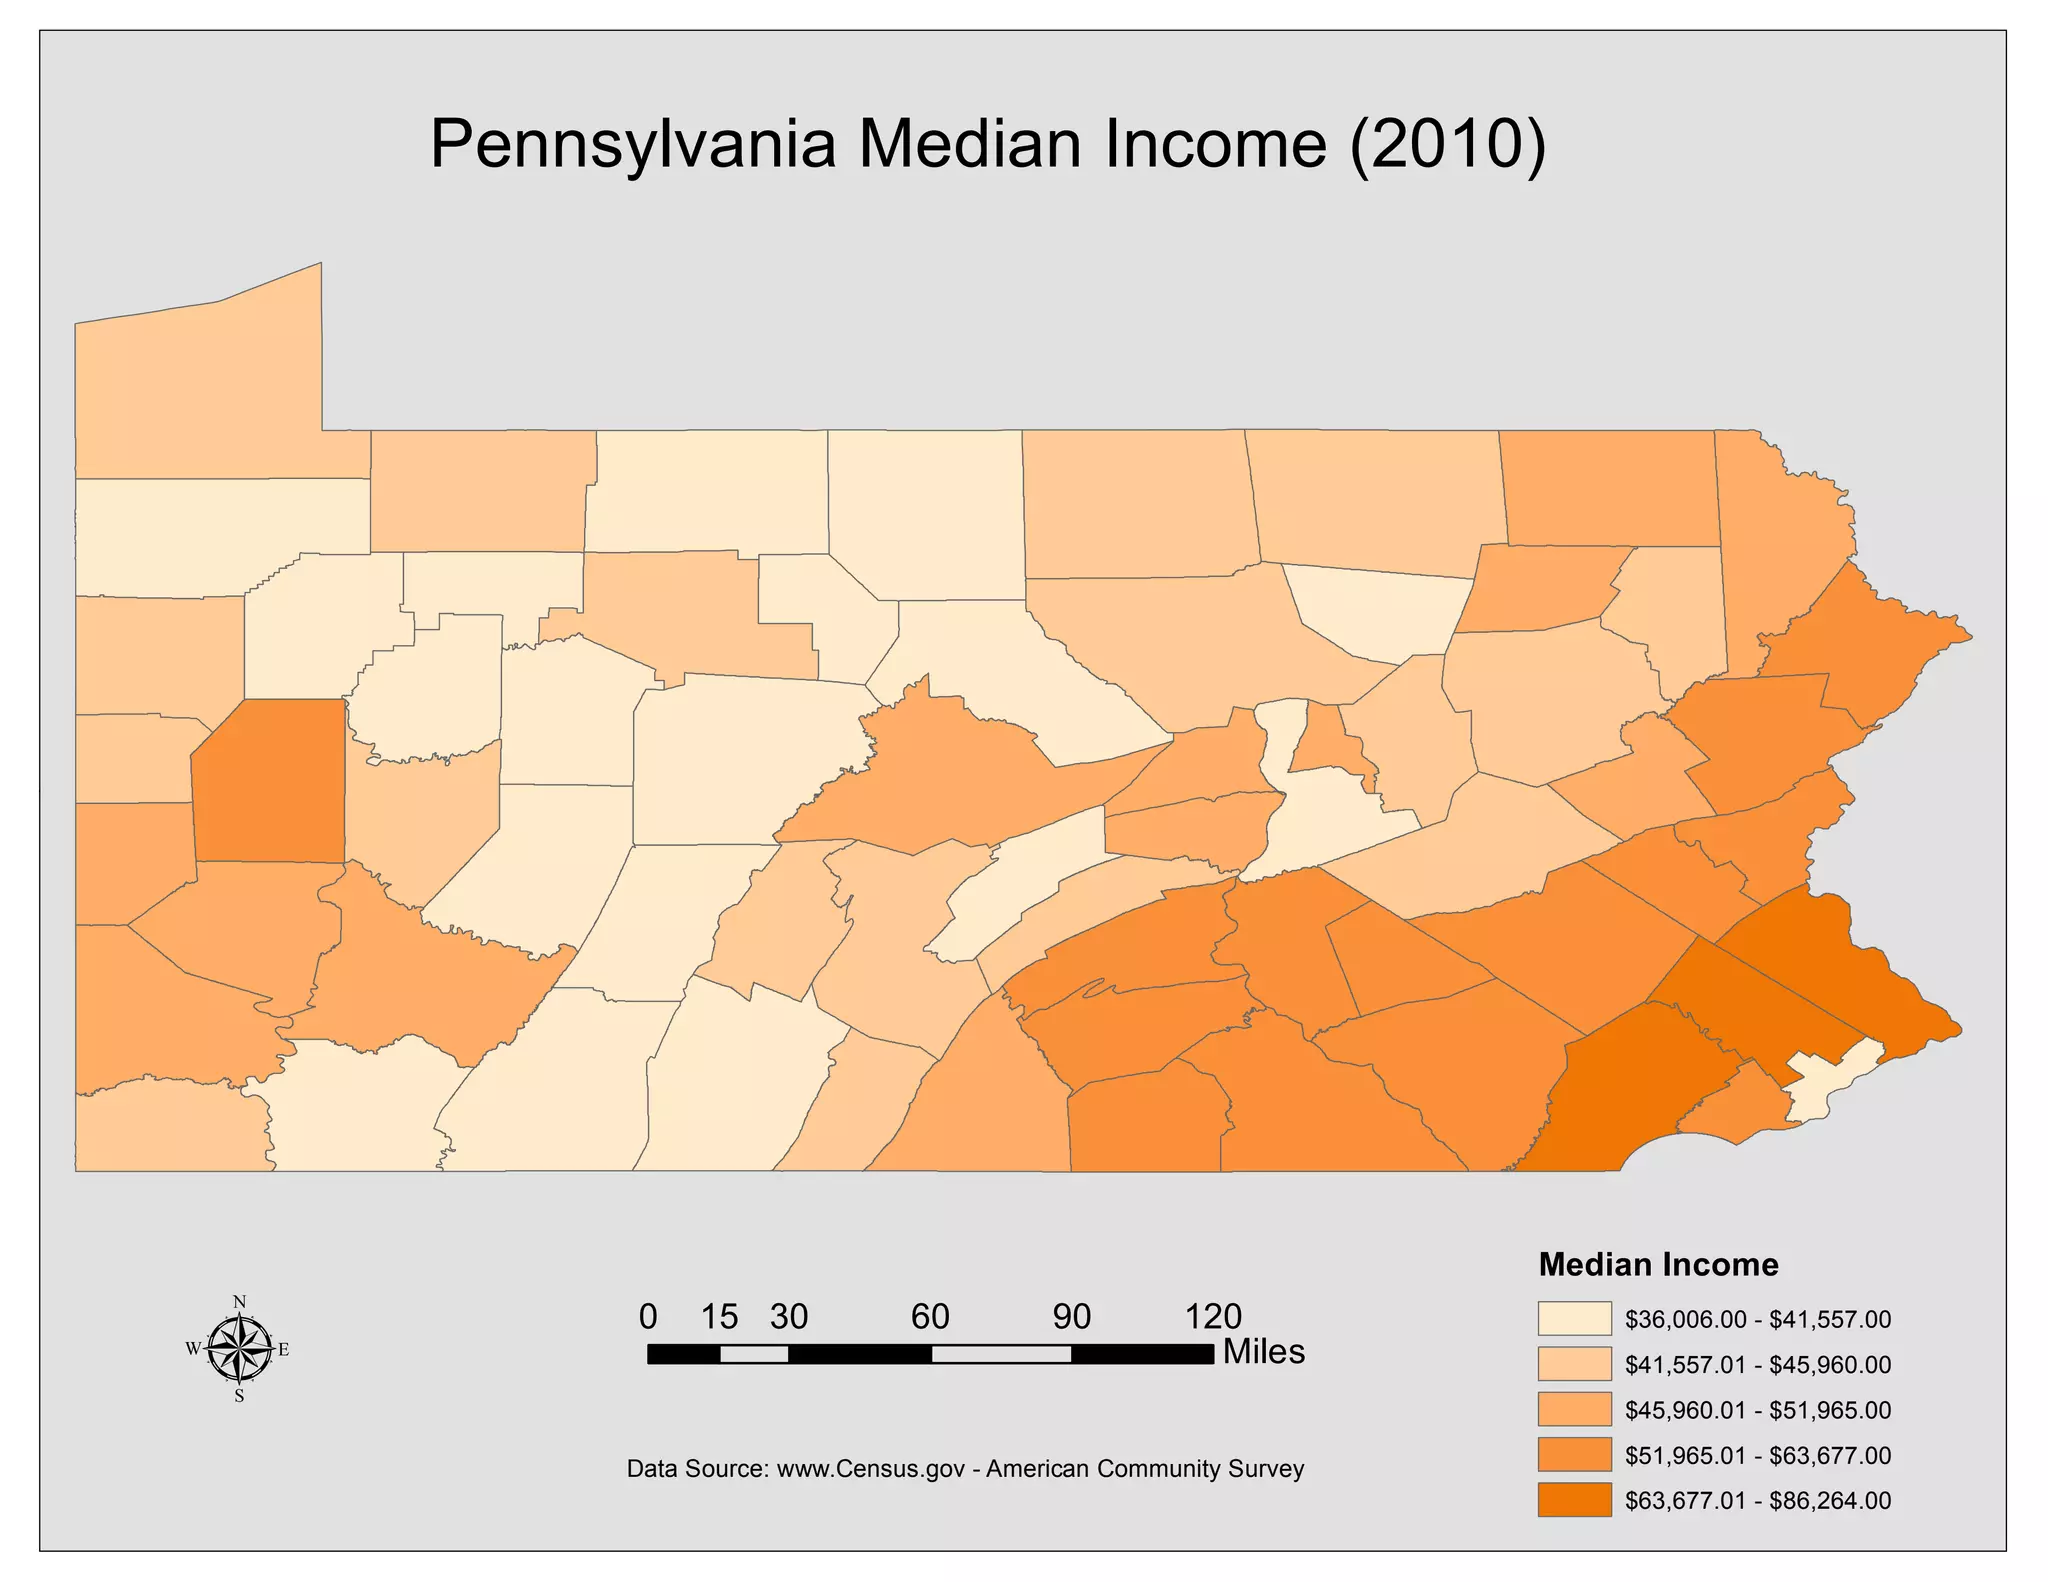
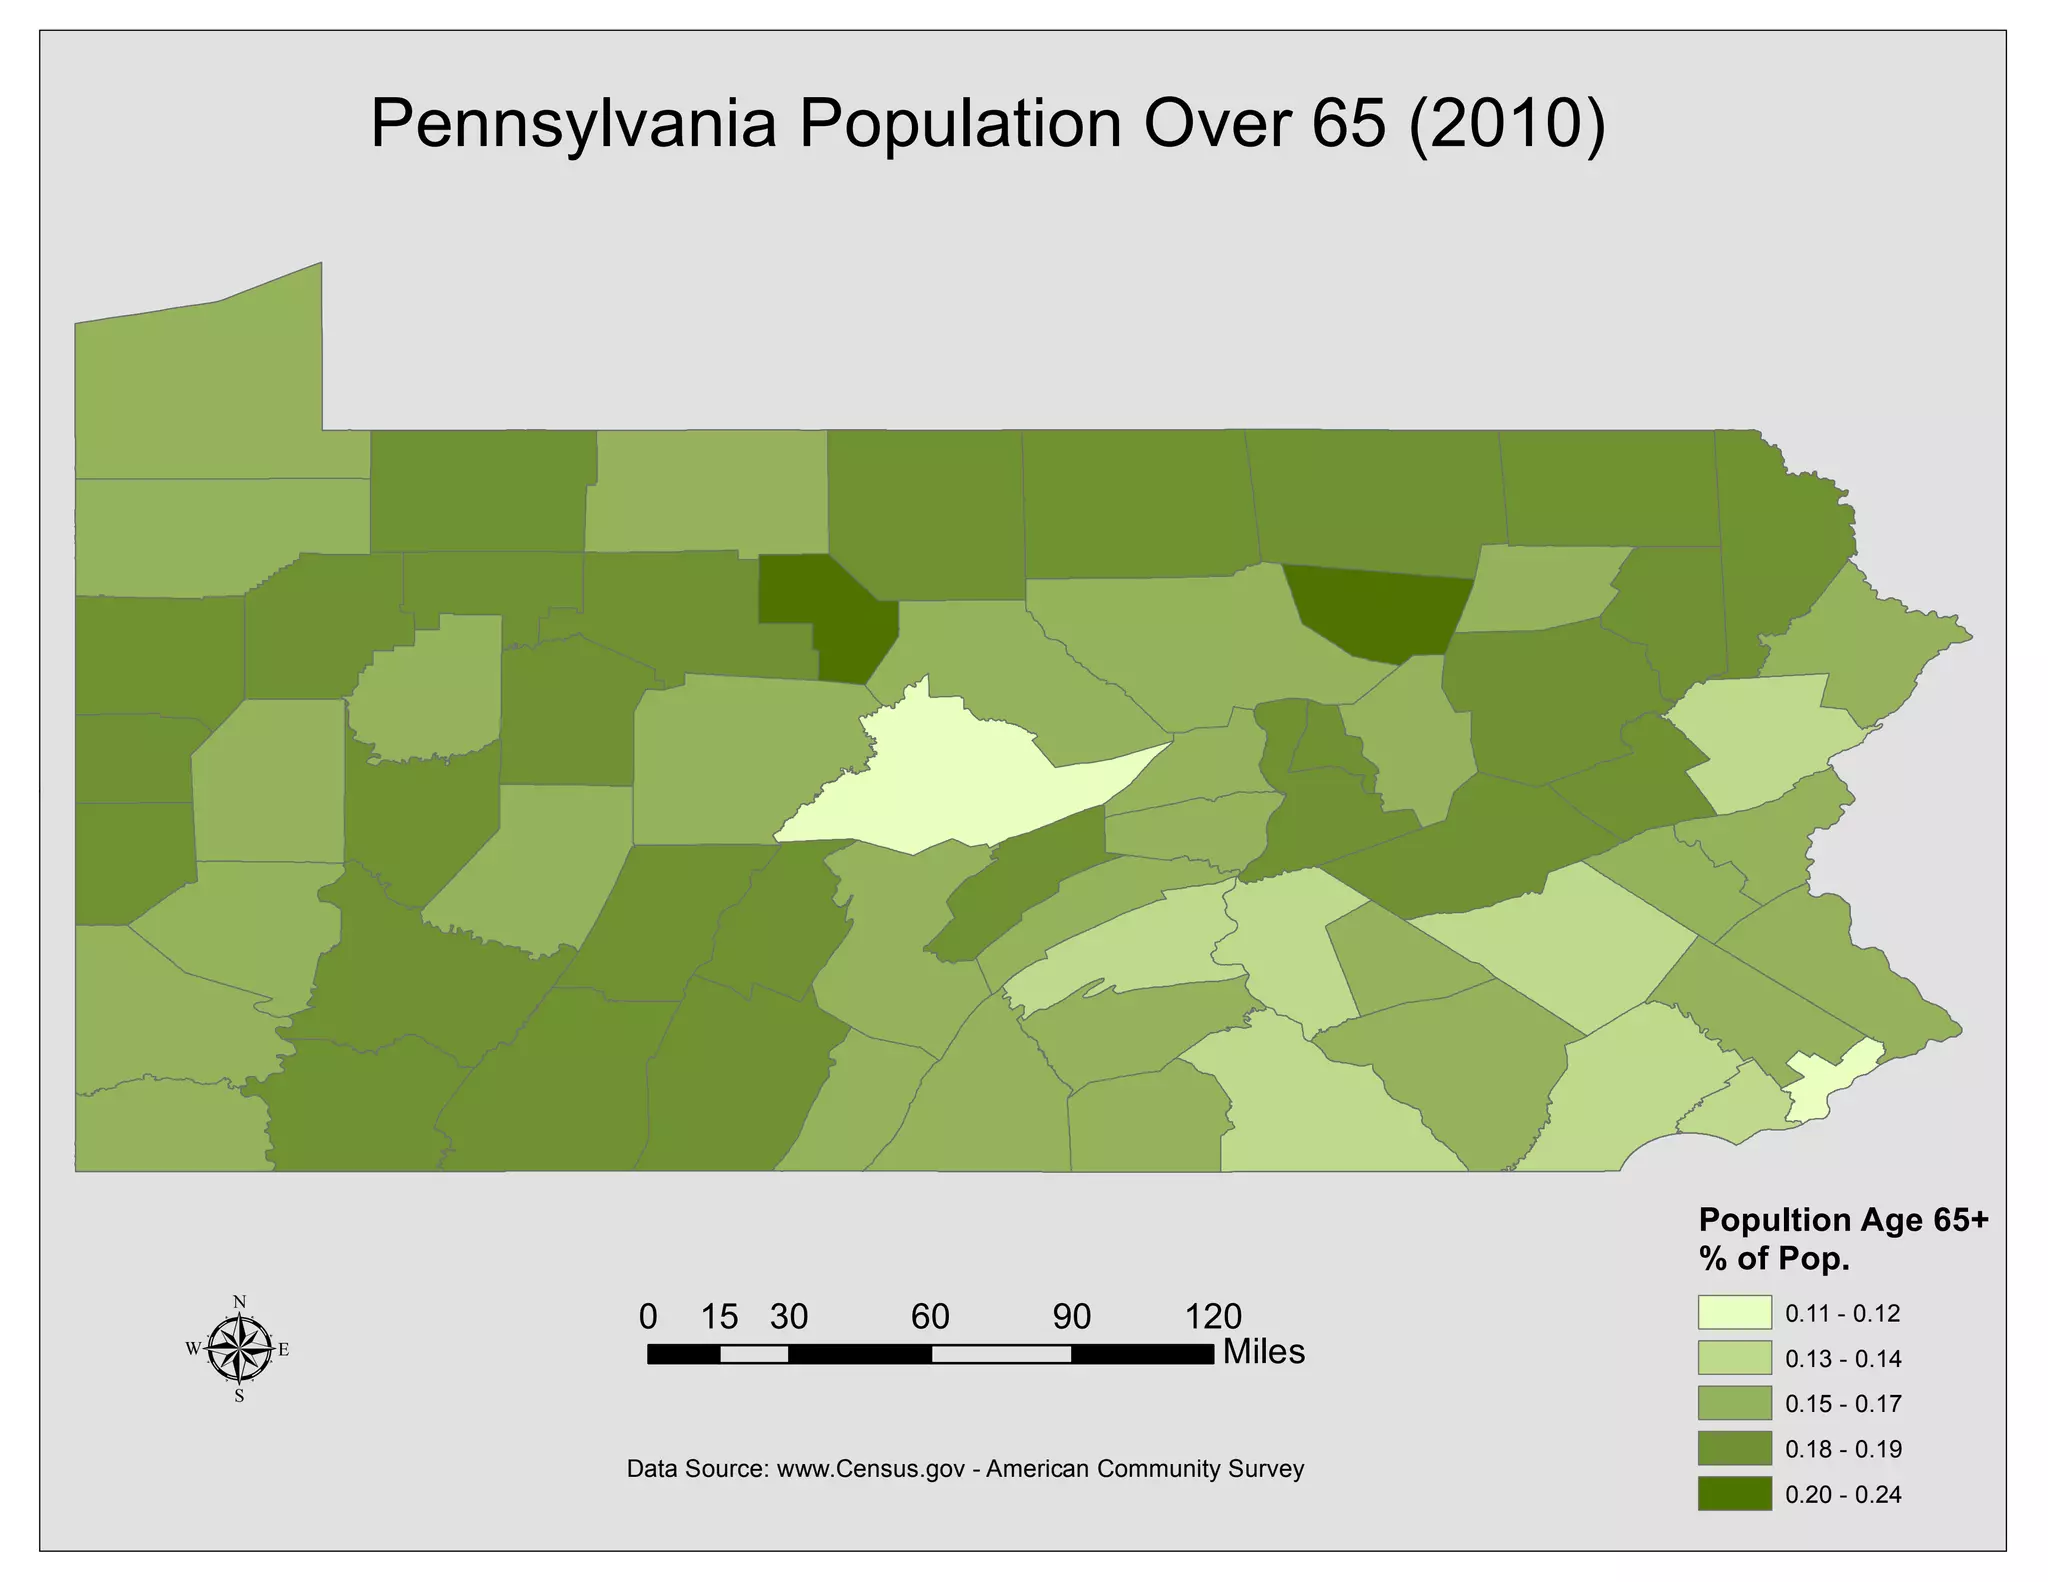
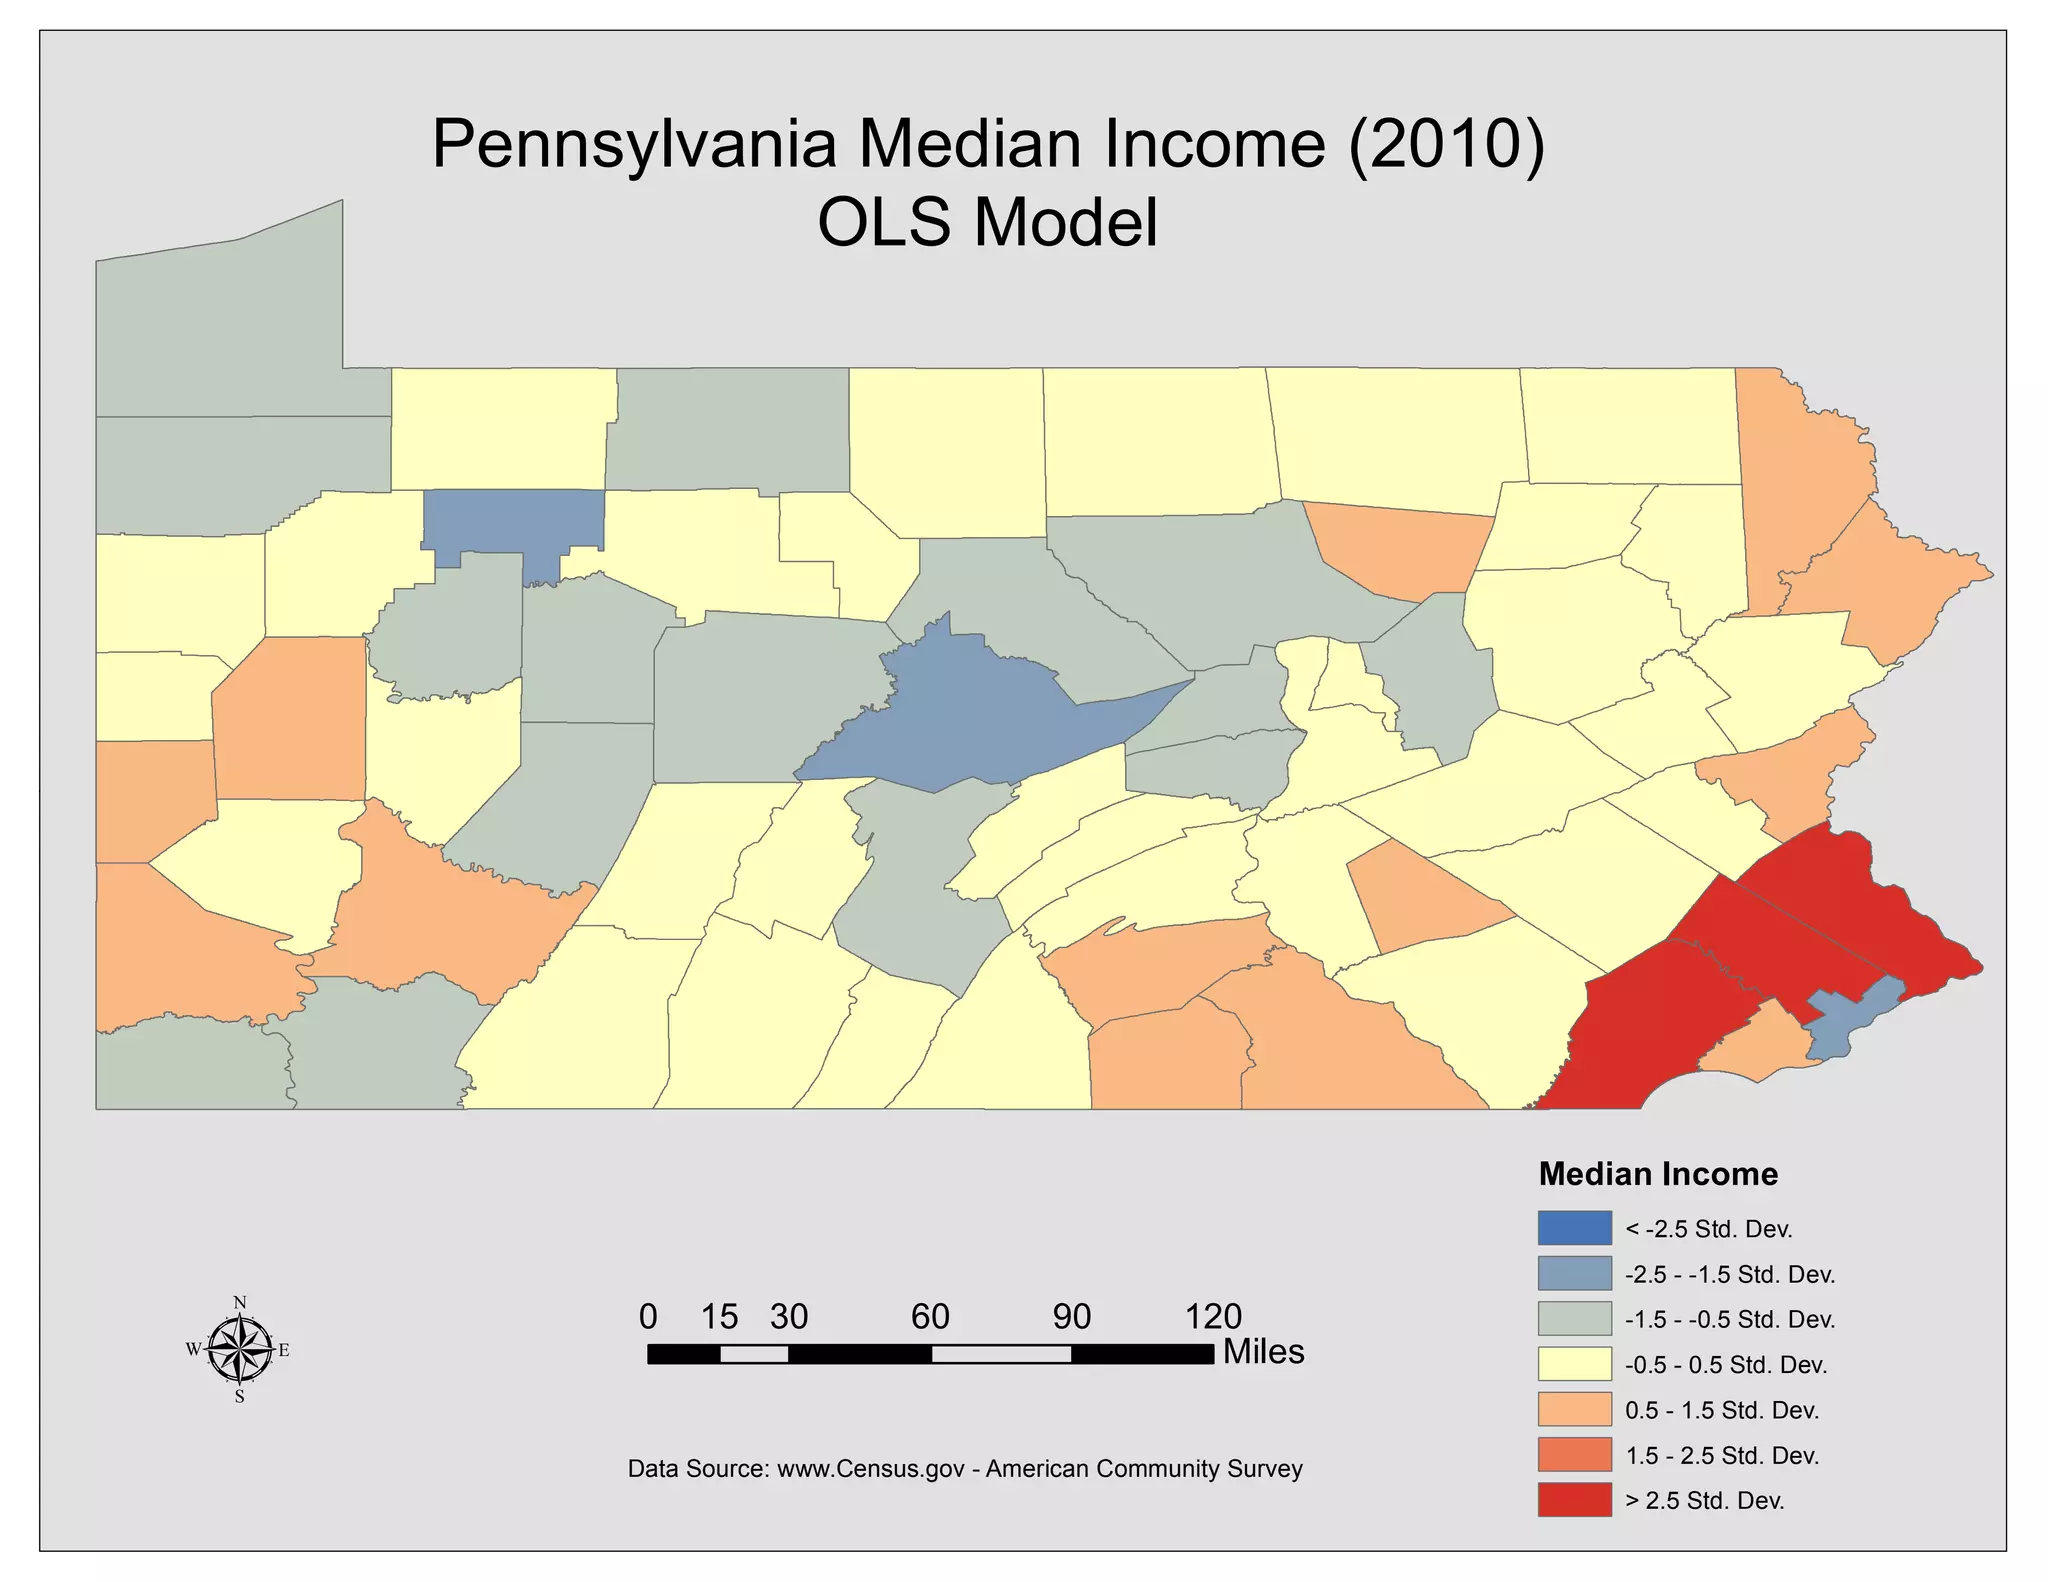
SlideShare a Scribd company logo
1 of 17
Download to read offline
G* Cluster Analysis PA County Income
Income Cluster
Cold Spot - 99% Confidence
Cold Spot - 95% Confidence
Cold Spot - 90% Confidence
Not Significant
Hot Spot - 90% Confidence
Hot Spot - 95% Confidence
Hot Spot - 99% Confidence
. 0 60 12030 Miles
Source: U. S. Census Bureau, American Community Survey, 5-Year Estimates
G* Cluster Analysis PA County 2010 Population
Population Cluster
Cold Spot - 99% Confidence
Cold Spot - 95% Confidence
Cold Spot - 90% Confidence
Not Significant
Hot Spot - 90% Confidence
Hot Spot - 95% Confidence
Hot Spot - 99% Confidence
. 0 60 12030 Miles
Source: U. S. Census Bureau, American Community Survey, 5-Year Estimates
LISA Cluster Analysis PA County Income
Income Cluster
Not Significant
High-High Cluster
High-Low Outlier
Low-High Outlier
Low-Low Cluster
. 0 60 12030 Miles
Source: U. S. Census Bureau, American Community Survey, 5-Year Estimates
PA County 2010 Population
Population
5085 - 101407
101408 - 235406
235407 - 434972
434973 - 799874
799875 - 1526006
® 0 30 60 90 12015
Miles
Data Source: GEOG 675
PA County 2010 Population
Population Standard Deviation
< -0.50 Std. Dev.
-0.50 - 0.50 Std. Dev.
0.50 - 1.5 Std. Dev.
> 1.5 Std. Dev.
® 0 30 60 90 12015
Miles
Data Source: GEOG 675
PA Census Tracts 2010 Population
Census Tracts Population
0 - 2322
2323 - 3544
3545 - 4865
4866 - 6501
6502 - 11497
® 0 30 60 90 12015
Miles
Data Source: GEOG 675
PA Census Tracts 2010 Population
Census Tracts
Population Standard
Deviation
< -1.5 Std. Dev.
-1.5 - -0.50 Std. Dev.
-0.50 - 0.50 Std. Dev.
0.50 - 1.5 Std. Dev.
1.5 - 2.5 Std. Dev.
> 2.5 Std. Dev.
® 0 30 60 90 12015
Miles
Data Source: GEOG 675
Pennsylvania Percent of
Black and Hispanic Population (2010)
Black and Hispanic
% of Pop.
0.01 - 0.03
0.04 - 0.08
0.09 - 0.16
0.17 - 0.26
0.27 - 0.56
µ Data Source: www.Census.gov - American Community Survey
0 30 60 90 12015
Miles
Pennsylvania Percent of Female Households
Without Male Present (2010)
Female Households
No Male Present
% of Pop.
0.02
0.03
0.04
0.05 - 0.06
0.07 - 0.09
µ Data Source: www.Census.gov - American Community Survey
0 30 60 90 12015
Miles
Pennsylvania Median Income (2010)
Median Income
$36,006.00 - $41,557.00
$41,557.01 - $45,960.00
$45,960.01 - $51,965.00
$51,965.01 - $63,677.00
$63,677.01 - $86,264.00
µ Data Source: www.Census.gov - American Community Survey
0 30 60 90 12015
Miles
Pennsylvania Population Over 65 (2010)
Popultion Age 65+
% of Pop.
0.11 - 0.12
0.13 - 0.14
0.15 - 0.17
0.18 - 0.19
0.20 - 0.24
µ Data Source: www.Census.gov - American Community Survey
0 30 60 90 12015
Miles
Pennsylvania Median Income (2010)
OLS Model
Median Income
< -2.5 Std. Dev.
-2.5 - -1.5 Std. Dev.
-1.5 - -0.5 Std. Dev.
-0.5 - 0.5 Std. Dev.
0.5 - 1.5 Std. Dev.
1.5 - 2.5 Std. Dev.
> 2.5 Std. Dev.
µ Data Source: www.Census.gov - American Community Survey
0 30 60 90 12015
Miles
PlanA Roads
PlanB Roads
PlanC Roads
Beach
Chamise Chaparral
Chaparral
Cismontane Alkali Marsh
Coast Live Oak Woodland
Coastal Sage-Chaparral Scrub
Coastal and Valley Freshwater Marsh
Dense Coast Live Oak Woodland
Diegan Coastal Sage Scrub
Disturbed Habitat
Disturbed Wetland
Estuarine
Eucalyptus Woodland
Extensive Agriculture
Freshwater
Freshwater Seep
Intensive Agriculture
Marine Subtidal
Maritime Succulent Scrub
Mule Fat Scrub
Non-Native Grassland
Non-Vegetated Channel, Floodway
Riparian and Bottomland Habitat
Saltpan/Mudflats
Scrub Oak Chaparral
Shallow Bay
Southern Arroyo Willow Riparian Forest
Southern Coast Live Oak Riparian Forest
Southern Coastal Bluff Scrub
Southern Coastal Salt Marsh
Southern Cottonwood-willow Riparian Forest
Southern Foredunes
Southern Maritime Chaparral
Southern Mixed Chaparral
Southern Riparian Forest
Southern Riparian Scrub
Southern Sycamore-alder Riparian Woodland
Southern Willow Scrub
Urban/Developed
Valley Needlegrass Grassland
Valley and Foothill Grassland
µProduced by: Chad Yowler 2016
0 1 2 3 40.5
Miles
Vegetation Analysis Map
for Road Implementation Plan Model
0 4 8 12
Miles
Iron Contamination Amount
at Select Sampling Locations, Blacklick Creek Watershed
Iron Contamination Amount
Streams
< than 100 lbs./day
100-200 lbs./day
200-1000 lbs./day
>1000 lbs./day
/
Data Source: IUP Dept. of Geograpahy & Regional Planning
Blacklick Creek Watershed Comprehensive Plan
Chad Yowler
10/20/14
Leonhard Hall, IUP
Low pH Samples
Occurrences
1
2 - 3
4 - 5
6 - 10
11 - 23
24 - 44
No Results
Blacklick Creek Low pH Sampling Locations
±0 8 164
Miles
Produced By: Chad Yowler
^_
^_
#*
#*
#*
#*
#*
#*
#*#*
#*
#*
#*
#*
#*
#* #*
#*
#*
#*
#*
Salem
Olympia
Baker
Rainier
Glacier Peak
Belknap
Hood
St. Helens
6
12
13
5
9
36
PacificOcean
Legend
Known Eruptions
#* 1
#* 5
#* 10
Counties
People per sq mile
0.70 - 46
47 - 160
170 - 450
460 - 840
850 - 1,600
Highways
Interstate
Freeway
Arterial
Unclassified
^_ State Capitals
Rivers
States
0 50 100 15025
Miles ®
Pacific Northwest
Volcanic Hazards
by Chad Yowler
ESRI Data and Maps
[Download]. (2010) Redlands,
CA: ESRI [October, 2012].

More Related Content

Similar to WorkSample

Community Document Information Packet 1.20.14
Community Document Information Packet 1.20.14Community Document Information Packet 1.20.14
Community Document Information Packet 1.20.14
Valerie LeBoeuf
 
Aisa 2013 deweaverpm
Aisa 2013 deweaverpmAisa 2013 deweaverpm
Aisa 2013 deweaverpm
gdnmaximus
 

Similar to WorkSample (13)

2018 community data book part 1
2018 community data book part 12018 community data book part 1
2018 community data book part 1
 
2017 State of the Community Report
2017 State of the Community Report2017 State of the Community Report
2017 State of the Community Report
 
Leadership 2019 Session #3 "History and Governance" with Chamber President an...
Leadership 2019 Session #3 "History and Governance" with Chamber President an...Leadership 2019 Session #3 "History and Governance" with Chamber President an...
Leadership 2019 Session #3 "History and Governance" with Chamber President an...
 
WFRC Plan Summary
WFRC Plan SummaryWFRC Plan Summary
WFRC Plan Summary
 
Montana Snow Survey Data
Montana Snow Survey Data Montana Snow Survey Data
Montana Snow Survey Data
 
Orange County's Housing Crisis
Orange County's Housing CrisisOrange County's Housing Crisis
Orange County's Housing Crisis
 
Leadership 2023, Session 3 - History, Geography, and Governance
Leadership 2023, Session 3 - History, Geography, and GovernanceLeadership 2023, Session 3 - History, Geography, and Governance
Leadership 2023, Session 3 - History, Geography, and Governance
 
Gcwa resighting 2014
Gcwa resighting 2014Gcwa resighting 2014
Gcwa resighting 2014
 
Leadership 2022, Session 3 - History, Geography, and Governance
Leadership 2022, Session 3 - History, Geography, and GovernanceLeadership 2022, Session 3 - History, Geography, and Governance
Leadership 2022, Session 3 - History, Geography, and Governance
 
Community Document Information Packet 1.20.14
Community Document Information Packet 1.20.14Community Document Information Packet 1.20.14
Community Document Information Packet 1.20.14
 
2020 State of the Community Report
2020 State of the Community Report2020 State of the Community Report
2020 State of the Community Report
 
Aisa 2013 deweaverpm
Aisa 2013 deweaverpmAisa 2013 deweaverpm
Aisa 2013 deweaverpm
 
2021 State of the Community Report Presentation
2021 State of the Community Report Presentation2021 State of the Community Report Presentation
2021 State of the Community Report Presentation
 

WorkSample

  • 1. G* Cluster Analysis PA County Income Income Cluster Cold Spot - 99% Confidence Cold Spot - 95% Confidence Cold Spot - 90% Confidence Not Significant Hot Spot - 90% Confidence Hot Spot - 95% Confidence Hot Spot - 99% Confidence . 0 60 12030 Miles Source: U. S. Census Bureau, American Community Survey, 5-Year Estimates
  • 2. G* Cluster Analysis PA County 2010 Population Population Cluster Cold Spot - 99% Confidence Cold Spot - 95% Confidence Cold Spot - 90% Confidence Not Significant Hot Spot - 90% Confidence Hot Spot - 95% Confidence Hot Spot - 99% Confidence . 0 60 12030 Miles Source: U. S. Census Bureau, American Community Survey, 5-Year Estimates
  • 3. LISA Cluster Analysis PA County Income Income Cluster Not Significant High-High Cluster High-Low Outlier Low-High Outlier Low-Low Cluster . 0 60 12030 Miles Source: U. S. Census Bureau, American Community Survey, 5-Year Estimates
  • 4. PA County 2010 Population Population 5085 - 101407 101408 - 235406 235407 - 434972 434973 - 799874 799875 - 1526006 ® 0 30 60 90 12015 Miles Data Source: GEOG 675
  • 5. PA County 2010 Population Population Standard Deviation < -0.50 Std. Dev. -0.50 - 0.50 Std. Dev. 0.50 - 1.5 Std. Dev. > 1.5 Std. Dev. ® 0 30 60 90 12015 Miles Data Source: GEOG 675
  • 6. PA Census Tracts 2010 Population Census Tracts Population 0 - 2322 2323 - 3544 3545 - 4865 4866 - 6501 6502 - 11497 ® 0 30 60 90 12015 Miles Data Source: GEOG 675
  • 7. PA Census Tracts 2010 Population Census Tracts Population Standard Deviation < -1.5 Std. Dev. -1.5 - -0.50 Std. Dev. -0.50 - 0.50 Std. Dev. 0.50 - 1.5 Std. Dev. 1.5 - 2.5 Std. Dev. > 2.5 Std. Dev. ® 0 30 60 90 12015 Miles Data Source: GEOG 675
  • 8. Pennsylvania Percent of Black and Hispanic Population (2010) Black and Hispanic % of Pop. 0.01 - 0.03 0.04 - 0.08 0.09 - 0.16 0.17 - 0.26 0.27 - 0.56 µ Data Source: www.Census.gov - American Community Survey 0 30 60 90 12015 Miles
  • 9. Pennsylvania Percent of Female Households Without Male Present (2010) Female Households No Male Present % of Pop. 0.02 0.03 0.04 0.05 - 0.06 0.07 - 0.09 µ Data Source: www.Census.gov - American Community Survey 0 30 60 90 12015 Miles
  • 10. Pennsylvania Median Income (2010) Median Income $36,006.00 - $41,557.00 $41,557.01 - $45,960.00 $45,960.01 - $51,965.00 $51,965.01 - $63,677.00 $63,677.01 - $86,264.00 µ Data Source: www.Census.gov - American Community Survey 0 30 60 90 12015 Miles
  • 11. Pennsylvania Population Over 65 (2010) Popultion Age 65+ % of Pop. 0.11 - 0.12 0.13 - 0.14 0.15 - 0.17 0.18 - 0.19 0.20 - 0.24 µ Data Source: www.Census.gov - American Community Survey 0 30 60 90 12015 Miles
  • 12. Pennsylvania Median Income (2010) OLS Model Median Income < -2.5 Std. Dev. -2.5 - -1.5 Std. Dev. -1.5 - -0.5 Std. Dev. -0.5 - 0.5 Std. Dev. 0.5 - 1.5 Std. Dev. 1.5 - 2.5 Std. Dev. > 2.5 Std. Dev. µ Data Source: www.Census.gov - American Community Survey 0 30 60 90 12015 Miles
  • 13. PlanA Roads PlanB Roads PlanC Roads Beach Chamise Chaparral Chaparral Cismontane Alkali Marsh Coast Live Oak Woodland Coastal Sage-Chaparral Scrub Coastal and Valley Freshwater Marsh Dense Coast Live Oak Woodland Diegan Coastal Sage Scrub Disturbed Habitat Disturbed Wetland Estuarine Eucalyptus Woodland Extensive Agriculture Freshwater Freshwater Seep Intensive Agriculture Marine Subtidal Maritime Succulent Scrub Mule Fat Scrub Non-Native Grassland Non-Vegetated Channel, Floodway Riparian and Bottomland Habitat Saltpan/Mudflats Scrub Oak Chaparral Shallow Bay Southern Arroyo Willow Riparian Forest Southern Coast Live Oak Riparian Forest Southern Coastal Bluff Scrub Southern Coastal Salt Marsh Southern Cottonwood-willow Riparian Forest Southern Foredunes Southern Maritime Chaparral Southern Mixed Chaparral Southern Riparian Forest Southern Riparian Scrub Southern Sycamore-alder Riparian Woodland Southern Willow Scrub Urban/Developed Valley Needlegrass Grassland Valley and Foothill Grassland µProduced by: Chad Yowler 2016 0 1 2 3 40.5 Miles Vegetation Analysis Map for Road Implementation Plan Model
  • 14.
  • 15. 0 4 8 12 Miles Iron Contamination Amount at Select Sampling Locations, Blacklick Creek Watershed Iron Contamination Amount Streams < than 100 lbs./day 100-200 lbs./day 200-1000 lbs./day >1000 lbs./day / Data Source: IUP Dept. of Geograpahy & Regional Planning Blacklick Creek Watershed Comprehensive Plan Chad Yowler 10/20/14 Leonhard Hall, IUP
  • 16. Low pH Samples Occurrences 1 2 - 3 4 - 5 6 - 10 11 - 23 24 - 44 No Results Blacklick Creek Low pH Sampling Locations ±0 8 164 Miles Produced By: Chad Yowler
  • 17. ^_ ^_ #* #* #* #* #* #* #*#* #* #* #* #* #* #* #* #* #* #* #* Salem Olympia Baker Rainier Glacier Peak Belknap Hood St. Helens 6 12 13 5 9 36 PacificOcean Legend Known Eruptions #* 1 #* 5 #* 10 Counties People per sq mile 0.70 - 46 47 - 160 170 - 450 460 - 840 850 - 1,600 Highways Interstate Freeway Arterial Unclassified ^_ State Capitals Rivers States 0 50 100 15025 Miles ® Pacific Northwest Volcanic Hazards by Chad Yowler ESRI Data and Maps [Download]. (2010) Redlands, CA: ESRI [October, 2012].