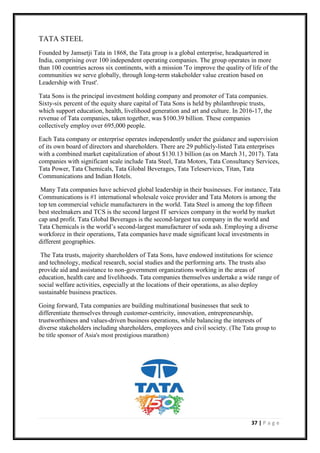
This document provides background information on Tata Steel Limited, including its history, mission, vision, leadership, and the history of the Indian steel industry. Tata Steel was founded in 1907 and is India's largest steel company. It has manufacturing operations in 26 countries and employs over 80,000 people. The company aims to be a global benchmark in value creation and corporate citizenship through excellence, innovation, and social responsibility. The Indian steel industry has grown significantly over the past decades and India is now the 4th largest steel producer globally.


![38 | P a g e
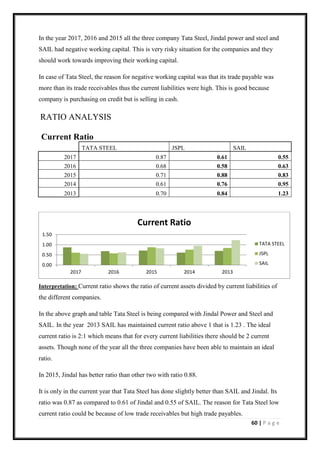
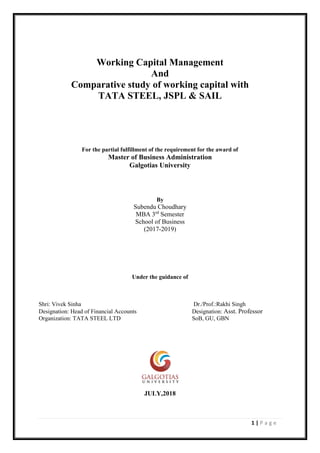
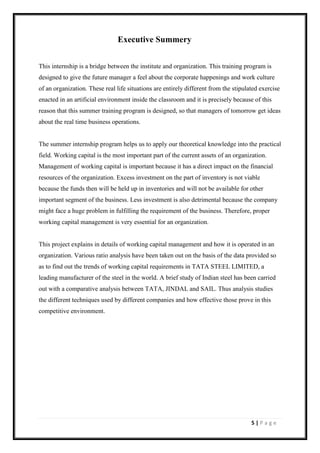
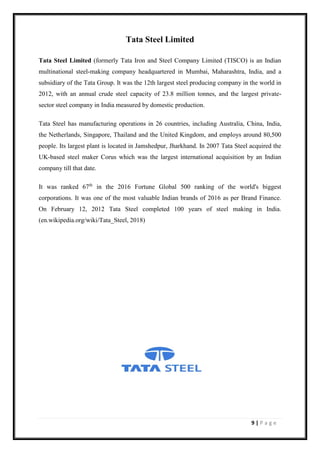
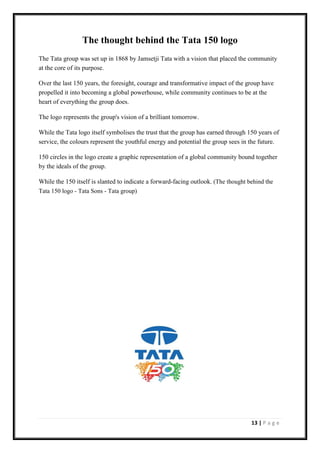
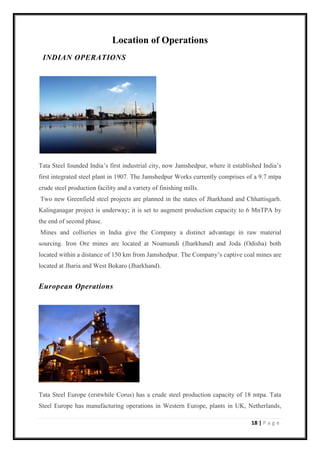
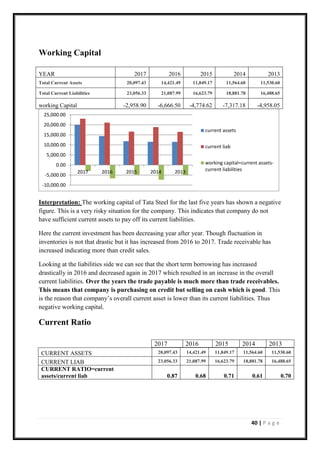
Balance sheet TATA STEEL
2017 2016 2015 2014 2013
ASSETS
NON-CURRENT ASSETS
Tangible Assets 71,778.97 24,901.24 25,071.38 24,064.43 24,650.54
Intangible Assets 788.18 527.35 177.14 201.32 224.51
Capital Work-In-Progress 6,125.35 26,982.37 23,036.67 18,509.40 8,722.29
Intangible Assets Under Development 38.61 0 0 0 0
Fixed Assets 78,731.11 52,410.96 48,285.19 42,775.15 33,597.34
Non-Current Investments 8,355.90 52,360.42 52,164.24 52,318.56 49,984.80
Long Term Loans And Advances 211.97 3,787.88 3,166.77 4,080.07 6,574.15
Other Non-Current Assets 4,069.00 227.4 211.75 302.03 190.04
Total Non-Current Assets 91,367.98 108,786.66 103,827.95 99,475.81 90,346.33
CURRENT ASSETS
Current Investments 5,309.81 4,320.17 1,000.08 2,343.24 434
Inventories 10,236.85 7,083.81 8,042.00 6,007.81 5,257.94
Trade Receivables 2,006.52 632.8 491.46 770.81 796.92
Cash And Cash Equivalents 970.31 1,014.67 478.59 961.16 2,218.11
Short Term Loans And Advances 27.14 1,243.48 1,781.77 1,299.20 2,207.83
Other Current Assets 1,546.80 126.56 55.27 182.38 615.8
Total Current Assets 20,097.43 14,421.49 11,849.17 11,564.60 11,530.60
Total Assets 111,465.41 123,208.15 115,677.12 111,040.41 101,876.93
EQUITIES AND LIABILITIES
SHAREHOLDER'S FUNDS
Equity Share Capital 971.41 971.41 971.41 971.41 971.41
Total Share Capital 971.41 971.41 971.41 971.41 971.41
Reserves and Surplus 48,687.60 69,505.31 65,692.48 60,176.58 54,238.27
Total Reserves and Surplus 48,687.60 69,505.31 65,692.48 60,176.58 54,238.27
Total Shareholders Funds 49,659.01 70,476.72 66,663.89 61,147.99 55,209.68
Hybrid/Debt/Other Securities 2,275.00 2,275.00 2,275.00 2,275.00 2,275.00
NON-CURRENT LIABILITIES
Long Term Borrowings 24,694.37 23,457.77 23,900.37 23,808.09 23,565.57
Deferred Tax Liabilities [Net] 6,111.27 2,179.83 2,250.41 2,038.98 1,843.74
Other Long Term Liabilities 3,644.69 842.66 1,087.74 983.52 380.87
Long Term Provisions 2,024.74 2,888.18 2,875.92 1,905.05 2,113.42
Total Non-Current Liabilities 36,475.07 29,368.44 30,114.44 28,735.64 27,903.60
CURRENT LIABILITIES
Short Term Borrowings 3,239.67 5,261.02 34.88 43.69 70.94
Trade Payables 10,717.44 7,706.13 5,801.98 8,263.61 6,369.91
Other Current Liabilities 8,398.62 6,115.81 9,111.52 8,671.67 8,503.54
Short Term Provisions 700.6 2,005.03 1,675.41 1,902.81 1,544.26
Total Current Liabilities 23,056.33 21,087.99 16,623.79 18,881.78 16,488.65
Total Capital And Liabilities 111,465.41 123,208.15 115,677.12 111,040.41 101,876.93
(www.moneycontrol.com/financials/tatasteel/balance-sheet/TIS)](https://image.slidesharecdn.com/subendusipreport5-180819122809/85/working-capital-management-38-320.jpg)
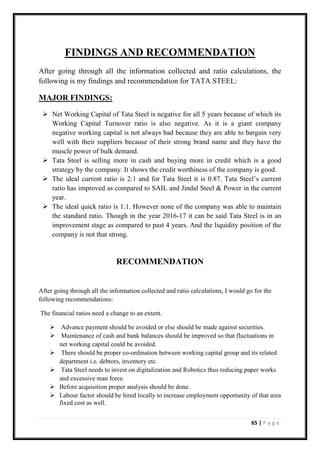
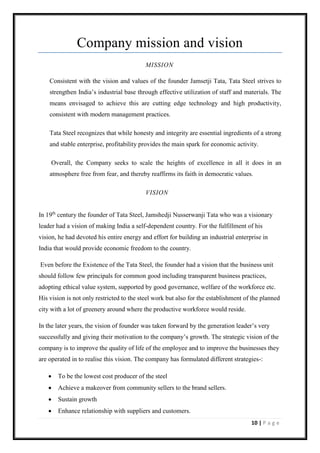
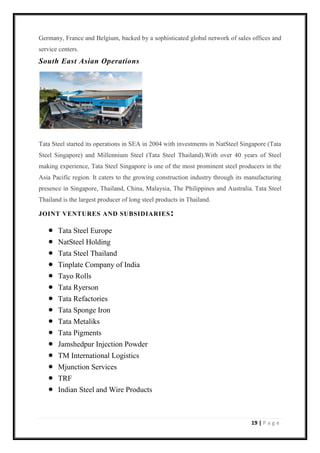
![39 | P a g e
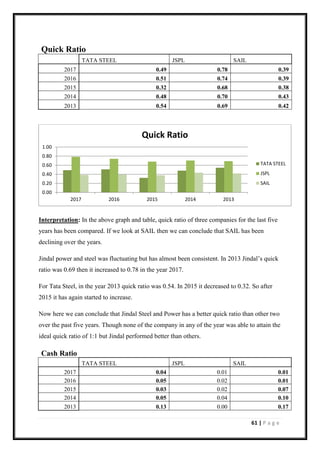
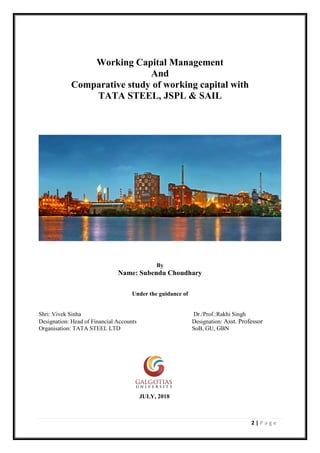
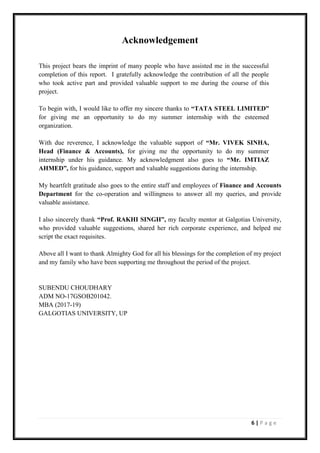
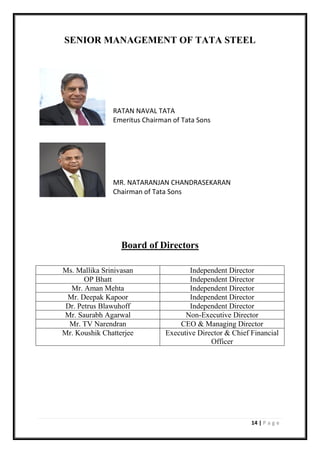
(www.moneycontrol.com/financials/tatasteel/profit-lossVI/TIS#TIS)
profit and loss of TATA STEEL
2017 2016 2015 2014 2013
INCOME
Revenue From Operations [Gross] 52,564.93 42,290.64 46,226.08 45,869.55 41,843.27
Less: Excise/Sevice Tax/Other Levies 5,267.94 4,475.95 4,792.26 4,598.31 4,117.81
Revenue From Operations [Net] 47,296.99 37,814.69 41,433.82 41,271.24 37,725.46
Other Operating Revenues 696.03 395.65 351.18 439.79 473.97
I Total Operating Revenues 47,993.02 38,210.34 41,785.00 41,711.03 38,199.43
II Other Income 414.46 3,890.70 582.78 787.64 902.04
III Total Revenue 48,407.48 42,101.04 42,367.78 42,498.67 39,101.47
IV EXPENSES
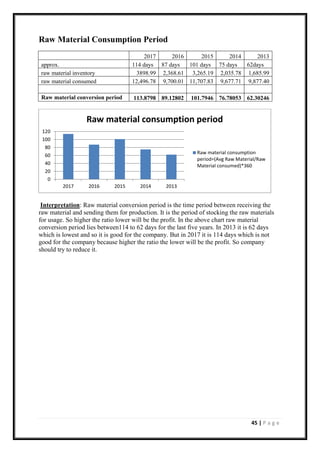
a Cost Of Materials Consumed 12,496.78 9,700.01 11,707.83 9,677.71 9,877.40
b Purchase Of Stock-In Trade 881.18 991.54 688.32 352.63 453.34
c Changes In Inventories Of FG,WIP And Stock-In Trade -1,329.65 142.97 -745.17 -155.18 -404.6
d Employee Benefit Expenses 4,605.13 4,324.90 4,601.92 3,673.08 3,608.52
e Finance Costs 2,688.55 1,460.27 1,975.95 1,820.58 1,876.77
f Depreciation And Amortisation Expenses 3,541.55 1,933.11 1,997.59 1,928.70 1,640.38
g Other Expenses 19,681.15 16,438.06 16,109.99 16,375.81 14,414.66
Less: Amounts Transfer To Capital Accounts 217.52 598.89 586.69 1,029.92 876.13
Total Expenses 42,347.17 34,391.97 35,749.74 32,643.41 30,590.34
V Profit/Loss Before Exceptional, ExtraOrdinary
Items And Tax(III-IV)
6,060.31 7,709.07 6,618.04 9,855.26 8,511.13
VI Exceptional Items -703.38 -1,582.55 1,890.85 -141.76 -674.53
VII Profit/Loss Before Tax
5,356.93 6,126.52 8,508.89 9,713.50 7,836.60
VIII Tax Expenses-Continued Operations
a Current Tax 1,400.54 1,433.06 1,908.60 3,098.02 1,770.54
b Less: MAT Credit Entitlement 0 152.17 117.21 0 399.84
c Deferred Tax 511.84 -55.32 278.38 203.29 1,402.93
IX Total Tax Expenses 1,912.38 1,225.57 2,069.77 3,301.31 2,773.63
X Profit/Loss For The Period(VII-IX) 3,444.55 4,900.95 6,439.12 6,412.19 5,062.97](https://image.slidesharecdn.com/subendusipreport5-180819122809/85/working-capital-management-39-320.jpg)
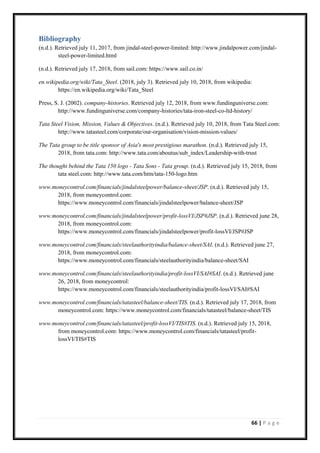
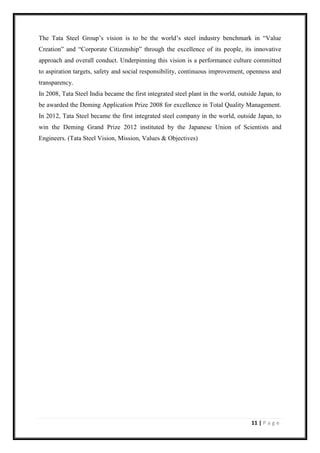
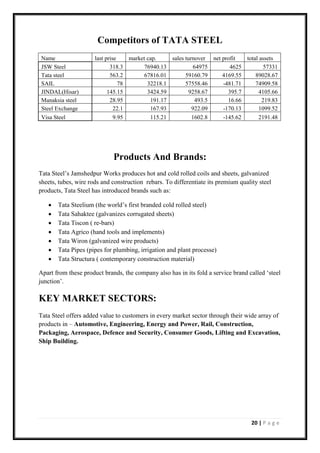
![47 | P a g e
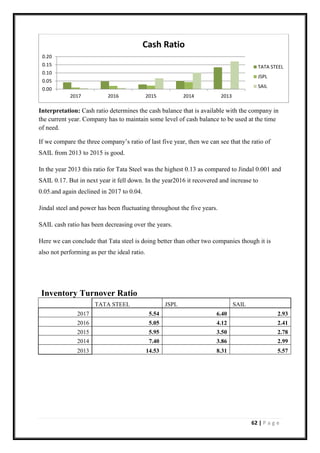
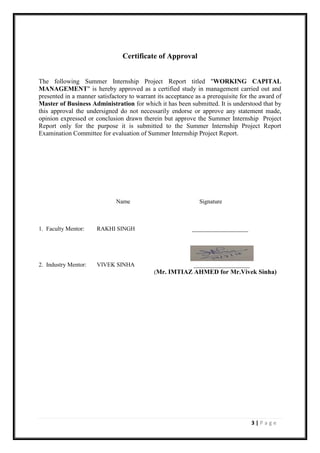
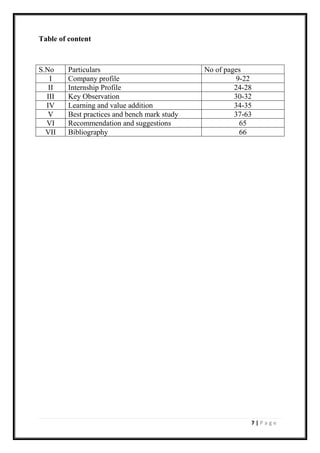
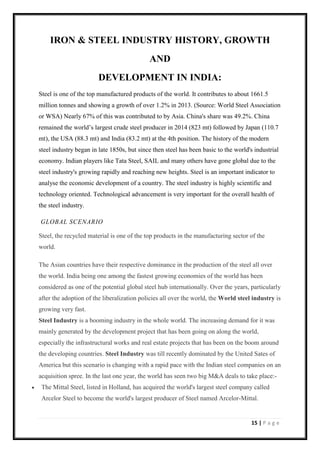
Balance Sheet of Jindal Steel & Power
2017 2016 2015 2014 2013
ASSETS
NON-CURRENT ASSETS
Tangible Assets 41,402.38 42,939.94 27,134.69 18,192.32 14,142.18
Intangible Assets 73.5 83.37 80.39 67.01 14.01
Capital Work-In-Progress 7,504.65 5,652.99 3,532.77 11,640.25 11,466.12
Intangible Assets Under Development 24.58 32.75 30.35 22.92 17.82
Other Assets 0.14 0.14 0 0 0
Fixed Assets 49,005.25 48,709.19 30,778.20 29,922.50 25,640.13
Non-Current Investments 1,485.25 1,476.94 1,486.96 1,350.52 1,330.72
Long Term Loans And Advances 0 0 2,315.91 1,615.71 1,225.46
Other Non-Current Assets 882.19 965.25 1.08 0.63 0.55
Total Non-Current Assets 51,372.69 51,151.38 34,582.15 32,889.36 28,196.86
CURRENT ASSETS
Current Investments 0 0 1,000.00 0 0
Inventories 1,886.97 2,439.06 3,720.03 3,936.25 3,598.52
Trade Receivables 797.2 830.86 1,321.27 1,460.96 1,426.13
Cash And Cash Equivalents 146.17 331.94 288.97 762 36.77
Short Term Loans And Advances 787.5 804.01 4,504.04 6,543.65 5,943.54
Other Current Assets 5,126.28 5,039.50 753.77 557.44 608.11
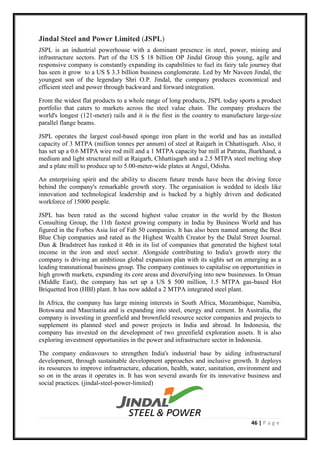
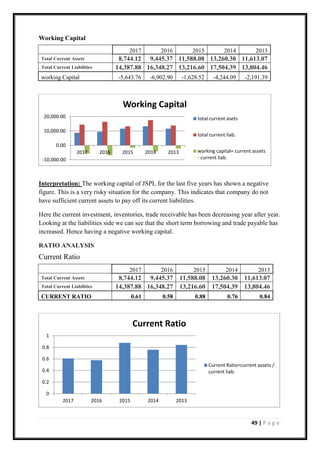
Total Current Assets 8,744.12 9,445.37 11,588.08 13,260.30 11,613.07
Total Assets 60,116.81 60,596.75 46,170.23 46,149.66 39,809.93
EQUITIES AND LIABILITIES
SHAREHOLDER'S FUNDS
Equity Share Capital 91.5 91.49 91.49 91.49 93.48
Total Share Capital 91.5 91.49 91.49 91.49 93.48
Reserves and Surplus 21,674.70 22,974.18 12,419.72 12,972.84 12,254.59
Total Reserves and Surplus 21,674.70 22,974.18 12,419.72 12,972.84 12,254.59
Total Share holders Funds 21,766.20 23,065.67 12,511.21 13,064.33 12,348.07
NON-CURRENT LIABILITIES
Long Term Borrowings 16,403.88 16,411.57 18,507.42 13,520.78 11,860.92
Deferred Tax Liabilities [Net] 3,983.63 4,452.73 1,658.59 1,345.46 1,214.96
Other Long Term Liabilities 3,537.62 290.7 244.52 695.11 560.58
Long Term Provisions 37.6 27.81 31.89 19.59 20.94
Total Non-Current Liabilities 23,962.73 21,182.81 20,442.42 15,580.94 13,657.40
CURRENT LIABILITIES
Short Term Borrowings 7,759.46 7,503.47 7,607.63 9,146.13 7,640.02
Trade Payables 2,387.56 1,947.84 1,443.02 1,637.34 628.2
Other Current Liabilities 4,202.31 6,858.49 4,073.07 3,454.95 2,584.39
Short Term Provisions 38.55 38.47 92.88 3,265.97 2,951.85
Total Current Liabilities 14,387.88 16,348.27 13,216.60 17,504.39 13,804.46
Total Capital And Liabilities 60,116.81 60,596.75 46,170.23 46,149.66 39,809.93
(www.moneycontrol.com/financials/jindalsteelpower/balance-sheet/JSP)](https://image.slidesharecdn.com/subendusipreport5-180819122809/85/working-capital-management-47-320.jpg)
![48 | P a g e
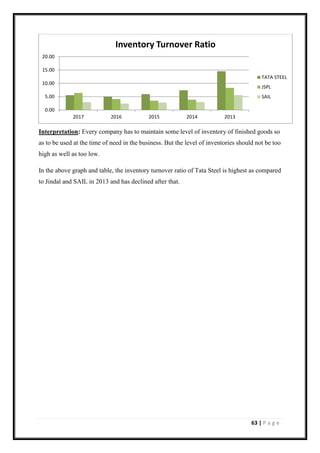
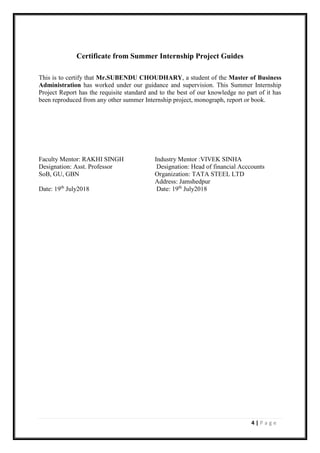
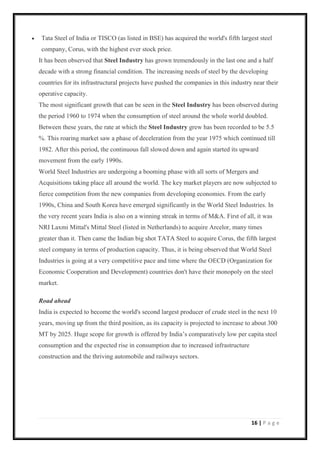
Profit & Loss account of Jindal Steel & Power
2017 2016 2015 2014 2013
INCOME
Revenue From Operations [Gross] 15,064.39 14,465.77 14,543.67 16,209.17 16,729.82
Less: Excise/Sevice Tax/Other Levies 1,645.51 1,996.90 1,261.38 1,780.44 1,931.14
Revenue From Operations [Net] 13,418.88 12,468.87 13,282.29 14,428.73 14,798.68
Other Operating Revenues 429.22 227.57 108.06 115.29 156.02
I Total Operating Revenues 13,848.10 12,696.44 13,390.35 14,544.02 14,954.70
II Other Income 8.88 23.47 296.44 146.85 159.28
III Total Revenue 13,856.98 12,719.91 13,686.79 14,690.87 15,113.98
IV EXPENSES
a Cost Of Materials Consumed 5,026.65 5,070.99 4,371.56 4,265.71 4,943.30
b Purchase Of Stock-In Trade 132.04 241.36 284.69 273.31 286.58
c Changes In Inventories Of FG,WIP And Stock-In
Trade
332.3 296.53 -153.72 386.03 -148.2
d Employee Benefit Expenses 531.6 553.82 650.52 552.32 447.89
e Finance Costs 2,280.40 2,646.48 2,048.20 1,083.63 820.77
f Depreciation And Amortisation Expenses 2,043.65 2,148.14 1,785.56 1,221.44 1,048.46
g Other Expenses 5,568.39 5,166.48 5,240.64 5,307.79 5,486.68
Less: Inter Unit / Segment / Division Transfer 601.07 1,073.82 709.02 0 0
Total Expenses 15,313.96 15,049.98 13,518.43 13,090.23 12,885.48
V Profit/Loss Before Exceptional, ExtraOrdinary
Items And Tax (III-IV)
-1,456.98 -2,330.07 168.36 1,600.64 2,228.50
VI Exceptional Items
0 0 -807.77 0 0
VII Profit/Loss Before Tax -1,456.98 -2,330.07 -639.41 1,600.64 2,228.50
VIII Tax Expenses-Continued Operations
Current Tax 0 0 0 308.2 488.8
Less: MAT Credit Entitlement 0 0 665 130.01 0
Deferred Tax -470.53 -911.54 369.53 0 147.15
Other Direct Taxes 0 0 0 130.5 0
Tax For Earlier Years 0 0 -33.26 0 0
Total Tax Expenses -470.53 -911.54 -328.73 308.69 635.95
Profit/Loss For The Period(VII-IX) -986.45 -1,418.53 -310.68 1,291.95 1,592.55
(www.moneycontrol.com/financials/jindalsteelpower/profit-lossVI/JSP#JSP)](https://image.slidesharecdn.com/subendusipreport5-180819122809/85/working-capital-management-48-320.jpg)
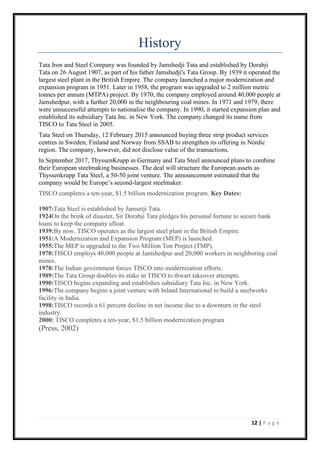
![54 | P a g e
Balance Sheet of Steel Authority of India
2017 2016 2015 2014 2013
ASSETS
NON-CURRENT ASSETS
Tangible Assets 48,762.03 44,378.87 34,658.40 25,256.52 15,234.63
Intangible Assets 1,522.58 1,546.20 1,510.21 1,514.13 1,542.77
Capital Work-In-Progress 23,275.39 24,927.22 29,195.82 33,650.54 35,890.85
Other Assets 0.86 0.88 0 0 0
Fixed Assets 73,560.86 70,853.17 65,364.43 60,421.19 52,668.25
Non-Current Investments 1,395.48 1,291.75 919.07 720.2 718.36
Deferred Tax Assets [Net] 4,005.84 1,799.80 0 0 0
Long Term Loans And Advances 453.52 449.95 4,507.25 3,794.32 3,165.17
Other Non-Current Assets 1,561.22 1,746.95 53.83 135.43 50.7
Total Non-Current Assets 80,976.92 76,141.62 70,844.58 65,071.14 56,602.48
CURRENT ASSETS
Inventories 15,711.35 14,679.53 17,736.37 15,200.82 16,008.21
Trade Receivables 2,921.69 3,143.49 3,192.00 5,481.98 4,424.18
Cash And Cash Equivalents 289.09 297.96 2,305.24 2,855.95 3,850.35
Short Term Loans And Advances 61.47 64.09 3,056.33 1,160.51 990.69
OtherCurrentAssets 6,578.95 6,013.58 2,192.35 2,191.49 2,342.55
Total Current Assets 25,550.61 24,178.06 28,482.29 26,890.75 27,615.98
Total Assets 106539.47 100340.27 99,326.87 91,961.89 84,218.46
EQUITIES AND LIABILITIES
SHAREHOLDER'S FUNDS
Equity Share Capital 4,130.53 4,130.53 4,130.53 4,130.53 4,130.53
Total Share Capital 4,130.53 4,130.53 4,130.53 4,130.53 4,130.53
Reserves and Surplus 31,878.53 35,065.37 39,374.25 38,535.82 36,894.11
Total Reserves and Surplus 31,878.53 35,065.37 39,374.25 38,535.82 36,894.11
Total Shareholders Funds 36,009.06 39,195.90 43,504.78 42,666.35 41,024.64
NON-CURRENT LIABILITIES
Long Term Borrowings 19,087.48 17,495.71 14,025.56 13,632.22 13,485.55
Deferred Tax Liabilities [Net] 0 0 2,395.19 2,040.46 1,728.53
Other Long Term Liabilities 1,524.58 1,692.13 1,239.22 1,381.30 1,271.12
Long Term Provisions 3,593.94 3,271.65 3,705.34 3,901.28 4,204.16
Total Non-Current Liabilities 24,206.00 22,459.49 21,365.31 20,955.26 20,689.36
CURRENT LIABILITIES
Short Term Borrowings 19,813.04 15,574.86 14,195.16 10,634.48 8,015.02
Trade Payables 5,219.20 4,002.71 3,606.38 3,205.34 3,322.04
Other Current Liabilities 18,377.40 16,464.66 14,016.53 12,478.51 8,654.70
Short Term Provisions 2,914.77 2,642.65 2,638.71 2,021.95 2,512.70
Total Current Liabilities 46,324.41 38,684.88 34,456.78 28,340.28 22,504.46
Total Capital And Liabilities 106539.47 100340.27 99,326.87 91,961.89 84,218.46
(www.moneycontrol.com/financials/steelauthorityindia/balance-sheet/SAI)](https://image.slidesharecdn.com/subendusipreport5-180819122809/85/working-capital-management-54-320.jpg)
![55 | P a g e
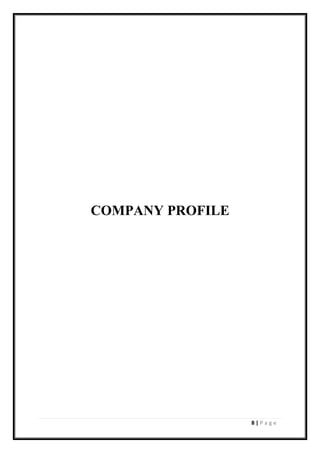
Profit & Loss account of Steel Authority of India
2017 2016 2015 2014 2013
INCOME
Revenue From Operations [Gross] 49,212.13 43,327.50 50,650.76 51,891.90 49,384.57
Less: Excise/Sevice Tax/Other Levies 5,314.69 4,823.29 5,418.60 5,677.29 5,388.64
Revenue From Operations [Net] 43,897.44 38,504.21 45,232.16 46,214.61 43,995.93
Other Operating Revenues 554.97 547.67 478.62 483.8 602.33
I Total Operating Revenues 44,452.41 39,051.88 45,710.78 46,698.41 44,598.26
II Other Income 535.61 594.67 1,020.78 881.41 964.44
III Total Revenue 44,988.02 39,646.55 46,731.56 47,579.82 45,562.70
IV EXPENSES
a Cost Of Materials Consumed 21,125.70 17,155.23 18,522.90 19,271.16 21,198.48
b Purchase Of Stock-In Trade 0 0 0.48 0.78 3.21
c Changes In Inventories Of FG,WIP And
Stock-In Trade
120.63 540.61 -1,408.12 894.63 -2,016.09
d Employee Benefit Expenses 8,947.83 9,714.97 9,736.33 9,578.51 8,637.20
e Finance Costs 2,527.82 2,300.45 1,454.23 967.64 747.66
f Depreciation And Amortisation Expenses 2,679.95 2,402.35 1,773.28 1,716.69 1,402.98
g Other Expenses 14,220.21 14,540.44 14,205.32 13,035.06 12,160.81
Total Expenses 49,622.14 46,654.05 44,284.42 45,464.47 42,134.25
V Profit/Loss Before Exceptional,
ExtraOrdinary Items And Tax
-4,634.12 -7,007.50 2,447.14 2,115.35 3,428.45
VI Exceptional Items -216.74 0 0 959.12 -229.32
VII Profit/Loss Before Tax -4,850.86 -7,007.50 2,447.14 3,074.47 3,199.13
VIII Tax Expenses-Continued Operations
a Current Tax 0 0 499.15 683.26 1,057.96
b Less: MAT Credit Entitlement 0 0 499.15 520.11 0
c Deferred Tax -2,032.76 -2,909.55 282.76 331.97 12.44
d Tax For Earlier Years 15.14 -76.51 -16.53 112.95 -0.09
IX Total Tax Expenses -2,017.62 -2,986.06 266.23 608.07 1,070.31
X Profit/Loss For The Period(VII-IX) -2,833.24 -4,021.44 2,092.68 2,616.48 2,170.35
(www.moneycontrol.com/financials/steelauthorityindia/profit-lossVI/SAI#SAI)](https://image.slidesharecdn.com/subendusipreport5-180819122809/85/working-capital-management-55-320.jpg)