This document provides an overview and analysis of Steel Authority of India Limited (SAIL). It discusses SAIL's profile as India's largest steel producer, with integrated and special steel plants located across India. It outlines SAIL's products, marketing network, research centers, and position in the domestic steel industry. It also presents a SWOT analysis, identifying SAIL's strengths as its diversified product mix, large captive iron ore operations, skilled workforce, and research center, and weaknesses as dependence on imported coking coal and higher-than-average manpower costs. The document serves as the basis for a comparative financial analysis of SAIL against other Indian steel companies.
![Page | 32
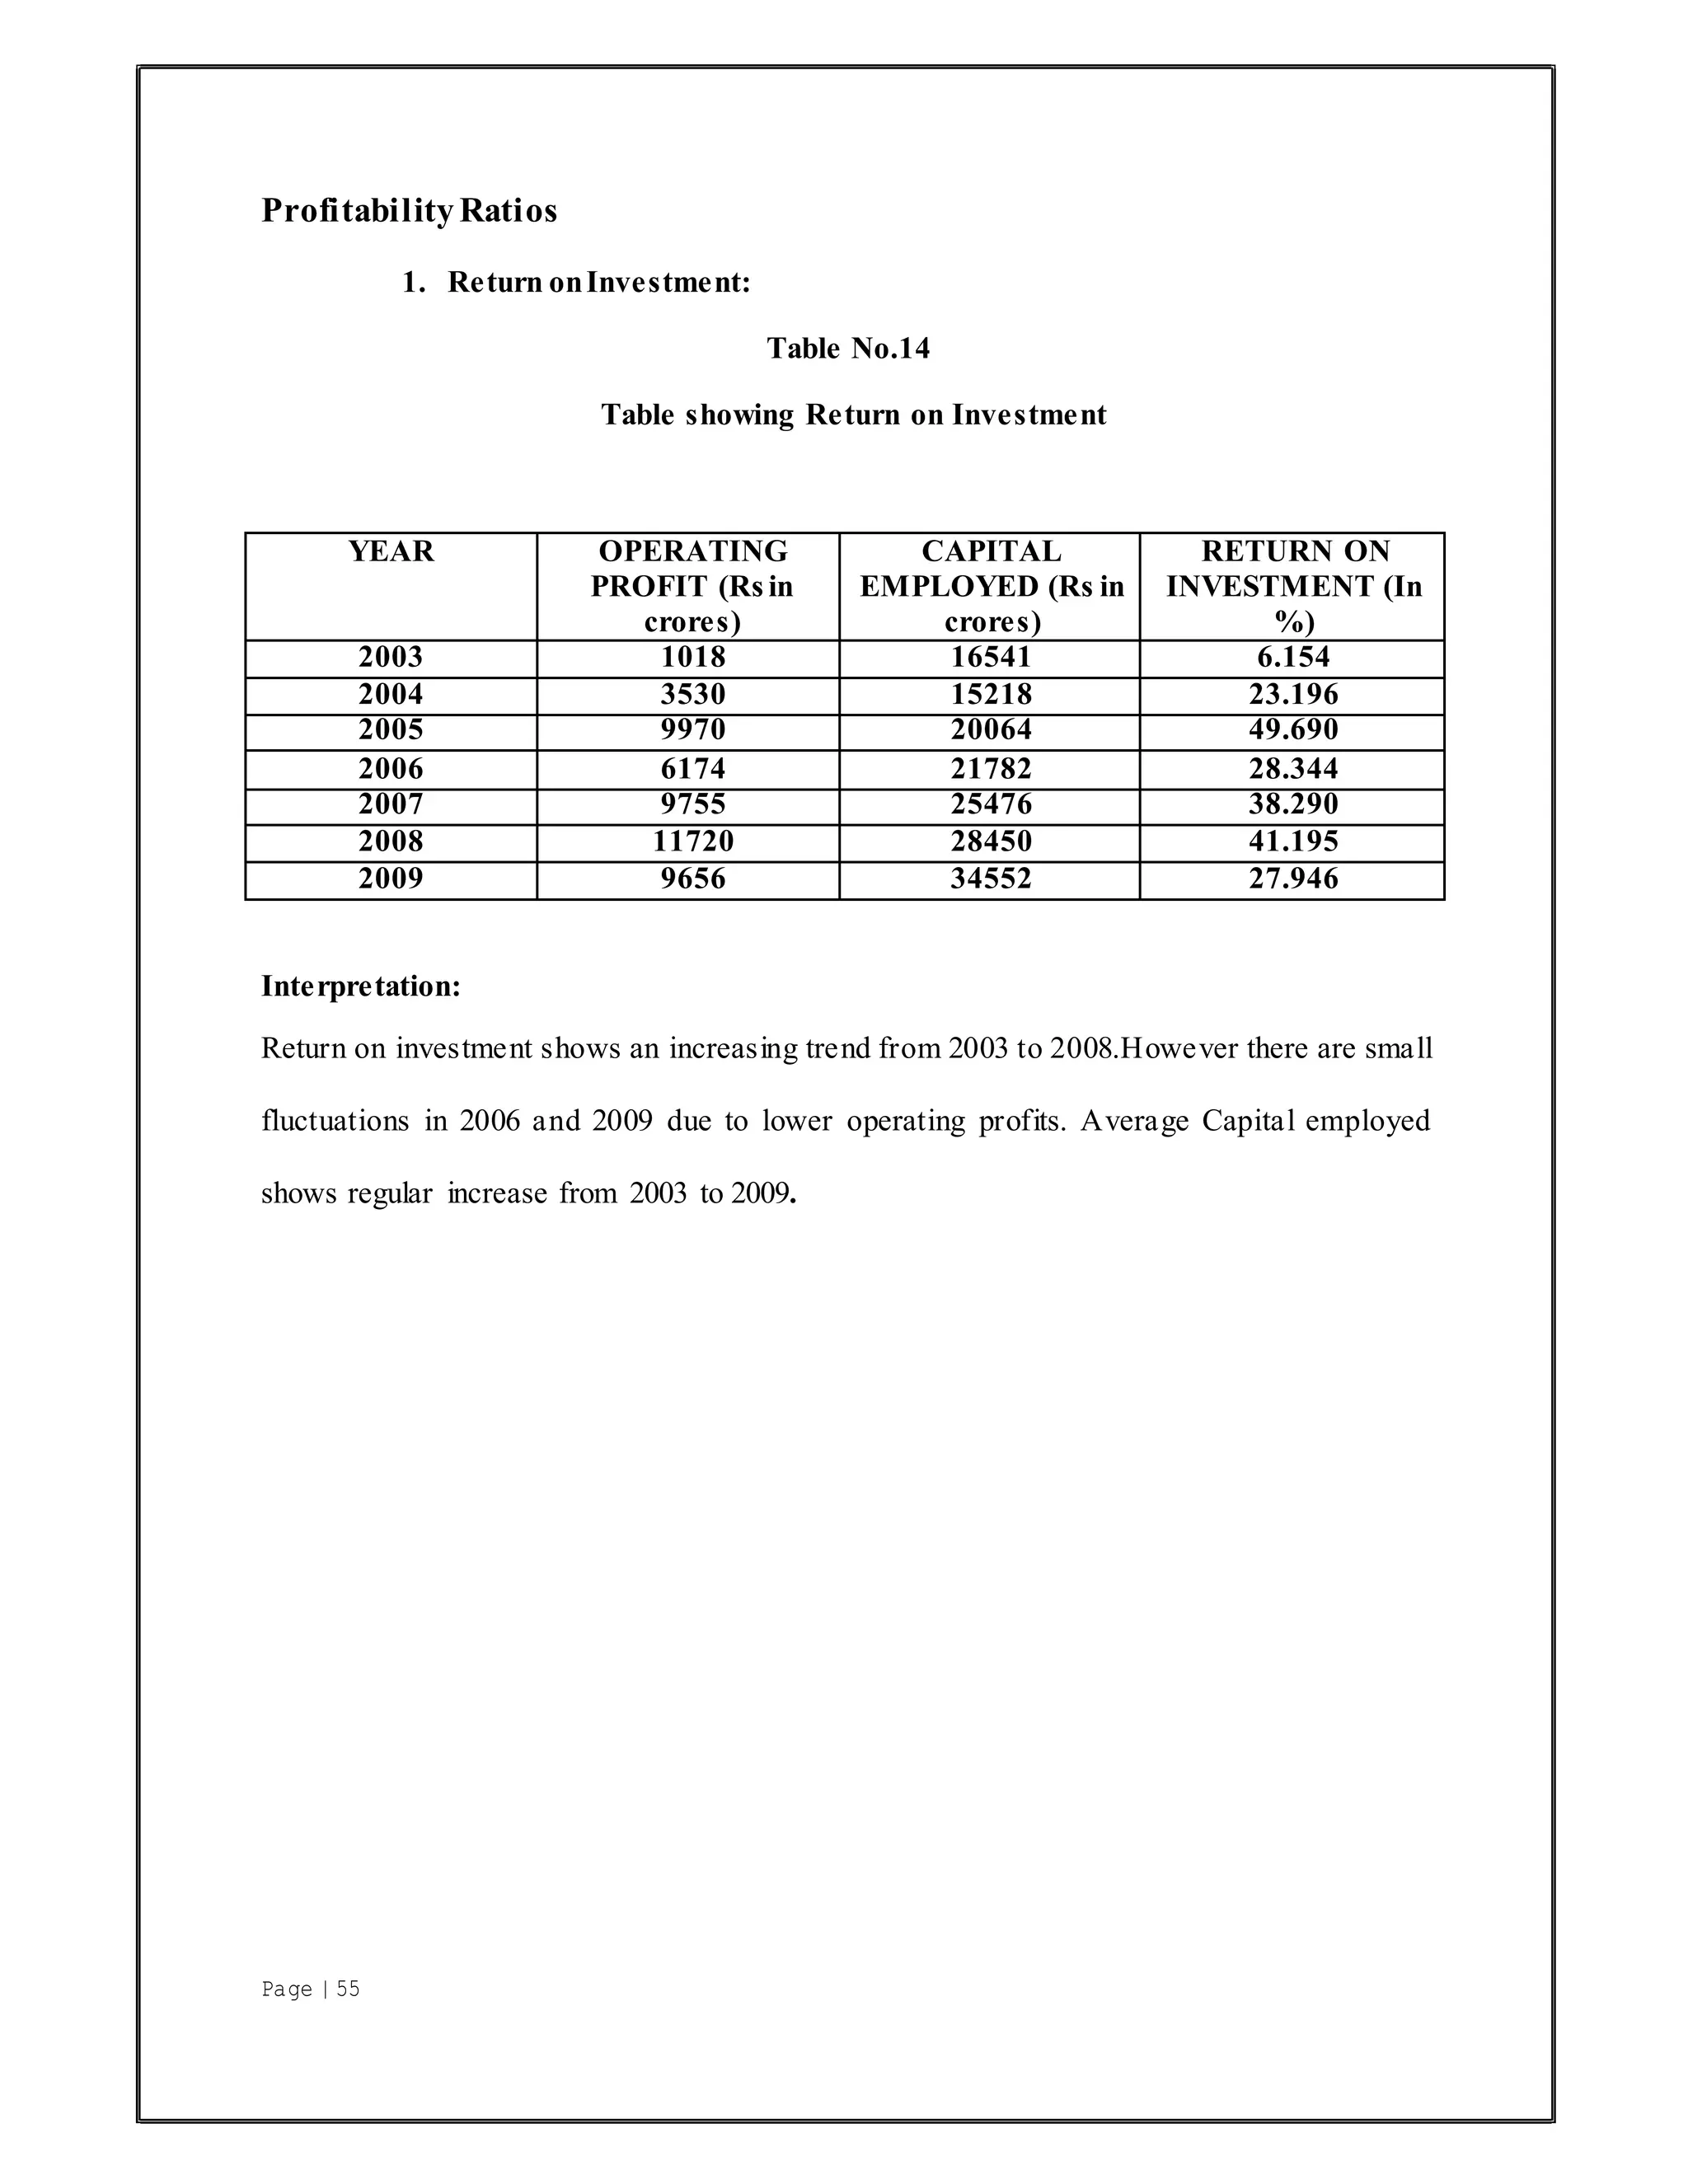
It is also called as “Return on Capital Employed”. It indicates the percentage of return on the
total capital employed in the business.
The term ‘operating profit ‘ means ‘profit before interest and tax’ and the term ‘capital
employed ‘ means sum-total of long term funds employed in the business. i.e. Share capital +
Reserve and surplus + long term loans – [non business assets +fictitious assets]
Return on investment = Operating profit/ Capital employed *100
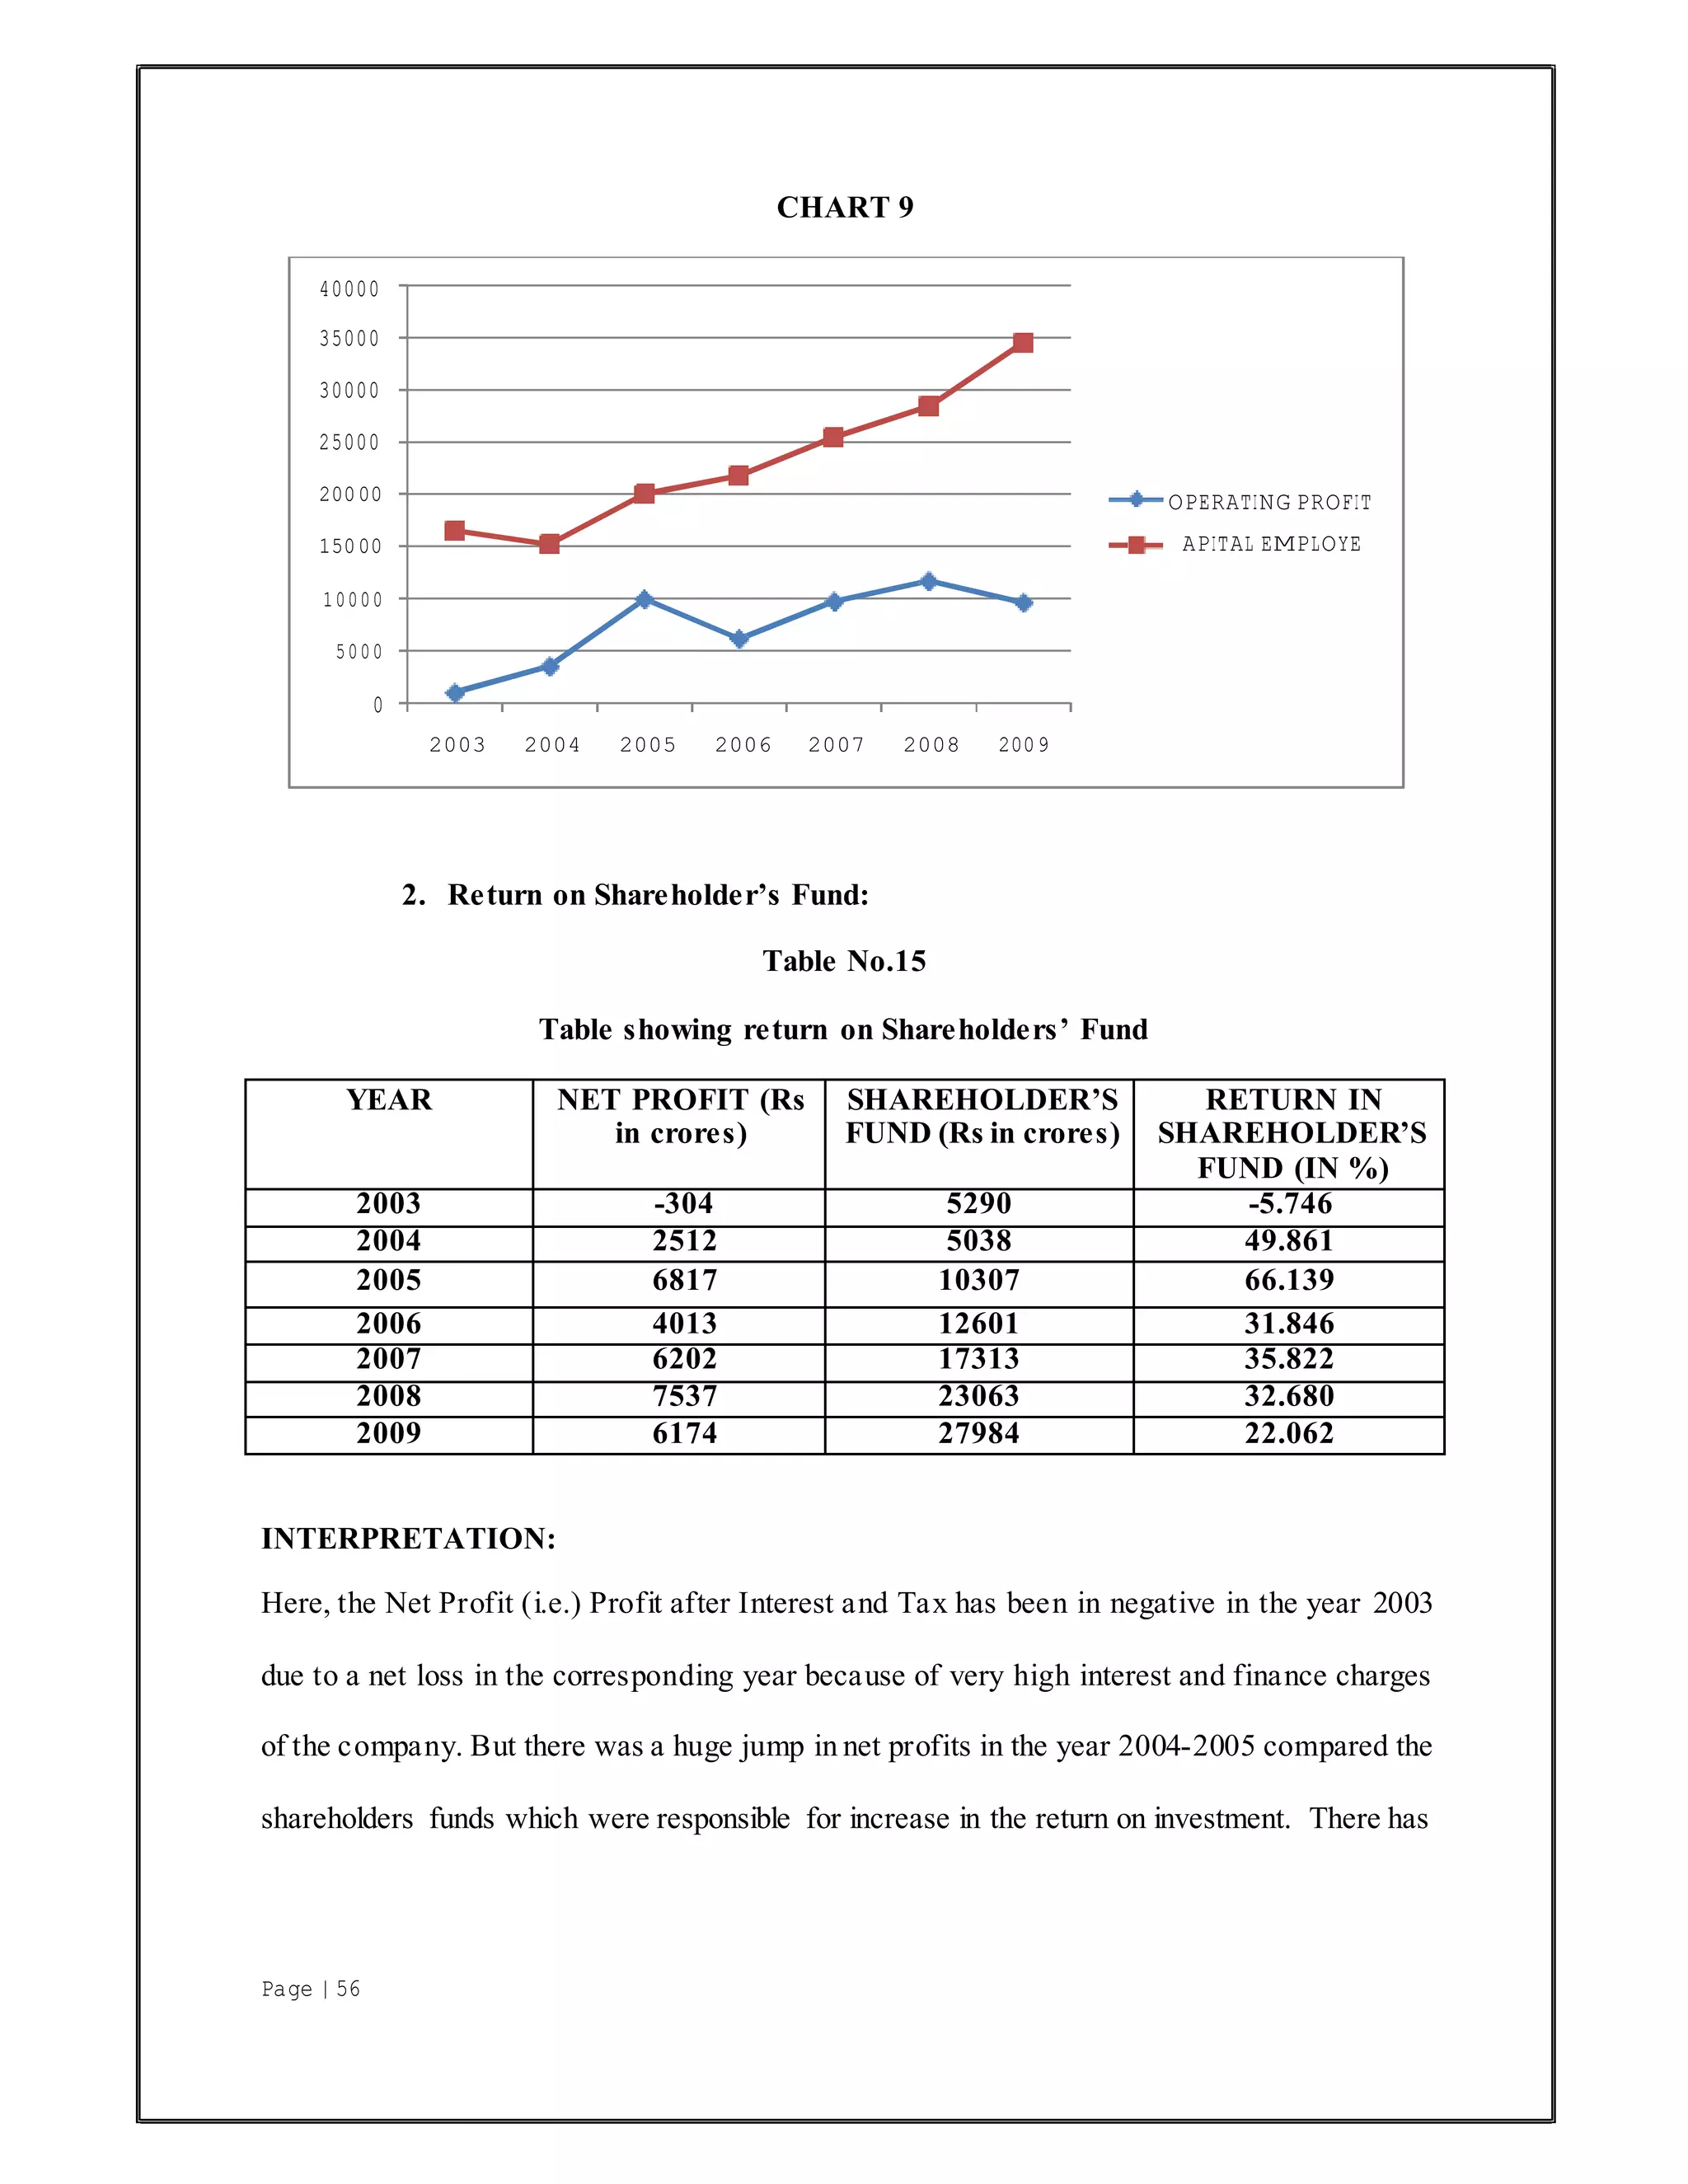
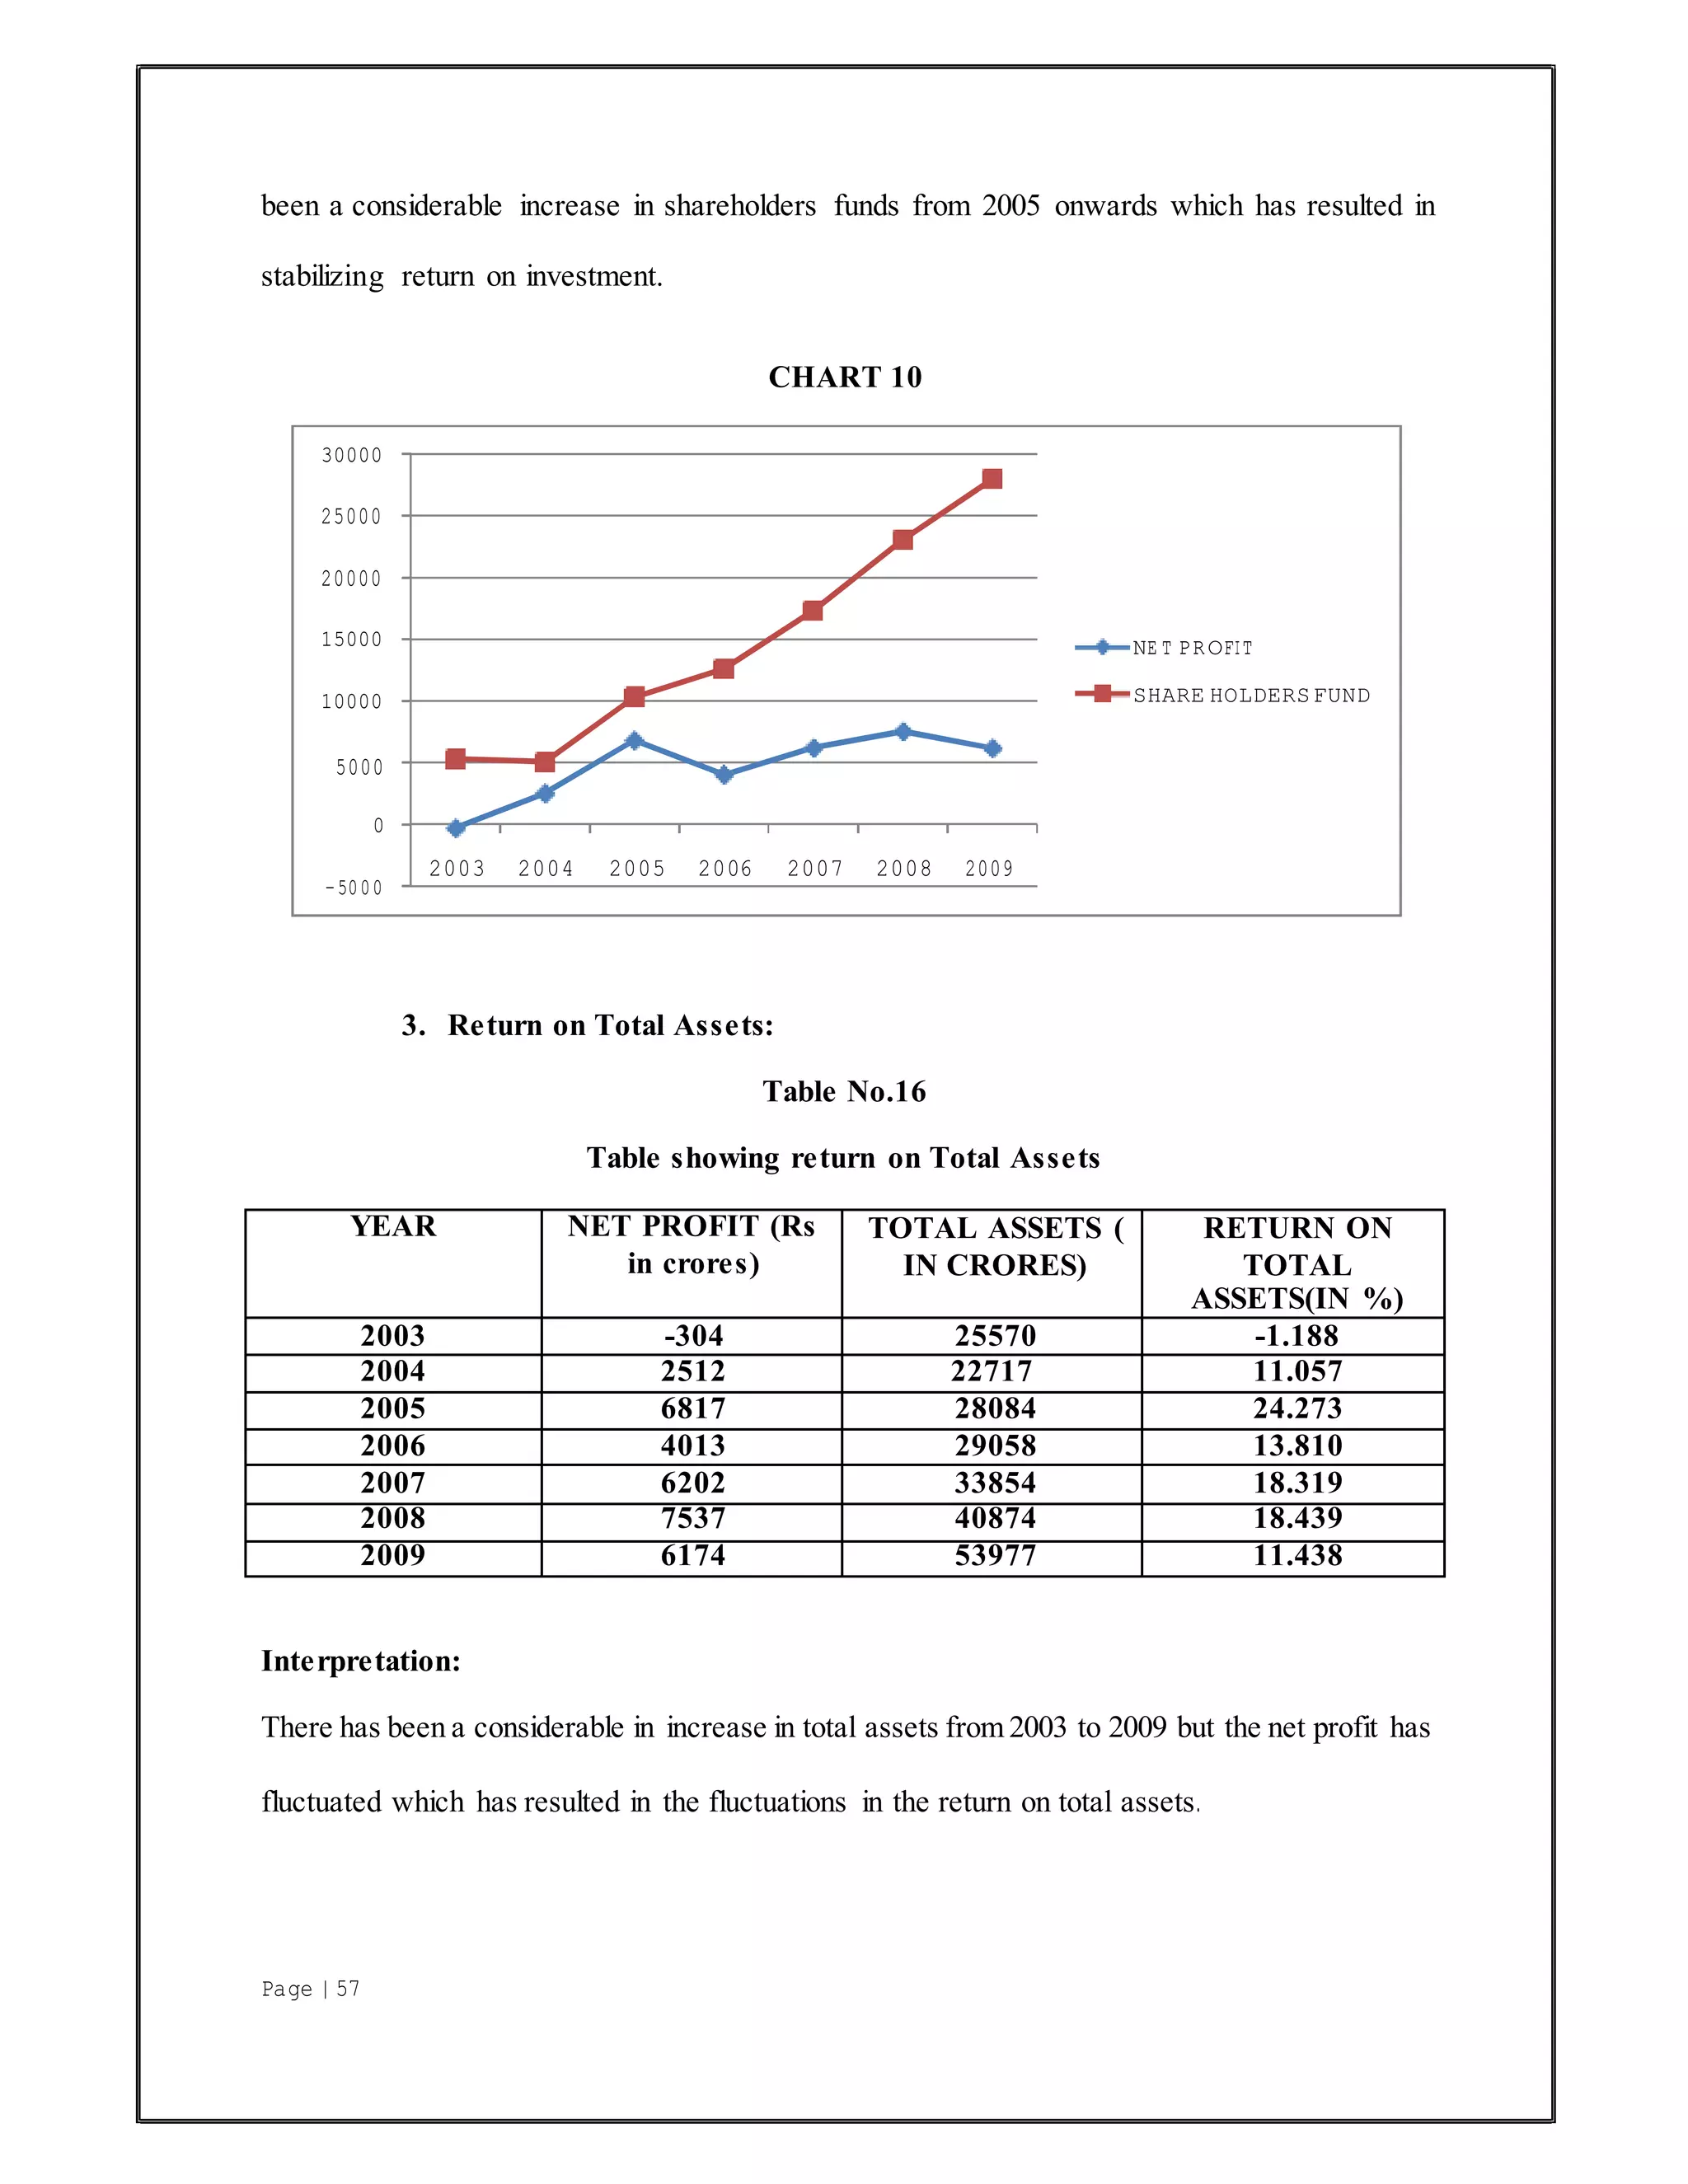
2. Return on Shareholder’s Fund:
In case it is desired to work out the productivity of the company from the shareholder’s point
of view, it should be computed as follows:
Return on shareholder’s fund = Net profit after Interest and Tax/Shareholders’ fund*100
The term profit here means ‘Net Income after the deduction of interest and tax’. It is different
from the “Net operating profit” which is used for computing the ‘Return on total capital
employed’ in the business. This is because the shareholders are interested in Total Income
after tax including Net non-operating Income (i.e. Non- Operating Income -Non-Operating
expenses).
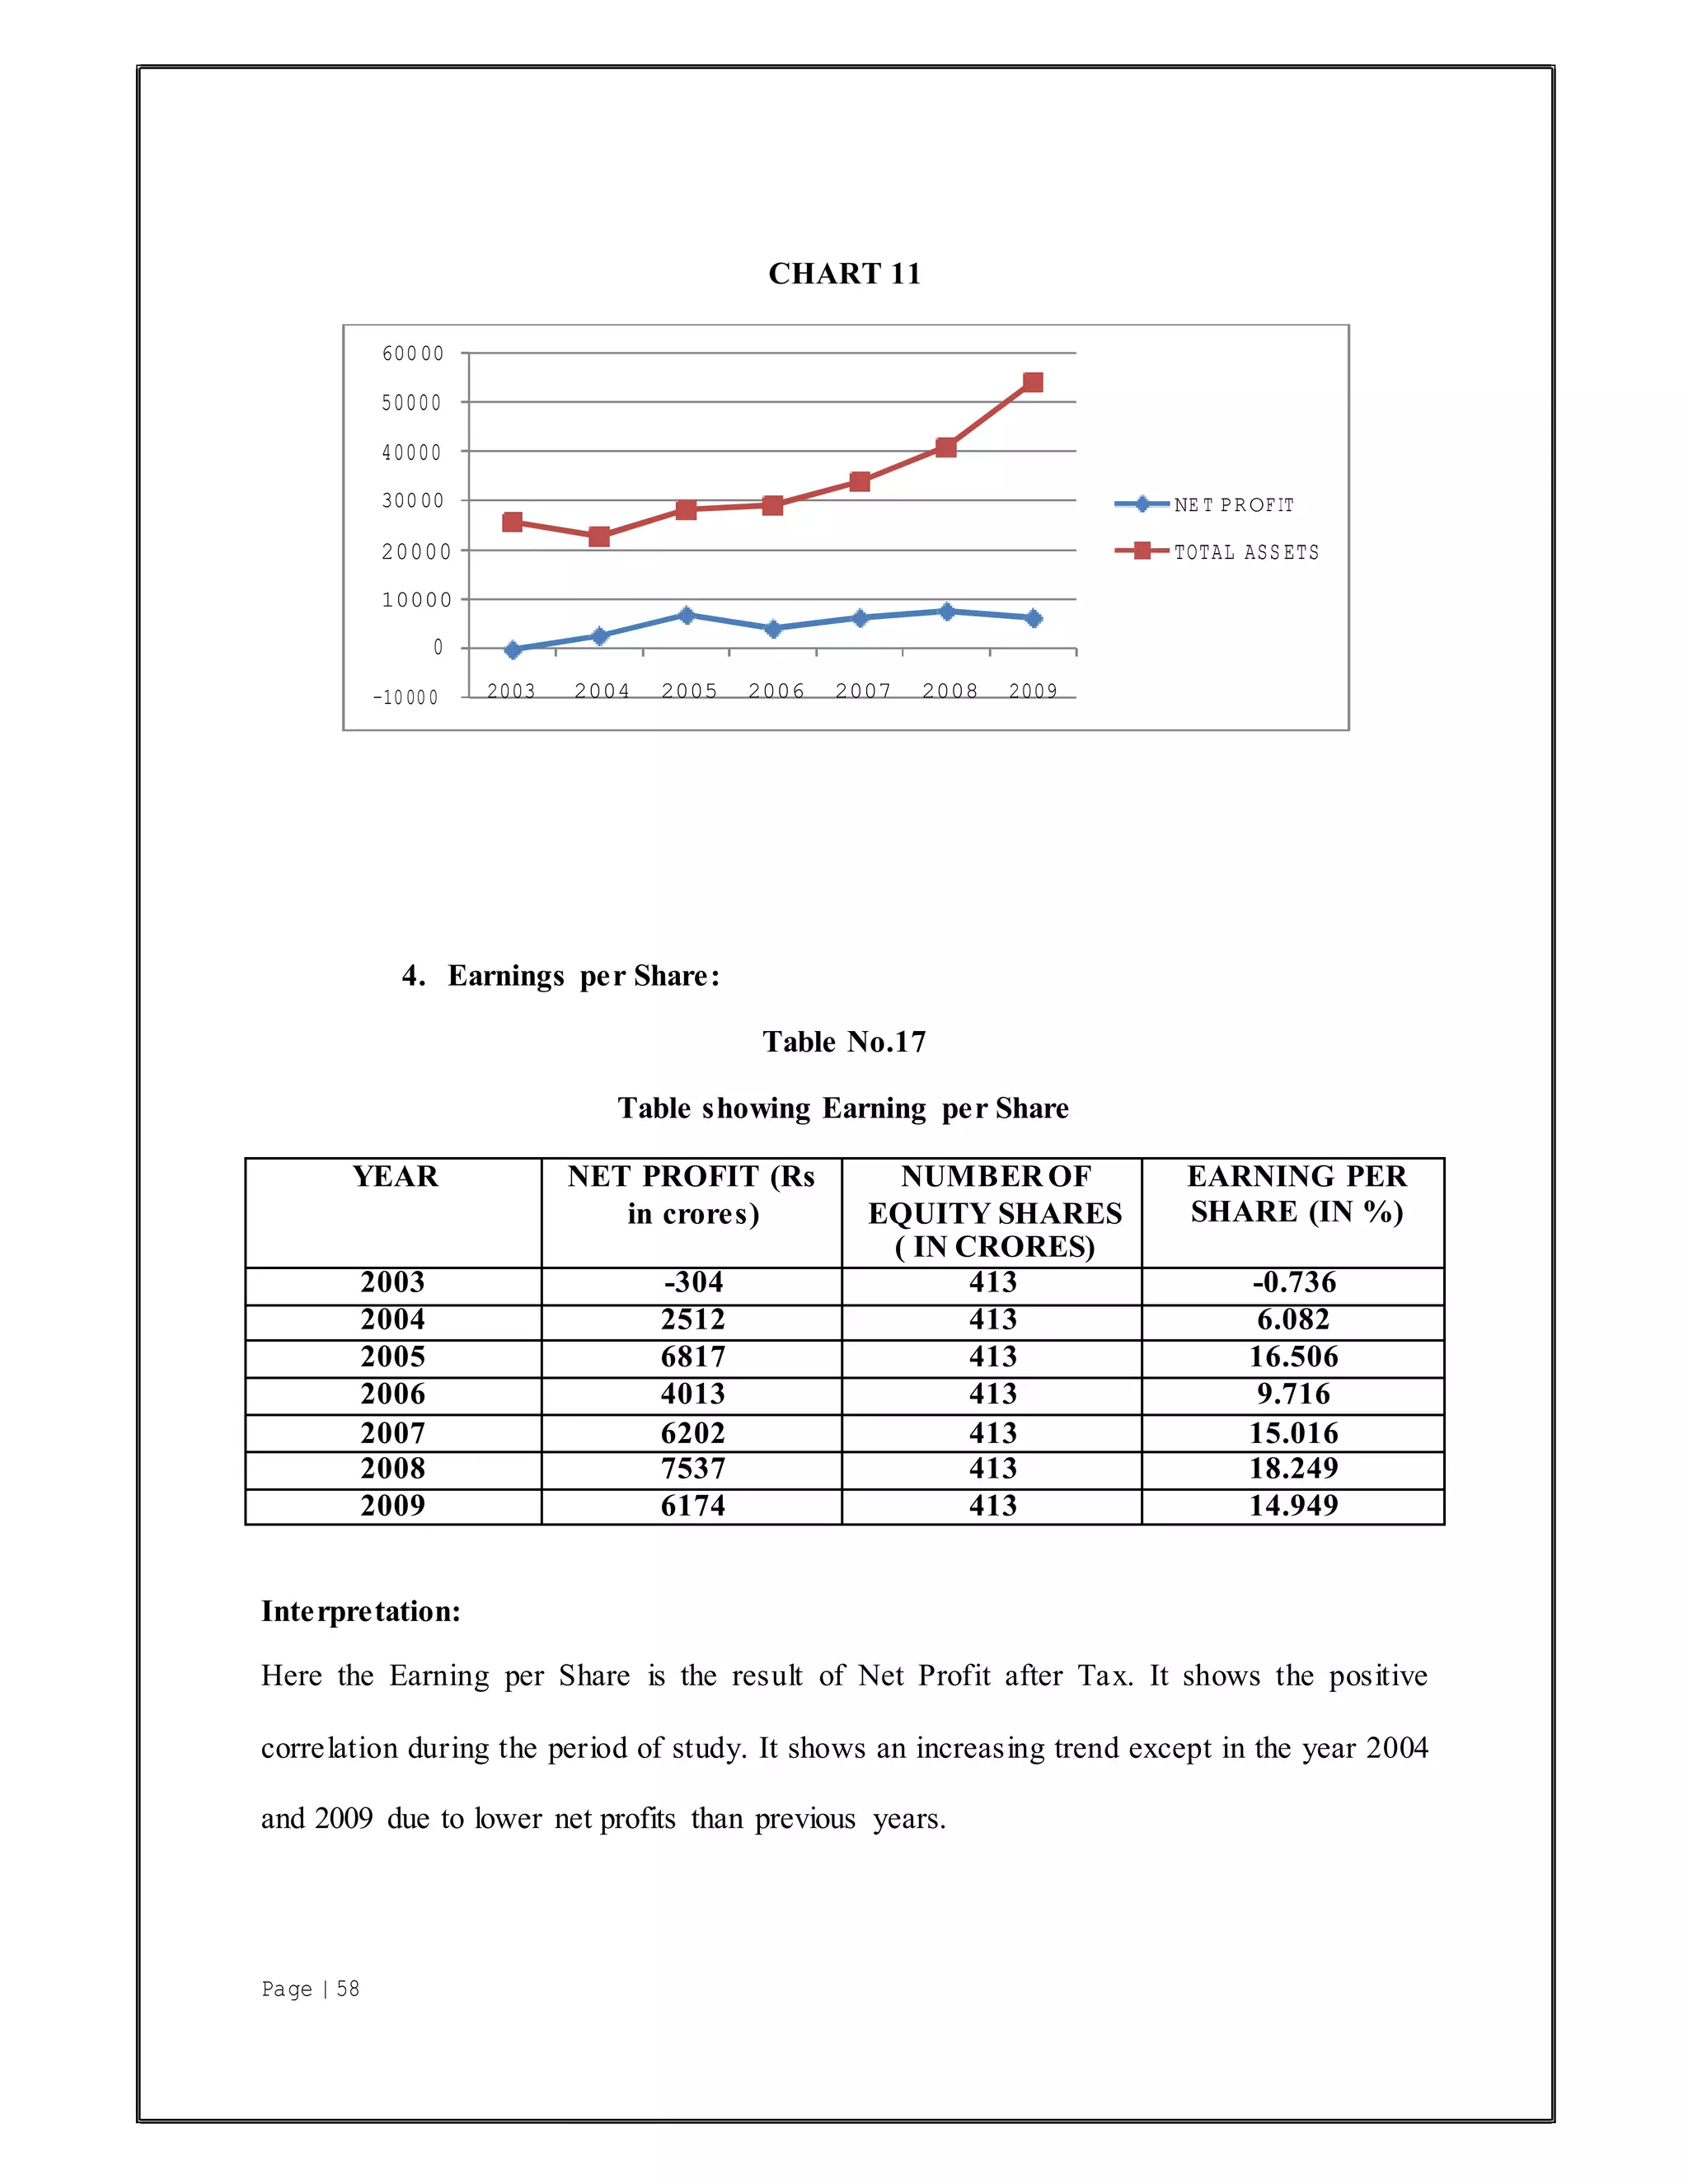
3. Return on Total Assets:
This ratio is computed to know the productivity of the total assets.The term ‘Total Assets’
includes the fixed asset, current asset and capitalwork in progress of the company. The above
table clearly reveals the relationship between the net profit and Total Assets employed in the
business.
Return on Total Assets = Net profit after Tax/Total Assets* 100](https://image.slidesharecdn.com/comparativeanalysisoffinancial-converted-200318152129/75/Comparative-analysis-of-financial-converted-32-2048.jpg)