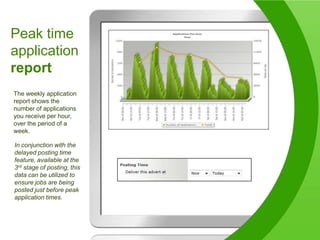
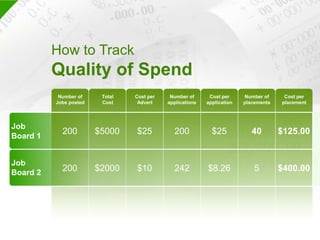
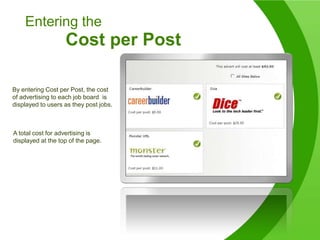
BroadbeanTHE Job Distribution Company
                    WhyBroadbean?1Gain TimeTrend Spotting2Sector MonitoringPeak Application Times3Maximize Return on InvestmentTracking ProcessesQuality vs. Quantity4Hard-to-Find CandidatesPeak Application Times
1Gain Time
Gain Time with anIntegrated WorkflowManage ResponsesJobs CreatedResponse AnalyticsReference #AssignedJobs Postedto Online Boards
2Trend Spotting
Current Live JobsPie ChartThe live sector pie chart can give you a simple overview of the distribution of postings across all job boards.The report can also quickly indicate offices or branches that heavily use one job board over another.
Peak timeapplicationreportThe weekly application report shows the number of applications you receive per hour, over the period of a week.In conjunction with the delayed posting time feature, available at the 3rd stage of posting, this data can be utilized to ensure jobs are being posted just before peak application times.
Sector PerformanceMonitorThis report displays jobs with high application rates against jobs where candidates are in short supply. This information will determine ROI and whether or not the use of niche boards is required or if alternate channels for candidate attraction should be considered.
3Maximizing ROI
Know Your SpendKnow WeaknessesBudget WiselyGet More for Your Buck
How Most Recruiters / Hiring Managers TrackSpendTotalCost Cost perPostingNumber ofJobs postedJobBoard 1200$5000$25JobBoard 2200$2000$10
How to Track Job PostingDollars More EffectivelyTotalCost Cost perAdvert Number ofapplicationsCost perapplicationNumber ofJobs postedJobBoard 1200200$5000$25$25JobBoard 2200242$2000$10$8.26
How to TrackQuality of Spend TotalCost Cost perAdvert Number ofapplicationsCost perapplicationNumber ofJobs postedNumber ofplacementsCost perplacementJob Board 120020040$5000$25$25$125.00JobBoard 22002425$2000$10$8.26$400.00
Monitor Quality of Responsewith Broadbean
Response AnalysisReportFollow  the number of applications and a ratio of the responses per posting for each job board.This data is used to observe which boards supply the highest application count per postings – the highest return.Monitor the boards that provide a high ratio of unsuitable candidates.Distinguish which job boards produce suitable candidates, those that are shortlisted or added to the database.
Apply Online    ReportView Applicant Drop-Off  for boards where apply online is used..This data is used to improve the application process with each board to maximize the number of candidates that register. In this example, Jobs In The Money has the lowest drop-off with Simply Hired having the highest.
Comparing CandidateApplication DataAll reports can be drilled down to compare application data across each job board, sector, and even specific salary ranges.Branches and divisions can be compared to see how they perform against each other.In this example, the Milwaukee Downtown branch are experiencing higher application and lower drop off ratios compared to the Milwaukee West branch
Entering the Cost per PostBy entering Cost per Post, the cost of advertising to each job board  is displayed to users as they post jobs.A total cost for advertising is displayed at the top of the page.
CostReportingThe new cost reports will allow you to clearly see your total spend and cost per application by individual job boardDue to the link with DT we can also see the cost of uncompleted applications
4Reach Hard-to-Find Candidates
Know thePeak Times of ResponsesWeekends??Weekdays?
Peak time response rates
Trial Job Boards-Free or Paid
IncreasePhone TimeIncrease Quantityof ApplicantsIncrease Qualityof CandidatesSummaryReduceCostsManage Online SpendImproveBottom Line

Why Broadbean?

  • 1.
  • 2.
    WhyBroadbean?1Gain TimeTrend Spotting2Sector MonitoringPeak Application Times3Maximize Return on InvestmentTracking ProcessesQuality vs. Quantity4Hard-to-Find CandidatesPeak Application Times
  • 3.
  • 4.
    Gain Time withanIntegrated WorkflowManage ResponsesJobs CreatedResponse AnalyticsReference #AssignedJobs Postedto Online Boards
  • 5.
  • 6.
    Current Live JobsPieChartThe live sector pie chart can give you a simple overview of the distribution of postings across all job boards.The report can also quickly indicate offices or branches that heavily use one job board over another.
  • 7.
    Peak timeapplicationreportThe weeklyapplication report shows the number of applications you receive per hour, over the period of a week.In conjunction with the delayed posting time feature, available at the 3rd stage of posting, this data can be utilized to ensure jobs are being posted just before peak application times.
  • 8.
    Sector PerformanceMonitorThis reportdisplays jobs with high application rates against jobs where candidates are in short supply. This information will determine ROI and whether or not the use of niche boards is required or if alternate channels for candidate attraction should be considered.
  • 9.
  • 10.
    Know Your SpendKnowWeaknessesBudget WiselyGet More for Your Buck
  • 11.
    How Most Recruiters/ Hiring Managers TrackSpendTotalCost Cost perPostingNumber ofJobs postedJobBoard 1200$5000$25JobBoard 2200$2000$10
  • 12.
    How to TrackJob PostingDollars More EffectivelyTotalCost Cost perAdvert Number ofapplicationsCost perapplicationNumber ofJobs postedJobBoard 1200200$5000$25$25JobBoard 2200242$2000$10$8.26
  • 13.
    How to TrackQualityof Spend TotalCost Cost perAdvert Number ofapplicationsCost perapplicationNumber ofJobs postedNumber ofplacementsCost perplacementJob Board 120020040$5000$25$25$125.00JobBoard 22002425$2000$10$8.26$400.00
  • 14.
    Monitor Quality ofResponsewith Broadbean
  • 15.
    Response AnalysisReportFollow the number of applications and a ratio of the responses per posting for each job board.This data is used to observe which boards supply the highest application count per postings – the highest return.Monitor the boards that provide a high ratio of unsuitable candidates.Distinguish which job boards produce suitable candidates, those that are shortlisted or added to the database.
  • 16.
    Apply Online ReportView Applicant Drop-Off for boards where apply online is used..This data is used to improve the application process with each board to maximize the number of candidates that register. In this example, Jobs In The Money has the lowest drop-off with Simply Hired having the highest.
  • 17.
    Comparing CandidateApplication DataAllreports can be drilled down to compare application data across each job board, sector, and even specific salary ranges.Branches and divisions can be compared to see how they perform against each other.In this example, the Milwaukee Downtown branch are experiencing higher application and lower drop off ratios compared to the Milwaukee West branch
  • 18.
    Entering the Costper PostBy entering Cost per Post, the cost of advertising to each job board is displayed to users as they post jobs.A total cost for advertising is displayed at the top of the page.
  • 19.
    CostReportingThe new costreports will allow you to clearly see your total spend and cost per application by individual job boardDue to the link with DT we can also see the cost of uncompleted applications
  • 20.
  • 21.
    Know thePeak Timesof ResponsesWeekends??Weekdays?
  • 22.
  • 23.
  • 24.
    IncreasePhone TimeIncrease QuantityofApplicantsIncrease Qualityof CandidatesSummaryReduceCostsManage Online SpendImproveBottom Line