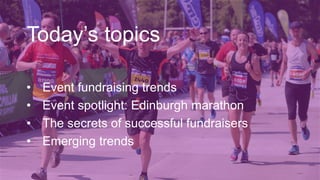
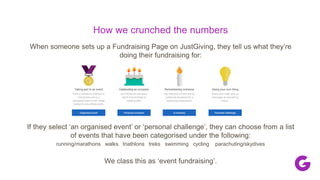
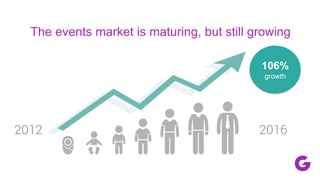
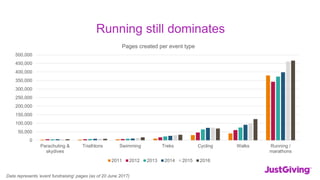
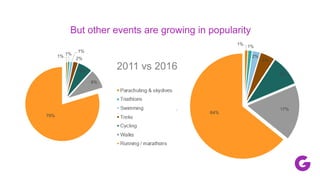
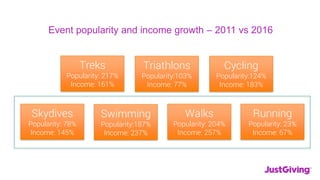
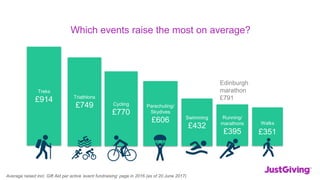
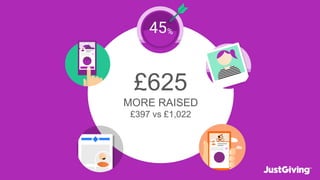
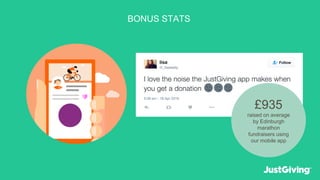
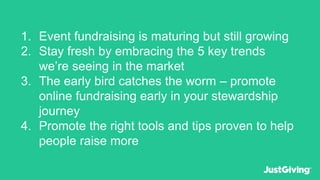
What’s next for events?
Discover the big event fundraising trends we’re seeing on JustGiving and
the secrets of success of Edinburgh marathon runners
Phoebe Sabin
Customer Success Manager
#scotconf17
Today’s topics
• Event fundraising trends
• Event spotlight: Edinburgh marathon
• The secrets of successful fundraisers
• Emerging trends
WHAT EVENT FUNDRAISING
TRENDS ARE WE SEEING ON
JUSTGIVING?
How we crunched the numbers
When someone sets up a Fundraising Page on JustGiving, they tell us what they’re
doing their fundraising for:
If they select ‘an organised event’ or ‘personal challenge’, they can choose from a list
of events that have been categorised under the following:
running/marathons walks triathlons treks swimming cycling parachuting/skydives
We class this as ‘event fundraising’.
The events market is maturing, but still growing
2012 2016
106%
growth
Running still dominates
Data represents ‘event fundraising’ pages (as of 20 June 2017)
0
50,000
100,000
150,000
200,000
250,000
300,000
350,000
400,000
450,000
500,000
Parachuting &
skydives
Triathlons Swimming Treks Cycling Walks Running /
marathons
Pages created per event type
2011 2012 2013 2014 2015 2016
But other events are growing in popularity
2011 vs 2016
1% 1%
2%
4%
9%
17%
64%
1%
1%
1%
2%
6%
9%
79%
And the money they raise
257%
237%
183%
161%
145%
77%
67%
0%
50%
100%
150%
200%
250%
300%
Walks Swimming Cycling Treks Parachuting &
skydives
Triathlons Running / marathons
Event fundraising growth per category 2016 vs 2011 (£ raised)
Event popularity and income growth – 2011 vs 2016
Running
Popularity: 23%
Income: 67%
Walks
Popularity: 204%
Income: 257%
Cycling
Popularity:124%
Income: 183%
Treks
Popularity: 217%
Income: 161%
Skydives
Popularity: 78%
Income: 145%
Swimming
Popularity:187%
Income: 237%
Triathlons
Popularity:103%
Income: 77%
Walks
£351
Running/
marathons
£395
Cycling
£770
Treks
£914
Parachuting/
Skydives
£606 Swimming
£432
Triathlons
£749
Edinburgh
marathon
£791
Average raised incl. Gift Aid per active ‘event fundraising’ page in 2016 (as of 20 June 2017)
Which events raise the most on average?
The battle of the sexes
• Women, as a group,
raise more for event
fundraising
• As more of them
actively fundraise
• BUT, men on
average raise more
per person for event
fundraising
Pages created per event category 2016
Men Women
£388
page
average
£537
page
average
£ raised
A closer look at SWIMMING
0
500
1,000
1,500
2,000
18-25 26-30 31-35 36-40 41-45 46-50 51-55 56-60 61-65 66-70 71-75
Women Men
Popularity
Men Women
£599
page
average
£618
page
average
£ raised
A closer look at SKYDIVESPopularity
0
200
400
600
800
1,000
18-25 26-30 31-35 36-40 41-45 46-50 51-55 56-60 61-65 66-70 71-75
Women Men
Men Women
£318
page
average
£630
page
average
£ raised
A closer look at RUNNINGPopularity
0
20,000
40,000
60,000
18-25 26-30 31-35 36-40 41-45 46-50 51-55 56-60 61-65 66-70 71-75
Women Men
Men Women
£645
page
average
£831
page
average
£ raised
A closer look at TRIATHLONSPopularity
0
200
400
600
800
1,000
18-25 26-30 31-35 36-40 41-45 46-50 51-55 56-60 61-65 66-70 71-75
Women Men
Men Women
£728
page
average
£789
page
average
£ raised
A closer look at CYCLINGPopularity
0
2,000
4,000
6,000
8,000
18-25 26-30 31-35 36-40 41-45 46-50 51-55 56-60 61-65 66-70 71-75
Women Men
EDINBURGH MARATHON FUNDRAISERS:
WHAT ARE THE BEHAVIOURS THAT
RAISE THE MOST MONEY?
1) THEY ARRIVE EARLY TO THE PARTY
MAYJANUARY
CREATE PAGE
90+
DAYS BEFORE
?
£50 £100£25
A. B. C.
APRILJANUARY
£902
+£100 than
the average!
CREATE PAGE
90+
DAYS BEFORE
2) THEY USE ALL THE TOOLS IN THE TOOLBOX
1. UPDATES 2. TARGET 3. PHOTOS
4. PROFILE PIC 5. STORY
1. UPDATES
Runners that posted
+3 updates to their
fundraising page
raised over £400 more
than those who didn’t.
2. TARGET
People that set a target
raised more money.
42% more on average.
3. PHOTOS
Fundraisers that shared
3 or more photos raised
£550+ more money
than those that didn’t.
4. PROFILE PIC
A perfect excuse for a
selfie – runners that
added a profile picture to
their page raised up to
31% more
5. STORY
Nothing beats a story from
the heart. Fundraisers
with personalised stories
raised £130 more that
those that didn’t.
HOW MUCH MORE DID PEOPLE RAISE
IF THEY USED ALL FIVE FEATURES?
?
LESS
THAN
£600?
MORE
THAN
£600?
£625
MORE RAISED
£397 vs £1,022
BONUS STATS
£935
raised on average
by Edinburgh
marathon
fundraisers using
our mobile app
BONUS STATS
JustTextGiving – any
guesses for how
much more this
helped people raise?
BONUS STATS
£200 more raised
when an Edinburgh
marathon fundraiser
promotes text giving
to their page
WHAT ARE THE EMERGING
EVENT TRENDS WE’RE SEEING IN
THE MARKET?
1. VIP EXPERIENCES
“We offer special
experiences, for example
we invite people to a tour
of our labs, which not only
makes them feel valued,
but also gives us the
opportunity to build a
stronger relationship with
them and help pave the
way for future support”
Jade Brent,
Senior Events Manager
Passionate, personal voices
raise more money.
What are you doing to
make your most valuable
event participants
(and their loved ones)
feel and share like this?
2. IMMERSIVE EXPERINCES
Forced to Flee
from
Immersive experiences
trigger a strong
emotional reaction –
connection,
understanding,
humility.
How can you make your
event participants feel
like this?
3. VIRTUAL EVENTS
4. REWARD
5. COMMUNITY
3. NUDGE
KEY TAKEAWAYS
1. Event fundraising is maturing but still growing
2. Stay fresh by embracing the 5 key trends
we’re seeing in the market
3. The early bird catches the worm – promote
online fundraising early in your stewardship
journey
4. Promote the right tools and tips proven to help
people raise more
Thanks
Any questions?

Event fundraising trends and the Edinburgh Marathon