Oil Well Performance, Not Price, to Drive Industry in 2015
•
0 likes•387 views

The document summarizes well completion trends in 2014 for the Permian and Eagle Ford basins. It analyzes completion data for major operators such as Pioneer, EP Energy, Rosetta Resources, and Devon Energy. It finds that pad drilling increased during 2014, with over 40% of Eagle Ford completions on pads. Operators focused on efficiency and cycle time metrics to reduce costs. The outlook for 2015 includes a decline in rig counts during the first half, continued focus on core assets from independents, and an emphasis on efficiency as a driver of success.

Recommended
Recommended
More Related Content
What's hot
What's hot (20)
Similar to Oil Well Performance, Not Price, to Drive Industry in 2015
Similar to Oil Well Performance, Not Price, to Drive Industry in 2015 (20)
Recently uploaded
Recently uploaded (20)
Oil Well Performance, Not Price, to Drive Industry in 2015
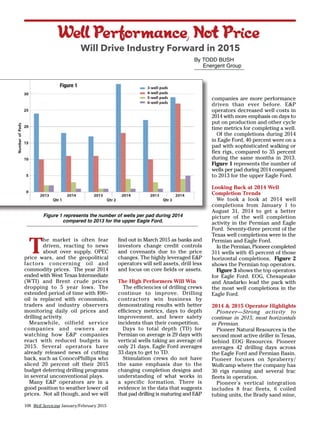
- 1. T he market is often fear driven, reacting to news about over supply, OPEC price wars, and the geopolitical factors concerning oil and commodity prices. The year 2014 ended with West Texas Intermediate (WTI) and Brent crude prices dropping to 5 year lows. The extended period of time with $90+ oil is replaced with economists, traders and industry observers monitoring daily oil prices and drilling activity. Meanwhile, oilfield service companies and owners are watching how E&P companies react with reduced budgets in 2015. Several operators have already released news of cutting back, such as ConocoPhillips who sliced 20 percent off their 2015 budget deferring drilling programs in several unconventional plays. Many E&P operators are in a good position to weather lower oil prices. Not all though, and we will find out in March 2015 as banks and investors change credit controls and covenants due to the price changes. The highly leveraged E&P operators will sell assets, drill less and focus on core fields or assets. The High Performers Will Win The efficiencies of drilling crews continue to improve. Drilling contractors win business by demonstrating results with better efficiency metrics, days to depth improvement, and fewer safety incidents than their competition. Days to total depth (TD) for Permian on average is 29 days with vertical wells taking an average of only 21 days. Eagle Ford averages 33 days to get to TD. Stimulation crews do not have the same emphasis due to the changing completion designs and understanding of what works in a specific formation. There is evidence in the data that suggests that pad drilling is maturing and E&P companies are more performance driven than ever before. E&P operators decreased well costs in 2014 with more emphasis on days to put on production and other cycle time metrics for completing a well. Of the completions during 2014 in Eagle Ford, 40 percent were on a pad with sophisticated walking or flex rigs, compared to 35 percent during the same months in 2013. Figure 1 represents the number of wells per pad during 2014 compared to 2013 for the upper Eagle Ford. Looking Back at 2014 Well Completion Trends We took a look at 2014 well completions from January 1 to August 31, 2014 to get a better picture of the well completion activity in the Permian and Eagle Ford. Seventy-three percent of the Texas well completions were in the Permian and Eagle Ford. In the Permian, Pioneer completed 311 wells with 45 percent of those horizontal completions. Figure 2 shows the Permian top operators. Figure 3 shows the top operators for Eagle Ford. EOG, Chesapeake and Anadarko lead the pack with the most well completions in the Eagle Ford. 2014 & 2015 Operator Highlights Pioneer—Strong activity to continue in 2015; most horizontals in Permian. Pioneer Natural Resources is the second most active driller in Texas, behind EOG Resources. Pioneer averages 42 drilling days across the Eagle Ford and Permian Basin. Pioneer focuses on Spraberry/ Wolfcamp where the company has 30 rigs running and several frac fleets in operation. Pioneer’s vertical integration includes 8 frac fleets, 6 coiled tubing units, the Brady sand mine, By TODD BUSH Energent Group_______________________ 108 Well Servicing January/February 2015 WellPerformance,NotPrice Will Drive Industry Forward in 2015 Figure 1 represents the number of wells per pad during 2014 compared to 2013 for the upper Eagle Ford. Figure 1
- 2. Well Servicing January/February 2015 109 and water distribution network for the Wolfcamp well demands. The company completed over 100 wells in Martin, Midland and Glasscock counties. Efficiency across the value chain allows the company to front- end load infrastructure costs and spread the costs over the life of the asset. EP Energy: All Horizontal in Permian & Eagle Ford. EP Energy’s well completion activity is 100 percent horizontal this year with 88 percent in La Salle (Eagle Ford) and Crockett targeting the Wolfcamp. EP Energy’s days to total depth averages 19 and the company waits approximately 61 days to complete a well in the Eagle Ford. The average lateral length for new well starts in Eagle Ford is 6,556 feet with an average oil initial production of over 1,200 barrels. The completion optimization program is implemented in the Eagle Ford with increased stages and proppant amounts. Expect EP Energy to continue to focus in La Salle and Dimmit areas. EP primarily uses FTSI and Weatherford to execute well stimulations of 30 stages with over 9 million pounds of proppant per frac job. Figure 4 shows EP Energy’s well completions near Cotulla in La Salle County. The Wolfcamp program for EP Energy requires an equivalent of $60 per barrel to break-even. At the closing bell on December 12, 2014 the WTI was at $57 per barrel. The company is prime to continue their 5 rig program in Eagle Ford and 4 rig program for Wolfcamp through 2015. Rosetta Resources: $950 million budget +20 percent production growth expected in 2015. Rosetta Resources is a pure play Permian and Eagle Ford operator. The company is focusing on a new completion design that increases the proppant amount by 44 percent. This increase means the completion technique will utilize almost 6 million pounds of frac sand in 19 frac stages. In Reeves County, we see evidence of the new completion design with Weatherford, Halliburton and BHI executing the work with frac sand provided by Carbo and Santrol. The Wolfcamp horizontal completions use between 1,000-1,200 pounds of sand per lateral foot. The company is running four rigs in the Permian. The company cut 2015 budget expectations, yet the firm will spend $522 million in Eagle Ford and $428 million in Wolfcamp. This may reduce the rigs slightly for 2015 but expect the firm to get more favorable contracts in the coming year. Devon Energy: Second most Permian horizontals. Devon’s Permian focus in Wolfberry, Wolfcamp and Bone Spring ranks the operator second behind Pioneer with 104 horizontal well completions. In the Bone Spring play, Devon is testing 1,500 to 2,500 pounds per lateral foot. This is 150 percent to 317 percent to the previous completion design. Preliminary results from these larger completions indicate significantly improved initial production rates, higher EURs and enhanced rates of return compared to the previous completion design. There is evidence of these new completion designs with Baker Hughes and Trican executing the well completions. The company has over 5,000+ drilling locations in the Permian and expects to deliver similar production results in 2015. Based on the sample completions, Devon waits 43 days on average to complete a well. Devon’s recent spuds and well starts in the Eagle Ford are shown in Figure 5. Devon also has a strong asset base in the Eagle Ford due to the acquisition of GeoSouthern Energy. Figure 2 – Permian Top Operators Figure 3 – Eagle Ford Top Operators
- 3. CrownQuest Operating: Most active conventional private company. Eighty-four percent of their activity is in Glasscock, Howard and Martin counties in Texas and 100 percent of the well completions are vertical wells. CrownQuest is an efficient driller and operator. Their time to total depth averages 15 days and the company waits an average of 42 days to complete a well. The amount of oil for CrownQuest is not as prolific as some of the neighboring horizontal wells; however, the cost to drill a vertical well in Howard, Martin and Glasscock is significantly less compared to the $6.5 to $8 million for horizontal wells in the area. With a lower lease operating expense and ef ficient operations expect this conventional private company to continue to attract private investors in 2015. Parsley Energy: Drops vertical rigs to focus on horizontal results in 2015. Parsley Energy had completed 88 wells near the end of 2014 with only 5 horizontal wells. The firm’s vertical wells averaged 11,605 feet and days to total depth averaged 18. Parsley Energy has 2,700+ drilling locations in the Spraberry, Wolfcamp, Cline and Atoka. In mid-December 2014, the company had reported 5 horizontal completions with lateral lengths ranging from 5,200 feet to 9,695 feet. Santrol provided sand for several of these frac jobs ranging from 9 million to almost 12 million pounds. The company’s break-even price is $43 for their horizontal wells. Due to the changes in prices, the company cut 4 vertical rigs from the 2015 plan to focus on horizontal returns. Trends for 2015 Unfortunately, we do not hold the crystal ball to outline what is going to happen in 2015. Here are the 5 items we are watching: 1. Rig count declines faster in first half of 2015 2. Independent E&Ps invest in core assets 3. Efficiency drives success with supplier metrics becoming more important 4. Pad drilling matures 5. Sourcing strategies for sand and water gain attention due to cost pressures For the first half of 2015, plan for rig count decline. We expect the rig count to move toward 2013 numbers across each basin. That means by mid-2015 total U.S. rig count will drop near 1,550-1,600 due to the uncertainty in oil prices, OPEC, global economic factors and budget cuts. The independent E&P companies will continue to invest in core assets across the unconventionals. The focus will enable the companies to meet production numbers since many of the operators are hedged in 2015 through 2016. Efficiency will drive success for operators and service companies. Key metrics for drilling are known but stimulation crew capability will gain more attention. Watch for days in completion inventory (drilled not completed), to complete a well, and days to put on production become more important in supplier discussions. Pad drilling matures in 2015 with the percent of pad drilling increasing to over 60 percent for Eagle Ford and up to 25 percent in Permian. Operators will continue to optimize completions and reduce their surface footprint. This move allows each company to focus on critical materials throughout the entire well lifecycle. New sourcing strategies will yield results, especially for water and frac sand. As operators continue to increase the amount of frac sand per lateral foot, expect water and sand demand to remain high. Operators are executing longer laterals in the Eagle Ford and Permian. Twelve to 15 million pound frac sand jobs will be more frequent increasing the logistics challenges in certain areas. ABOUT THE AUTHOR: Todd Bush is a Principal at Energent Group in Houston, Texas. Energent Group focuses on upstream market intelligence through data-driven research and services. The company provides drilling, completion, and frac data for oilfield service companies to scout operators, monitor unconventional activity, and benchmark competitor performance. Our research services allow corporate and business development groups to understand the market trends, plan sales activity, and close new business. 110 Well Servicing January/February 2015 Cotulla in La Salle County. in the Eagle Ford.