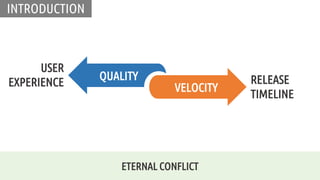
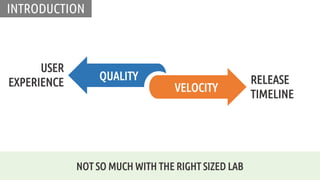
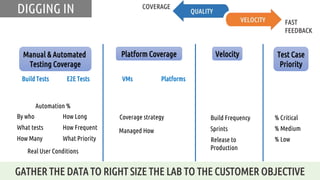
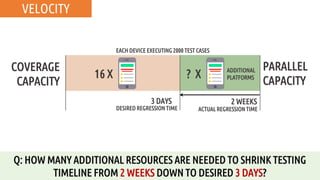
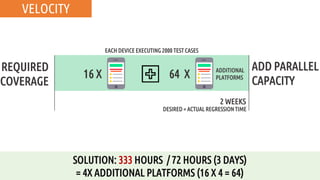
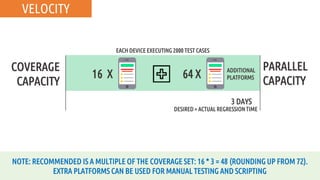
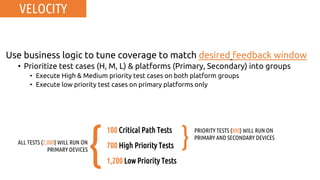
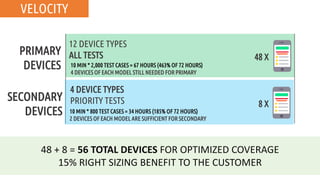
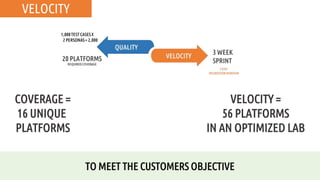
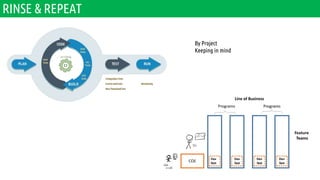
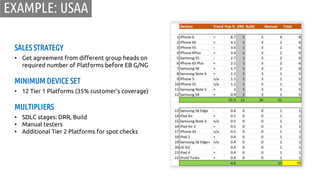
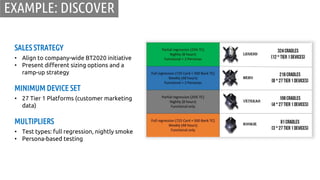
How to Size a Lab
Increase deal size AND provide the exact solution to the customer
Covered in this webinar:
- How to correctly size a lab to accomplish high quality and velocity
- The importance of gathering data from the customer
- Finding out what the customer is willing to NOT cover
By the end of this webinar, you will be able to more comfortably help your customers choose the best size lab for their needs, leading to bigger deal sizes.
4. DIGGING IN
GATHER THE DATA TO RIGHT SIZE THE LAB TO THE CUSTOMER OBJECTIVE
Platform Coverage
VMs Platforms
Managed How
Coverage strategy
Velocity
Sprints
Release to
Production
Manual & Automated
Testing Coverage
Build Tests E2E Tests
How Long
How Frequent
What PriorityHow Many
What tests
By who
% Low
% Medium
% Critical
Test Case
Priority
Automation %
Real User Conditions
Build Frequency
6. 16
30%
25
50%
32
80%
1 USE PERFECTO COVERAGE INDEX AS A STARTING POINT
For instance, customer believes that 16 PLATFORMS (30% COVERAGE) are sufficient
QUALITY: PLATFORM COVERAGE
7. 3 ASK THE FOLLOWING QUESTIONS
Q: Do you only test top OS versions?
A: Majority of organizations test on n, n-1, (n-2 for Android) plus beta releases
Q: Should we include non-revenue generating device/OS combinations?
A: Yes, that’s where users typically have highest number of issues!
Q: Should we take into account your future users’ needs?
A: Yes, additional Platforms may be necessary in addition to those already identified
1 DOES THE CUSTOMER HAVE TRAFFIC ANALYTICS?
2 NO? USE PERFECTO COVERAGE INDEX
For instance, customer believes that 16 PLATFORMS (30% COVERAGE) are sufficient
4 ARRIVE AT RECOMMENDED NUMBER OF PLATFORMS REQUIRED FOR QUALITY COVERAGE
Let’s assume 20 PLATFORM COMBINATIONS are sufficient for coverage
QUALITY
8. VELOCITY
Duration of
release cycle
in waterfall
model in
months
12
IN THE PAST
…releases were tightly controlled and businesses
could complete test-related release activities with a
small set of platforms.
They would also only need a small number of manual
testers, who could finish their job on time.
Quality was acceptable, and customers rarely
complained.
9. VELOCITY
Typical agile
release cycle
duration in
weeks
3
TODAY
… as development teams are moving to agile,
testing needs to execute faster.
Regardless of whether it is manual or automated,
compressed testing timelines require parallel
execution –
• Executing all platforms in parallel
• Duplicating platforms to split test groups
Lack of sufficient parallel capacity to finish testing
on time means that business has to compromise
10.
11. VELOCITY
1. Adopt automation
• Benefit is often a factor of three
2. Execute tests in parallel
• Implement grid strategy
• Was: Average test duration (mins) * test cases * platforms
• Now: Average test duration (mins) * test cases
• (Create opportunity to move some in-cycle)
3. Use business logic to tune coverage to match desired feedback
window
• Prioritize test cases (H, M, L) & platforms (Primary, Secondary) into groups
• Execute High & Medium priority test cases on both platform groups
• Execute low priority test cases on primary platforms only
12. QUALITY
VELOCITY16 PLATFORMS
REQUIRED COVERAGE
3 WEEK
SPRINT
VELOCITY
ARE 16 PLATFORMS ENOUGH TO COMPLETE
FULL REGRESSION IN 3 DAYS?
1,000 TEST CASES X
2 PERSONAS = 2,000
3 DAY
REGRESSION WINDOW
13. VELOCITY
COVERAGE
CAPACITY
EACH PLATFORM EXECUTING 2,000 TEST CASES
3 DAYS
DESIRED REGRESSION TIME
10 MIN * 2,000 TEST CASES * 16 PLATFORMS = 333 HOURS ( +2 WEEKS)
2 WEEKS
ACTUAL REGRESSION TIME
20 X
Simplifying assumption –
Manual test duration = Automated test duration
2 WEEKS > 3 DAYS = NOT ENOUGH PLATFORMS!
14. VELOCITY
COVERAGE
CAPACITY
EACH DEVICE EXECUTING 2000 TEST CASES
3 DAYS
DESIRED REGRESSION TIME
Q: HOW MANY ADDITIONAL RESOURCES ARE NEEDED TO SHRINK TESTING
TIMELINE FROM 2 WEEKS DOWN TO DESIRED 3 DAYS?
2 WEEKS
ACTUAL REGRESSION TIME
16 X
PARALLEL
CAPACITY
? X ADDITIONAL
PLATFORMS
15. VELOCITY
REQUIRED
COVERAGE
EACH DEVICE EXECUTING 2000 TEST CASES
SOLUTION: 333 HOURS / 72 HOURS (3 DAYS)
= 4X ADDITIONAL PLATFORMS (16 X 4 = 64)
2 WEEKS
DESIRED = ACTUAL REGRESSION TIME
16 X
ADD PARALLEL
CAPACITY
64 X ADDITIONAL
PLATFORMS
16. VELOCITY
COVERAGE
CAPACITY
EACH DEVICE EXECUTING 2000 TEST CASES
NOTE: RECOMMENDED IS A MULTIPLE OF THE COVERAGE SET: 16 * 3 = 48 (ROUNDING UP FROM 72).
EXTRA PLATFORMS CAN BE USED FOR MANUAL TESTING AND SCRIPTING
3 DAYS
DESIRED = ACTUAL REGRESSION TIME
16 X
PARALLEL
CAPACITY
64 X ADDITIONAL
PLATFORMS
17. Use business logic to tune coverage to match desired feedback window
• Prioritize test cases (H, M, L) & platforms (Primary, Secondary) into groups
• Execute High & Medium priority test cases on both platform groups
• Execute low priority test cases on primary platforms only
100 Critical Path Tests
700 High Priority Tests
1,200 Low Priority Tests
ALL TESTS (2,000) WILL RUN ON
PRIMARY DEVICES
PRIORITY TESTS (800) WILL RUN ON
PRIMARY AND SECONDARY DEVICES
{ }
VELOCITY
18. PRIMARY
DEVICES
48 + 8 = 56 TOTAL DEVICES FOR OPTIMIZED COVERAGE
15% RIGHT SIZING BENEFIT TO THE CUSTOMER
SECONDARY
DEVICES
48 X
8 X
12 DEVICE TYPES
ALL TESTS
4 DEVICE TYPES
PRIORITY TESTS
10 MIN * 800 TEST CASES = 34 HOURS (185% OF 72 HOURS)
2 DEVICES OF EACH MODEL ARE SUFFICIENT FOR SECONDARY
10 MIN * 2,000 TEST CASES = 67 HOURS (463% OF 72 HOURS)
4 DEVICES OF EACH MODEL STILL NEEDED FOR PRIMARY
VELOCITY
19. VELOCITY
TO MEET THE CUSTOMERS OBJECTIVE
COVERAGE =
16 UNIQUE
PLATFORMS
VELOCITY =
56 PLATFORMS
IN AN OPTIMIZED LAB
22. SALES STRATEGY
• Get agreement from different group heads on
required number of Platforms before EB G/NG
MINIMUM DEVICE SET
• 12 Tier 1 Platforms (35% customer’s coverage)
MULTIPLIERS
• SDLC stages: DRR, Build
• Manual testers
• Additional Tier 2 Platforms for spot checks
EXAMPLE: USAA
23. SALES STRATEGY
• Align to company-wide BT2020 initiative
• Present different sizing options and a
ramp-up strategy
MINIMUM DEVICE SET
• 27 Tier 1 Platforms (customer marketing
data)
MULTIPLIERS
• Test types: full regression, nightly smoke
• Persona-based testing
EXAMPLE: DISCOVER
24. VELOCITY
Q: The customer doesn’t know the average test
case execution time. What do I do now?
You can calculate average test case execution
time by using the following current state
metrics: # of testers, # of Platforms under test,
duration of test cycle, # of test cases, tester
productivity (% of manual tester’s time actually
spent testing)
Today, it takes 5 manual FTEs 2.5 weeks (100
hours) to execute a partial regression (400 test
cases) on 10 Platforms. On average, testers
spend 70% of their time testing.
A:
EX:
26. VELOCITY
APPLICATIONS ENVIRONMENTS LOCALIZATION TEST TYPES PEOPLE
GATHER RELEVANT METRICS
# ENVIRONMENTS
# BACKENDS
# APPLICATIONS
# APP VERSIONS
% TC GROWTH
# REGIONS
# LANGUAGES
SMOKE
REGRESSION
PERFORMANCE
PERSONA
MULTIPLE TEAMS
MANUAL TESTERS
OFFSHORE
Editor's Notes
With priorities in place, we get the following revised calculations:
Primary devices will run all test cases (67 hours). There are 9 device models, multiplied by 4 (to fit the 18-hour window), we will need 36 Primary devices
Secondary devices will run priority test cases (34 hours). There are 7 device models multiplied by 2, so we will need 14 secondary devices.
This reduces the lab size from 64 to 50 devices (a 21.8% reduction) by excluding some test/device combinations while minimizing overall risk.