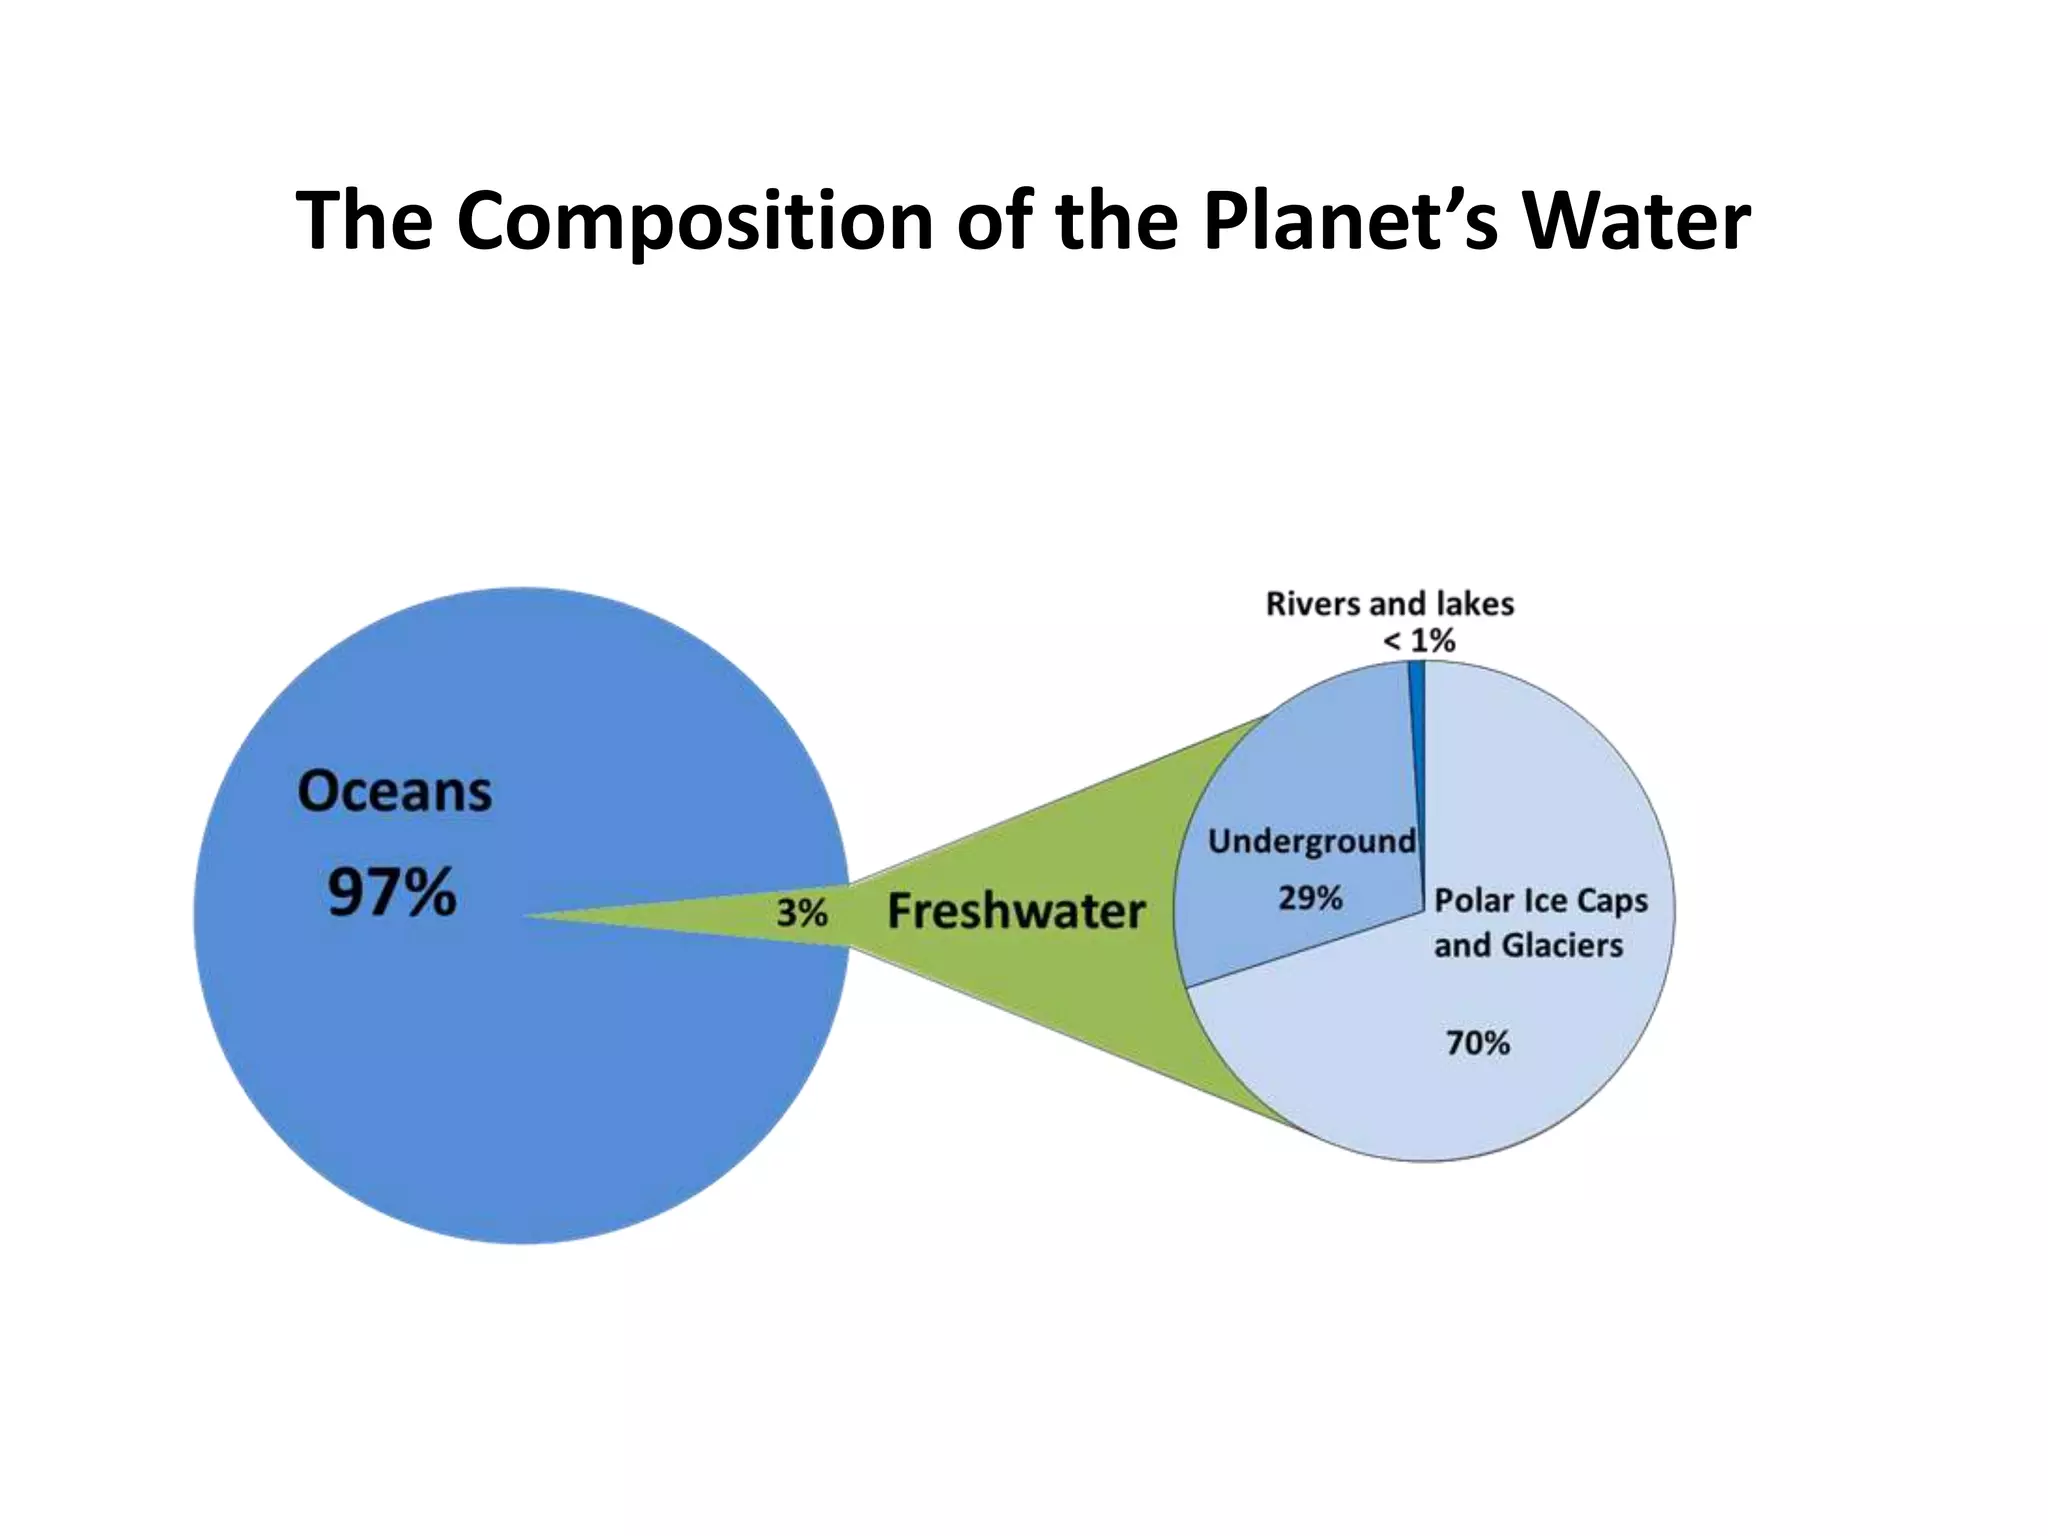
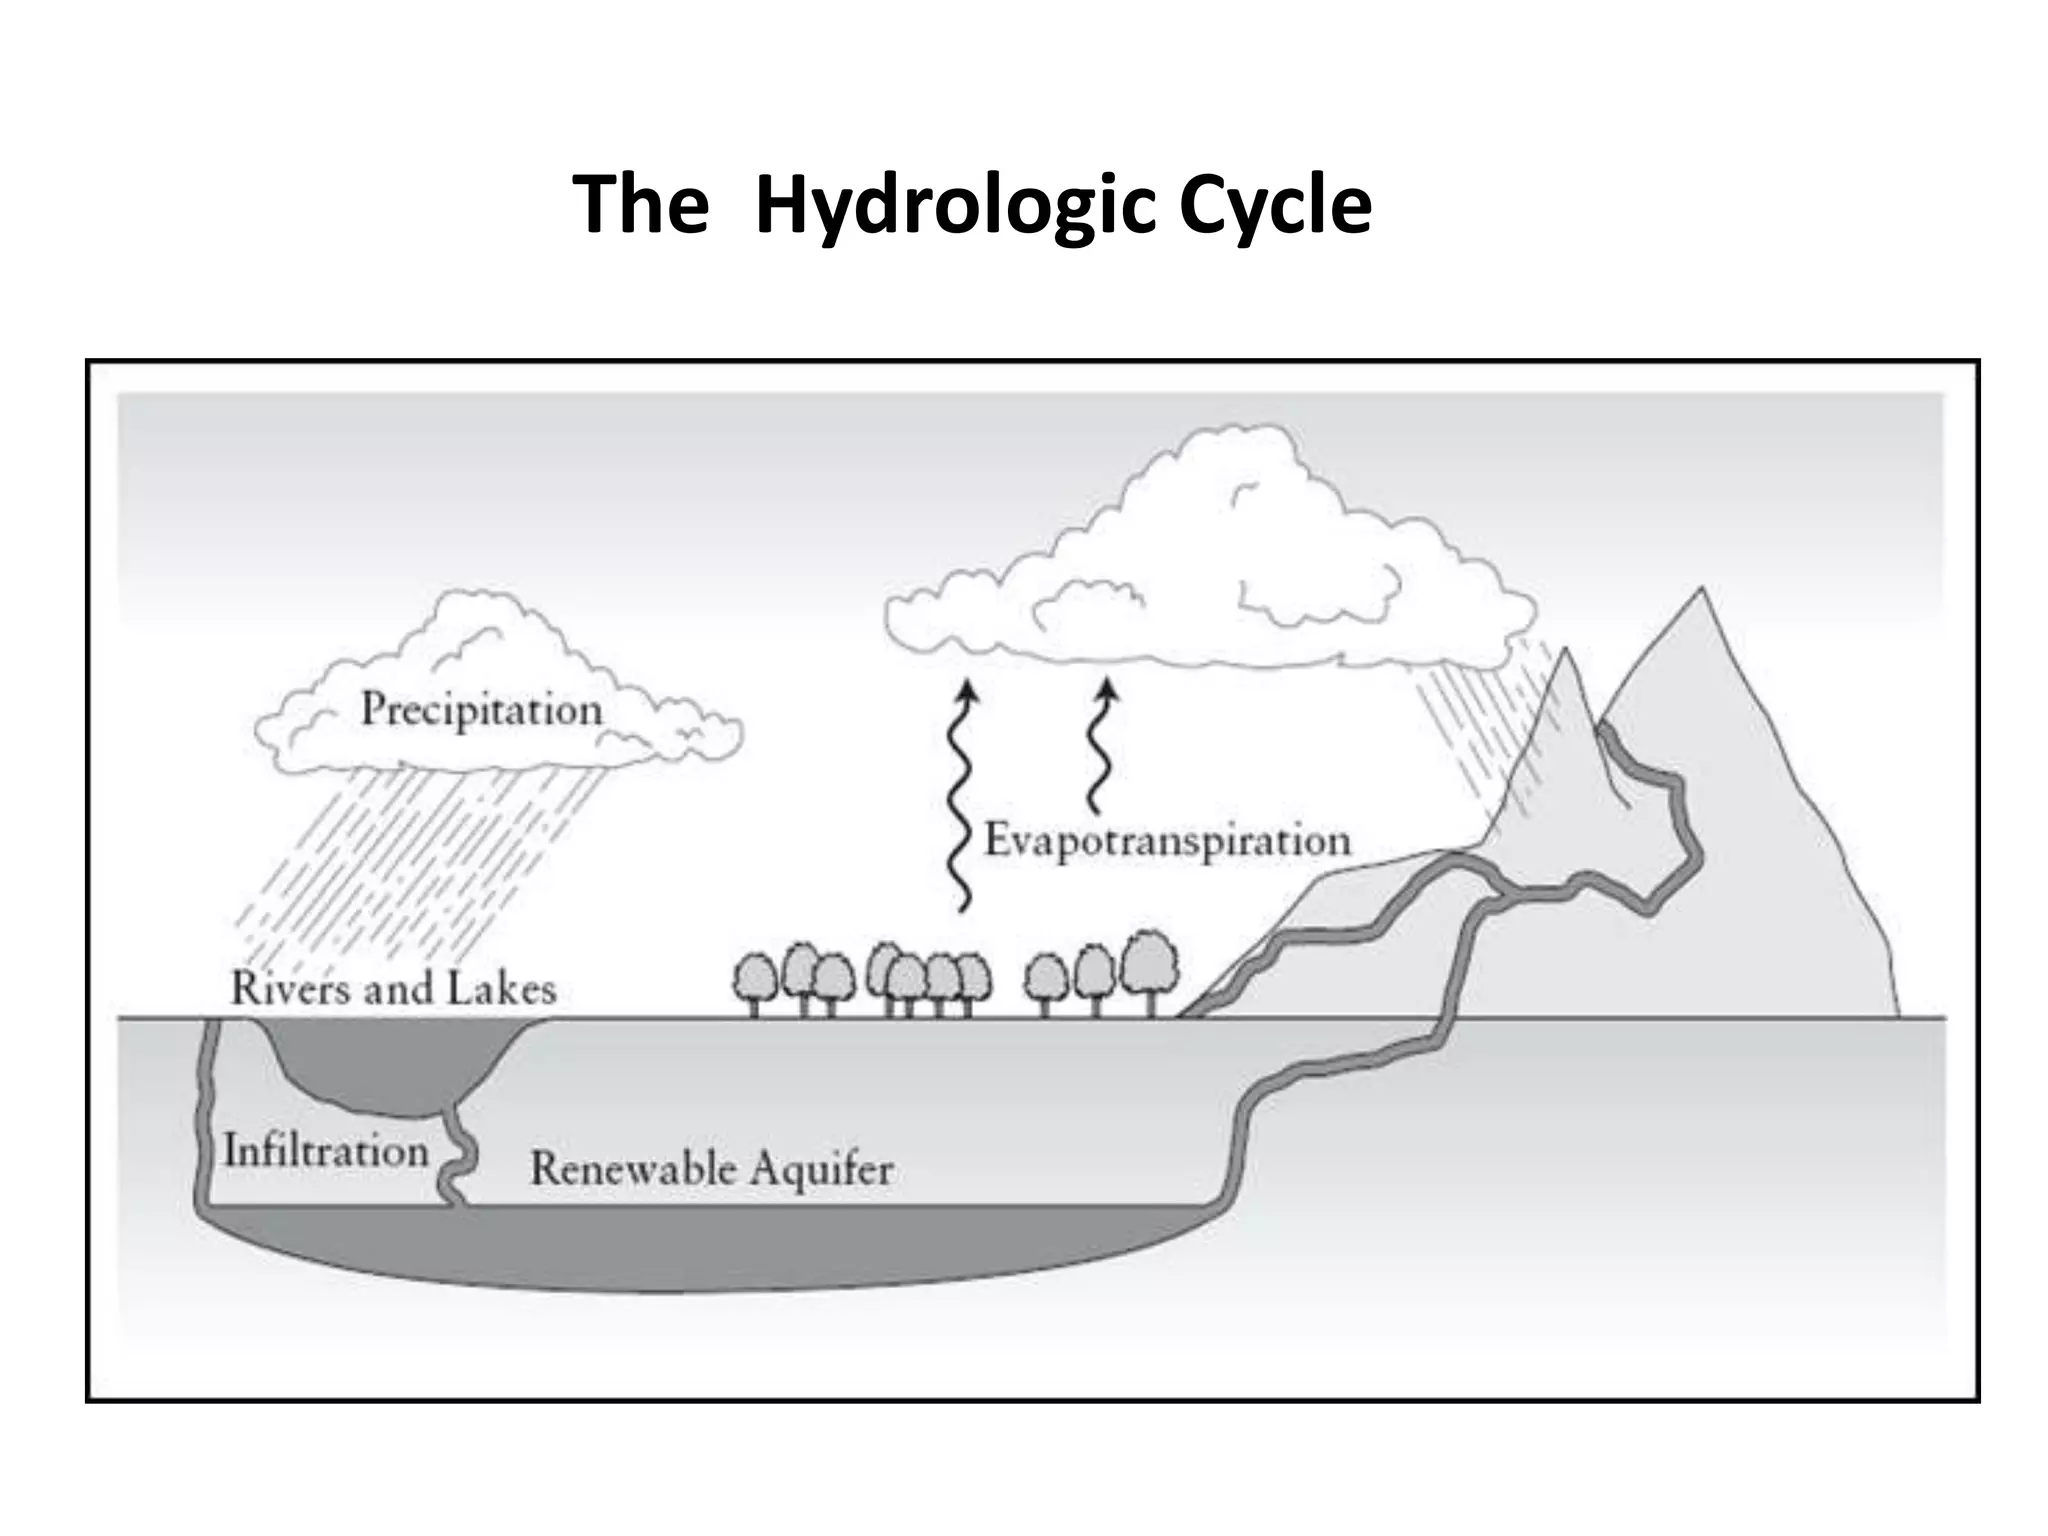
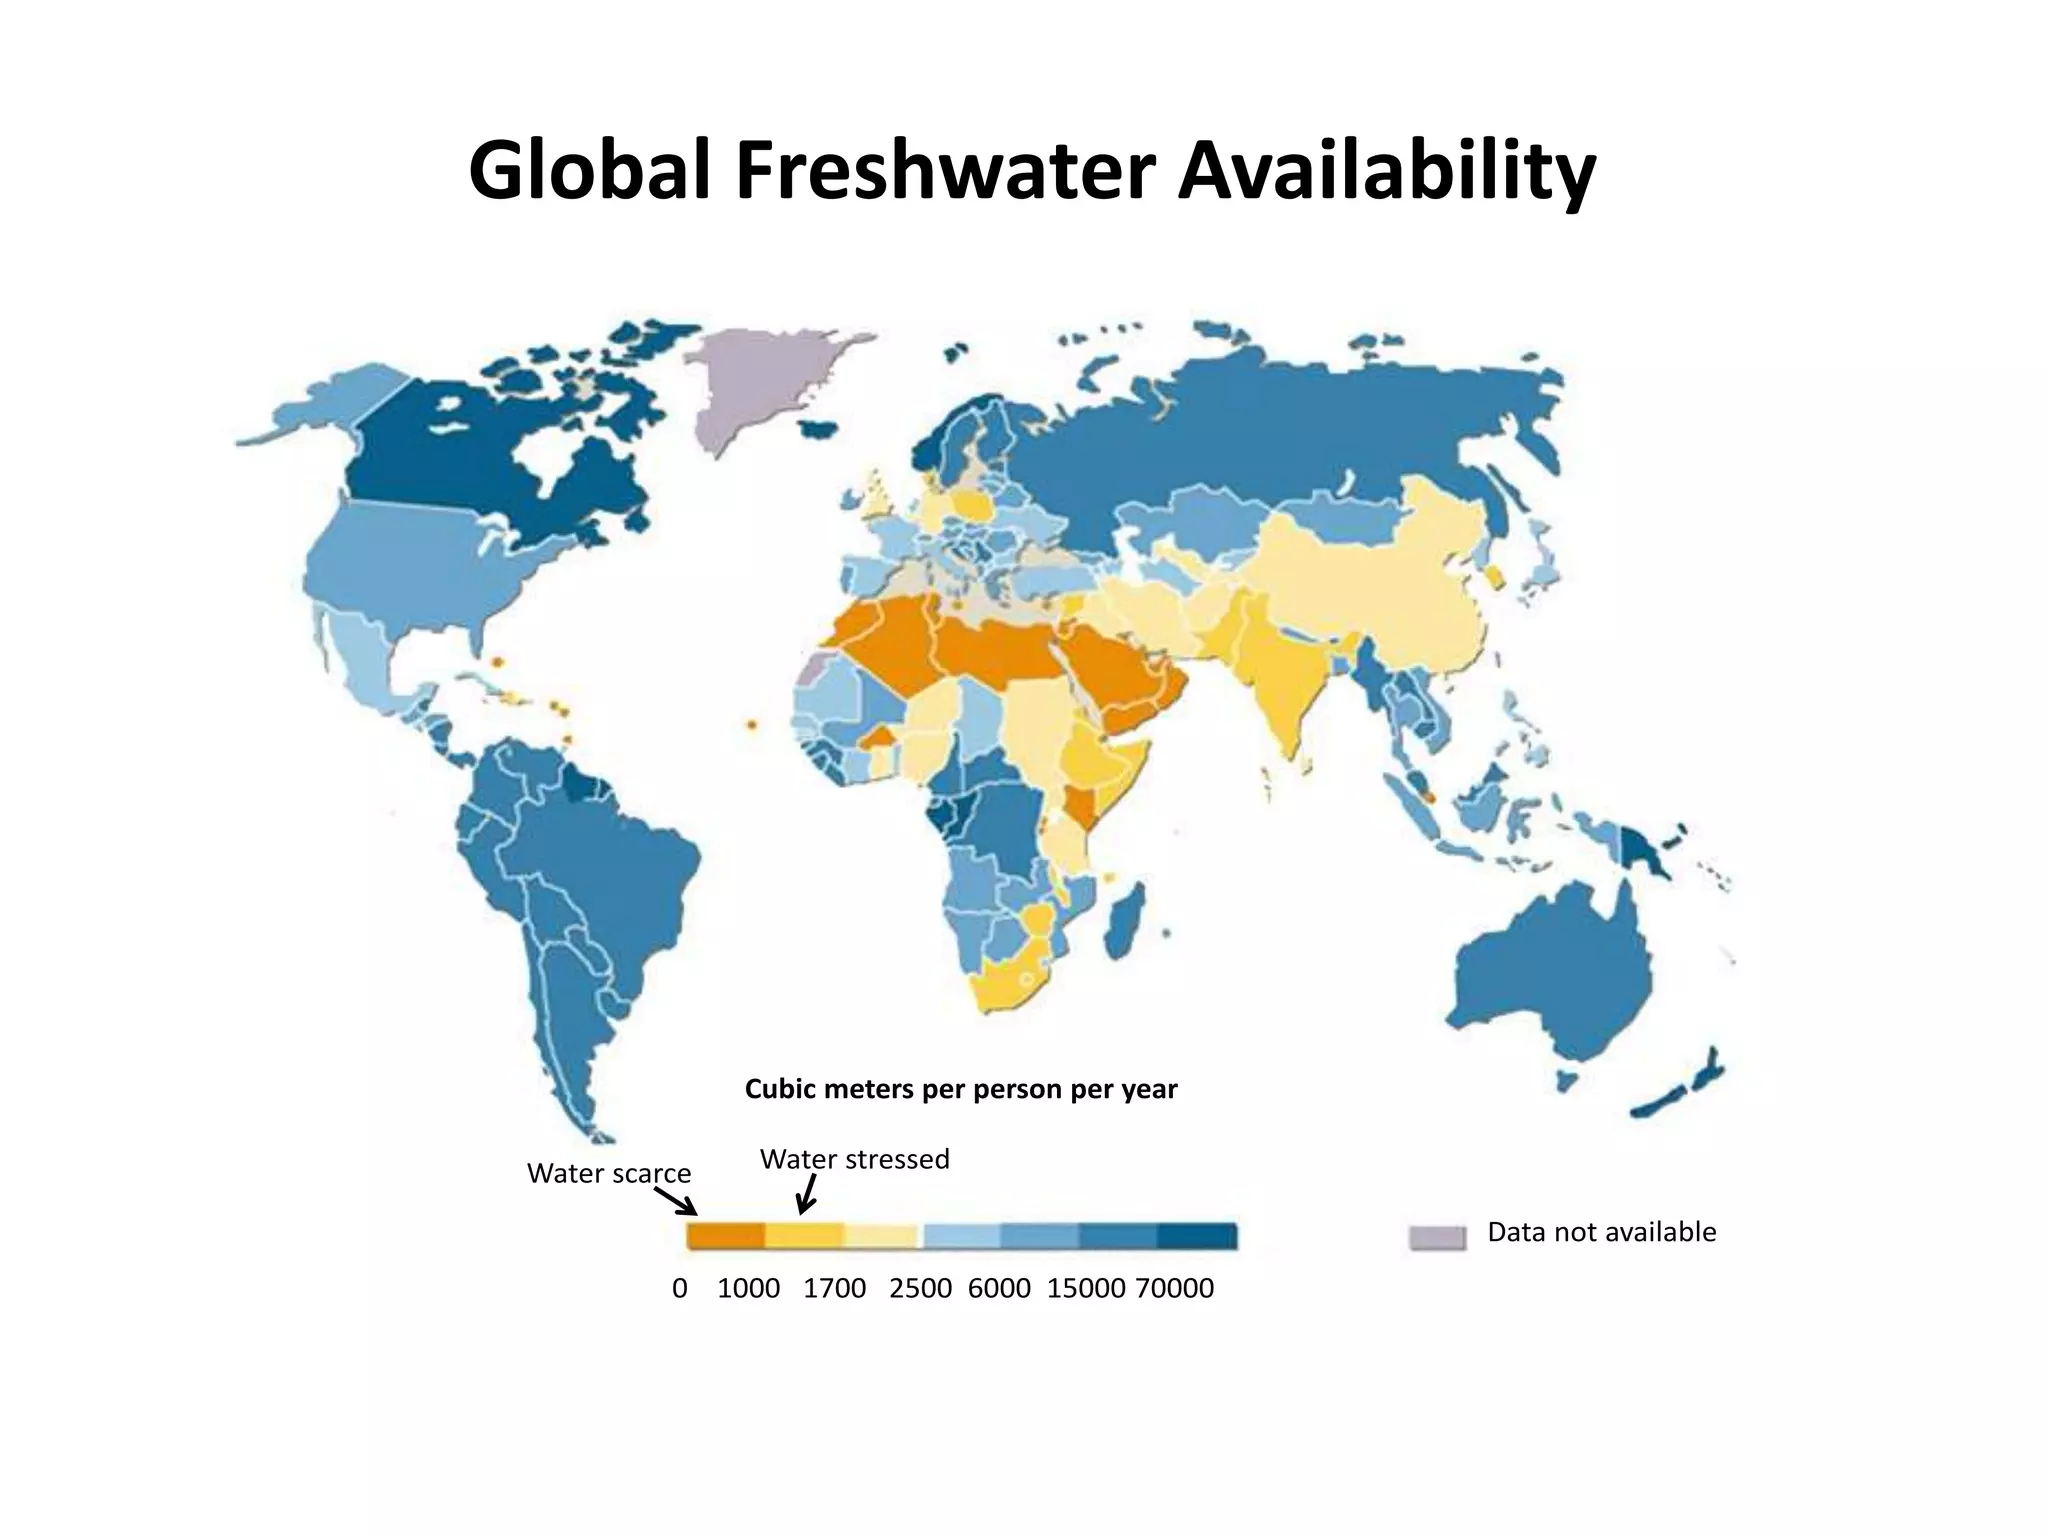
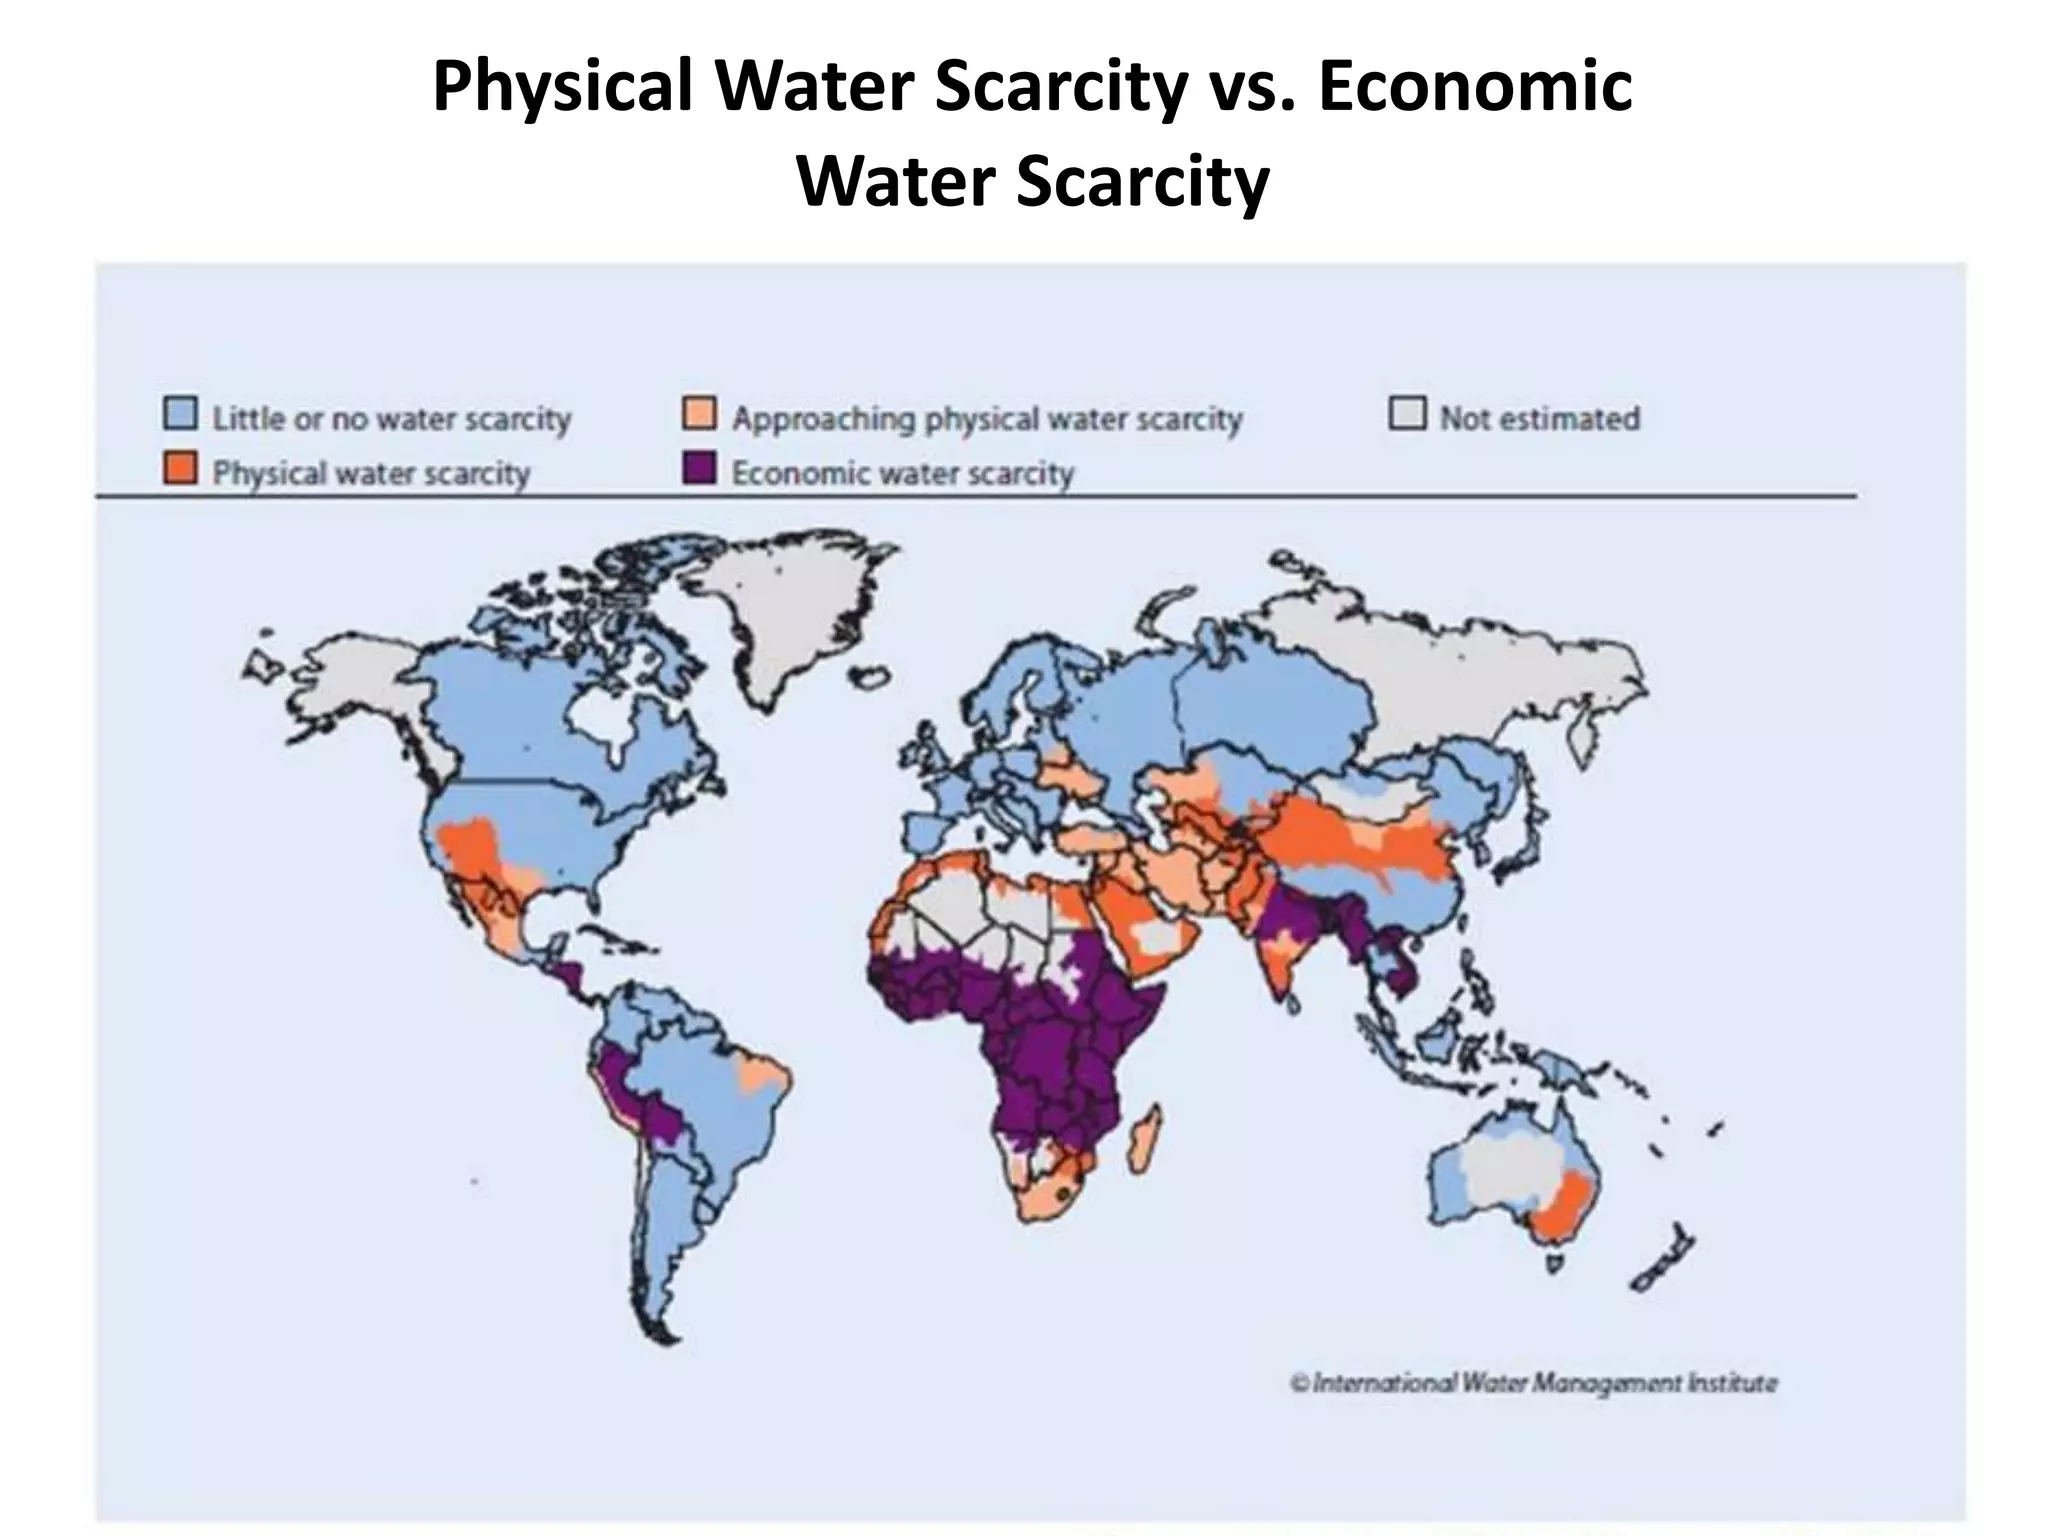
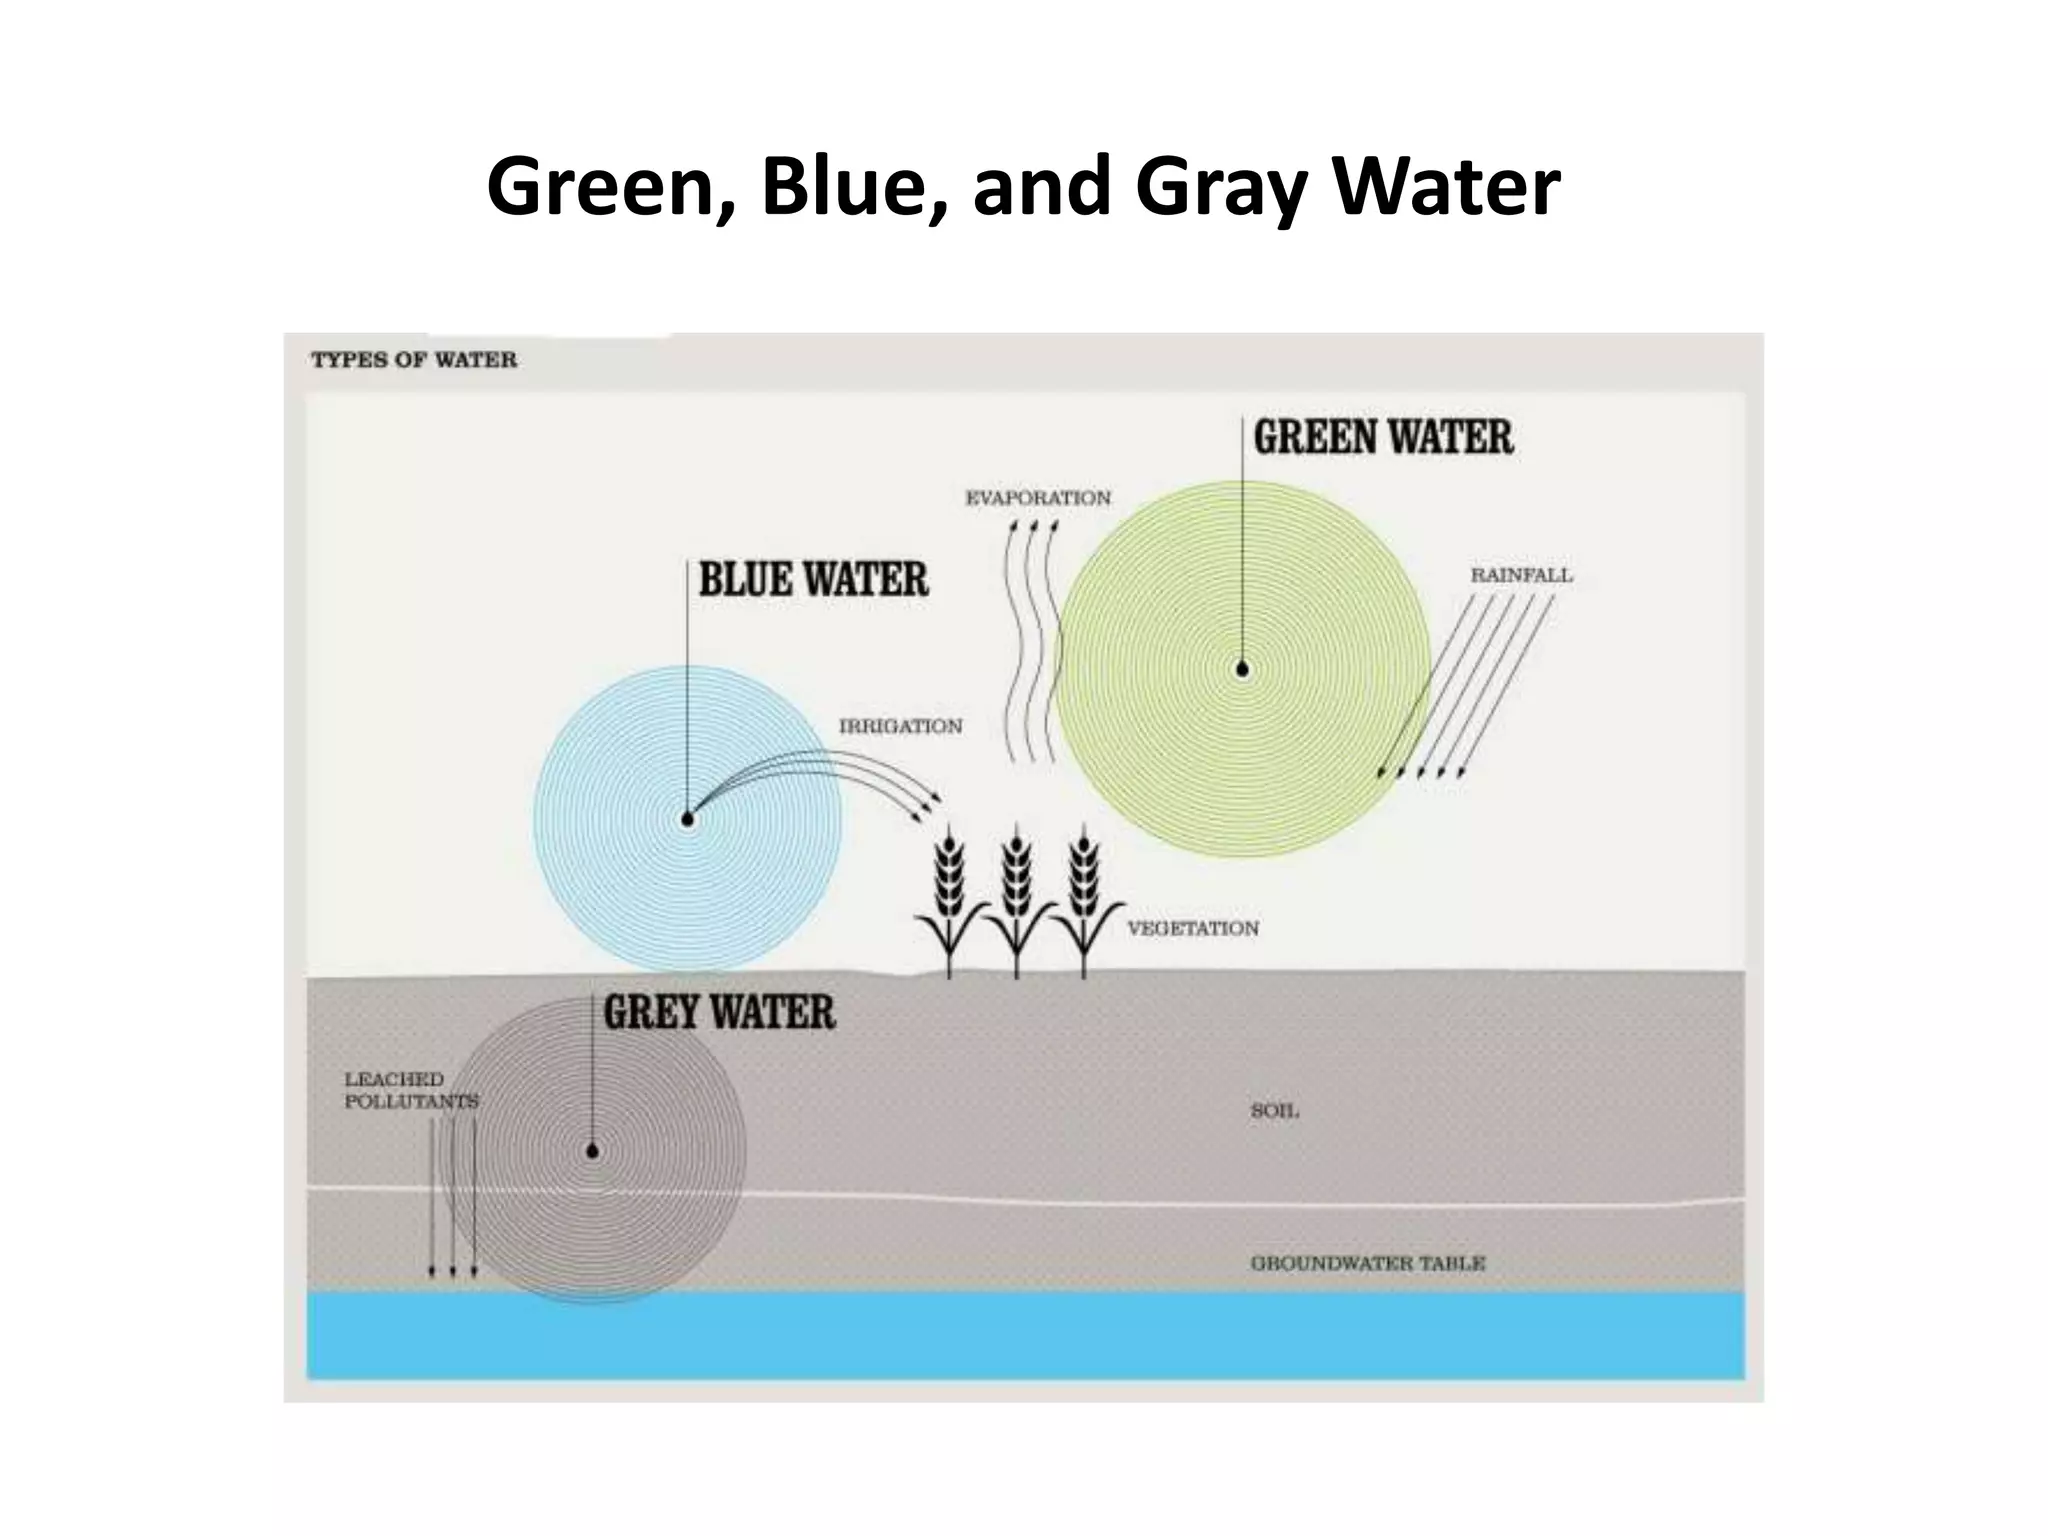
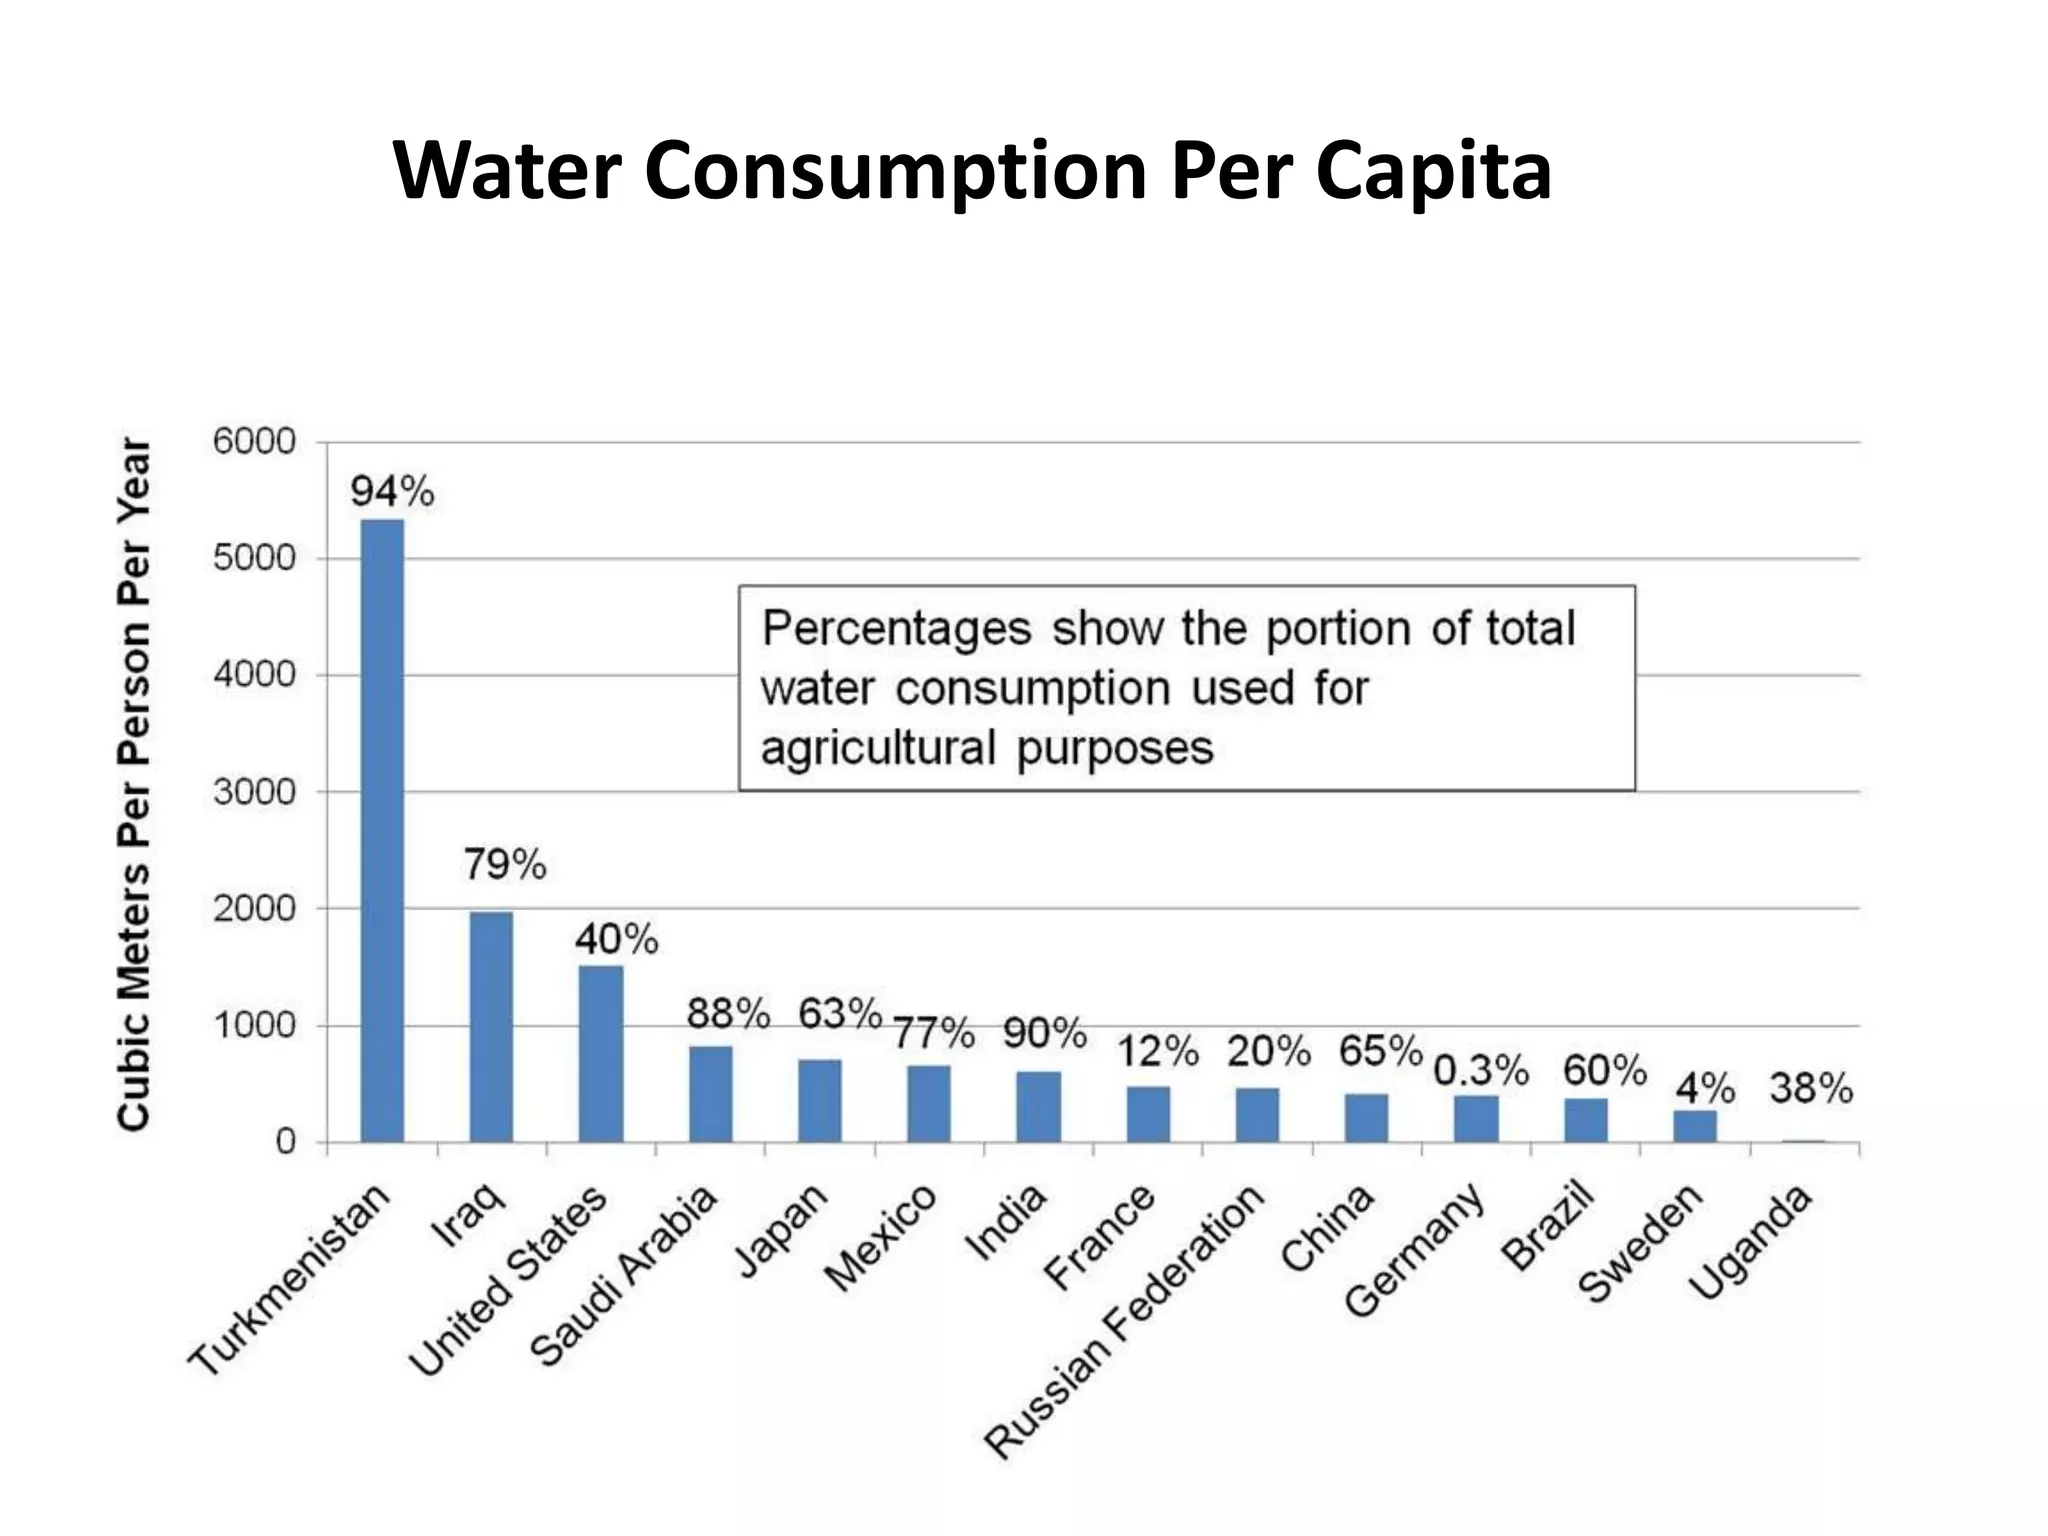
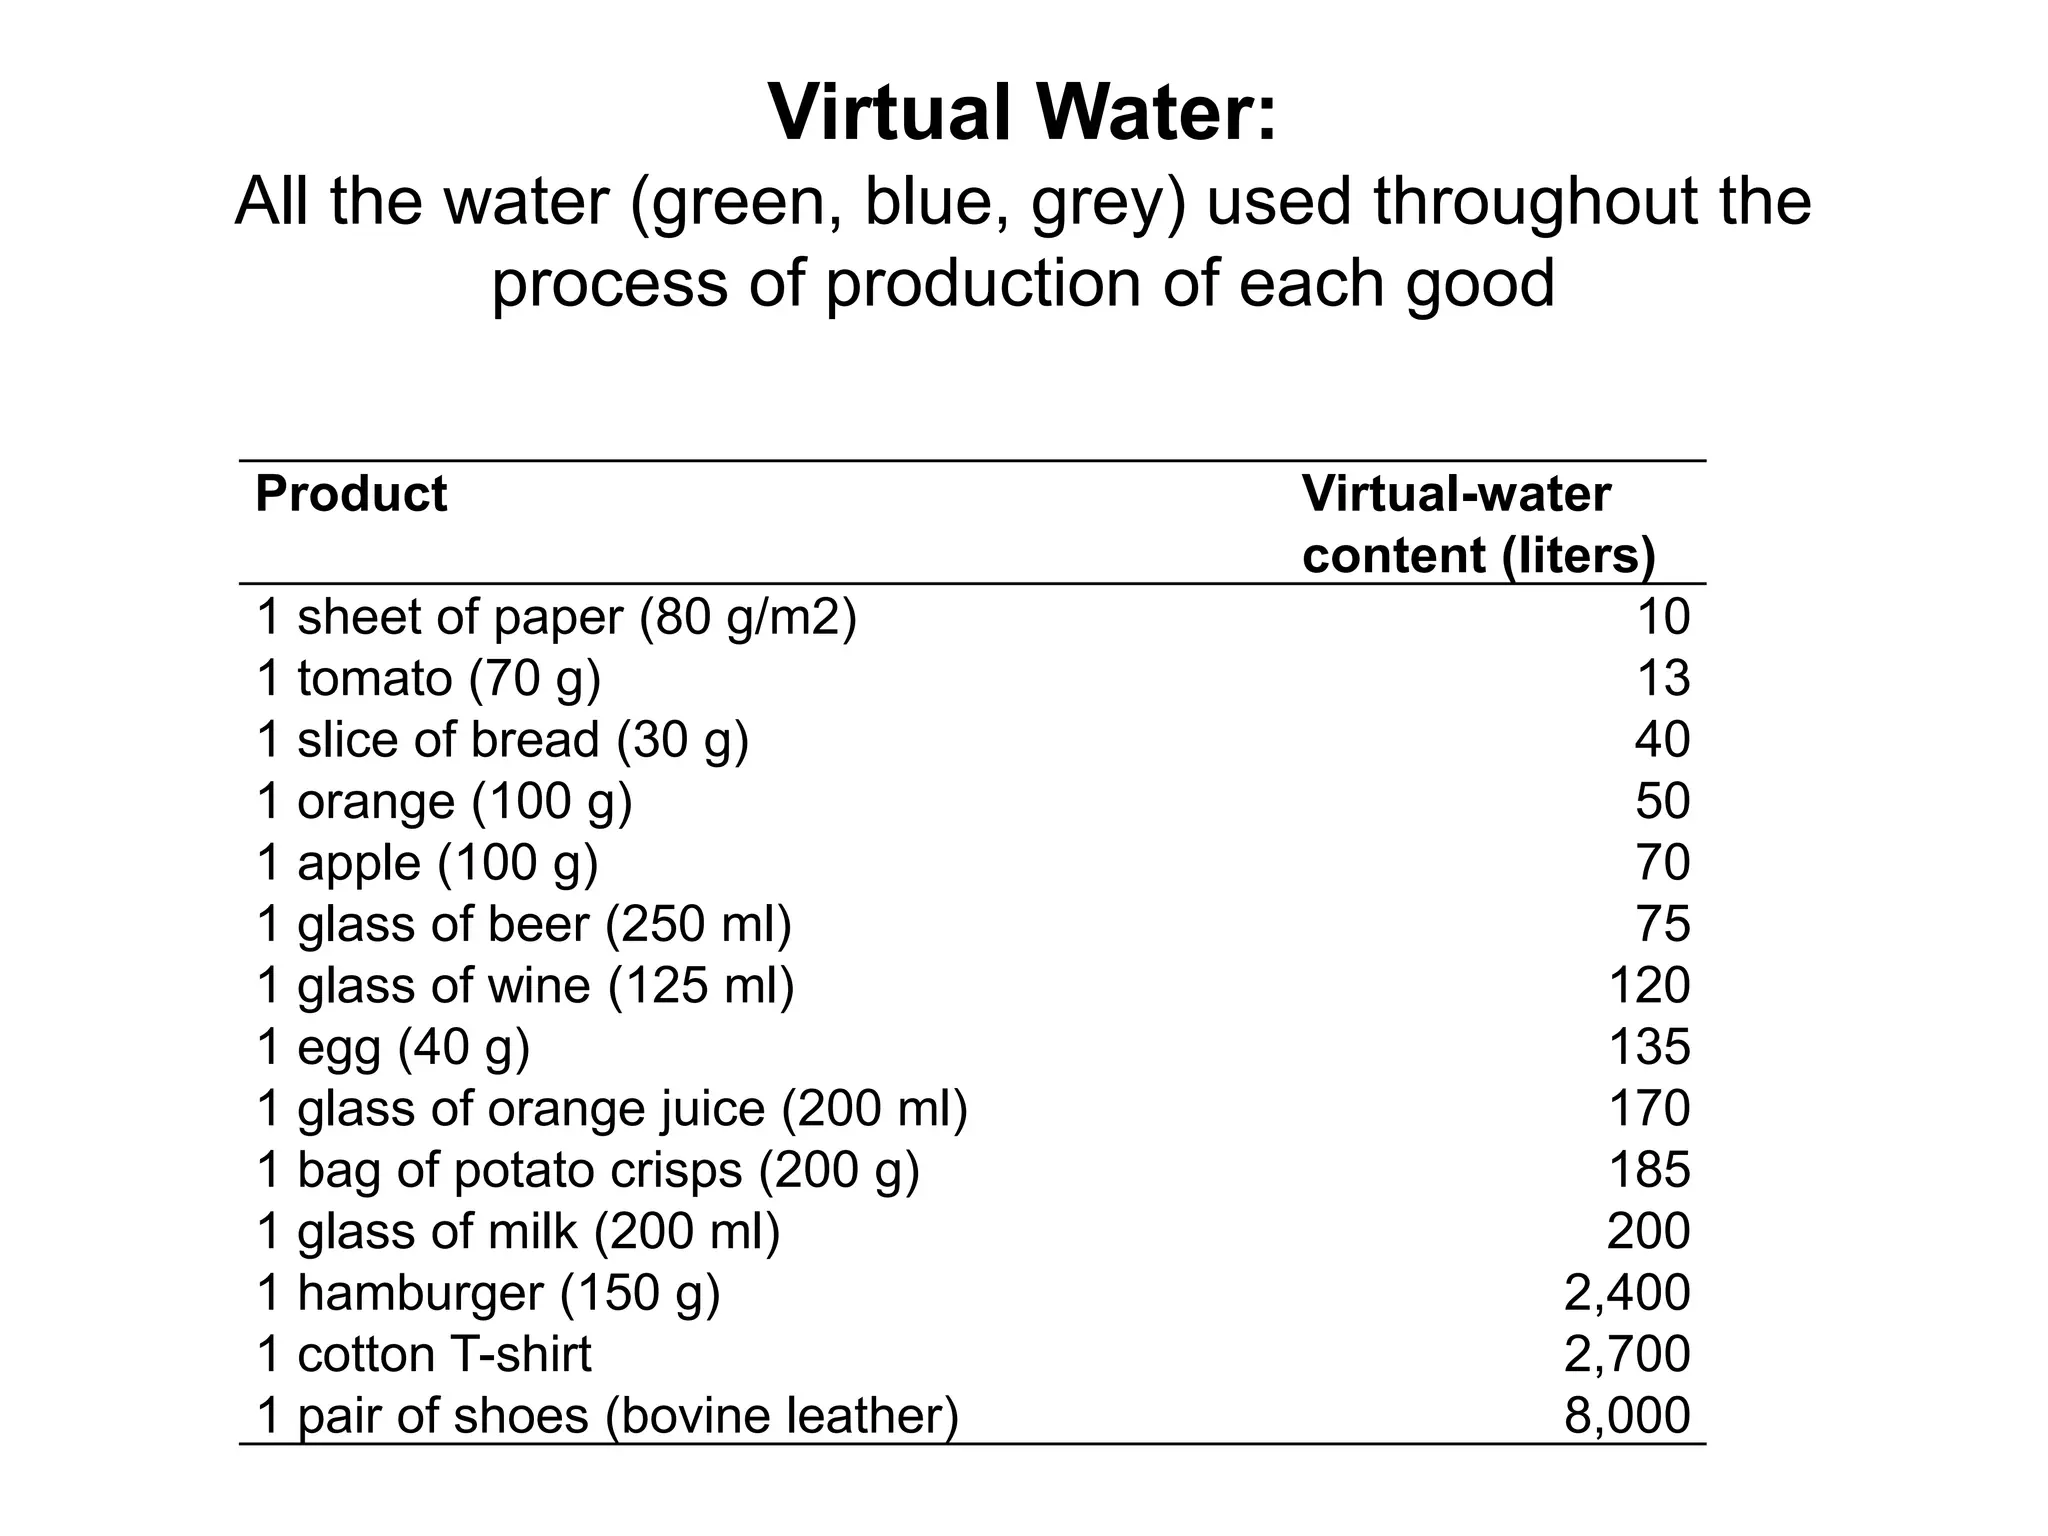
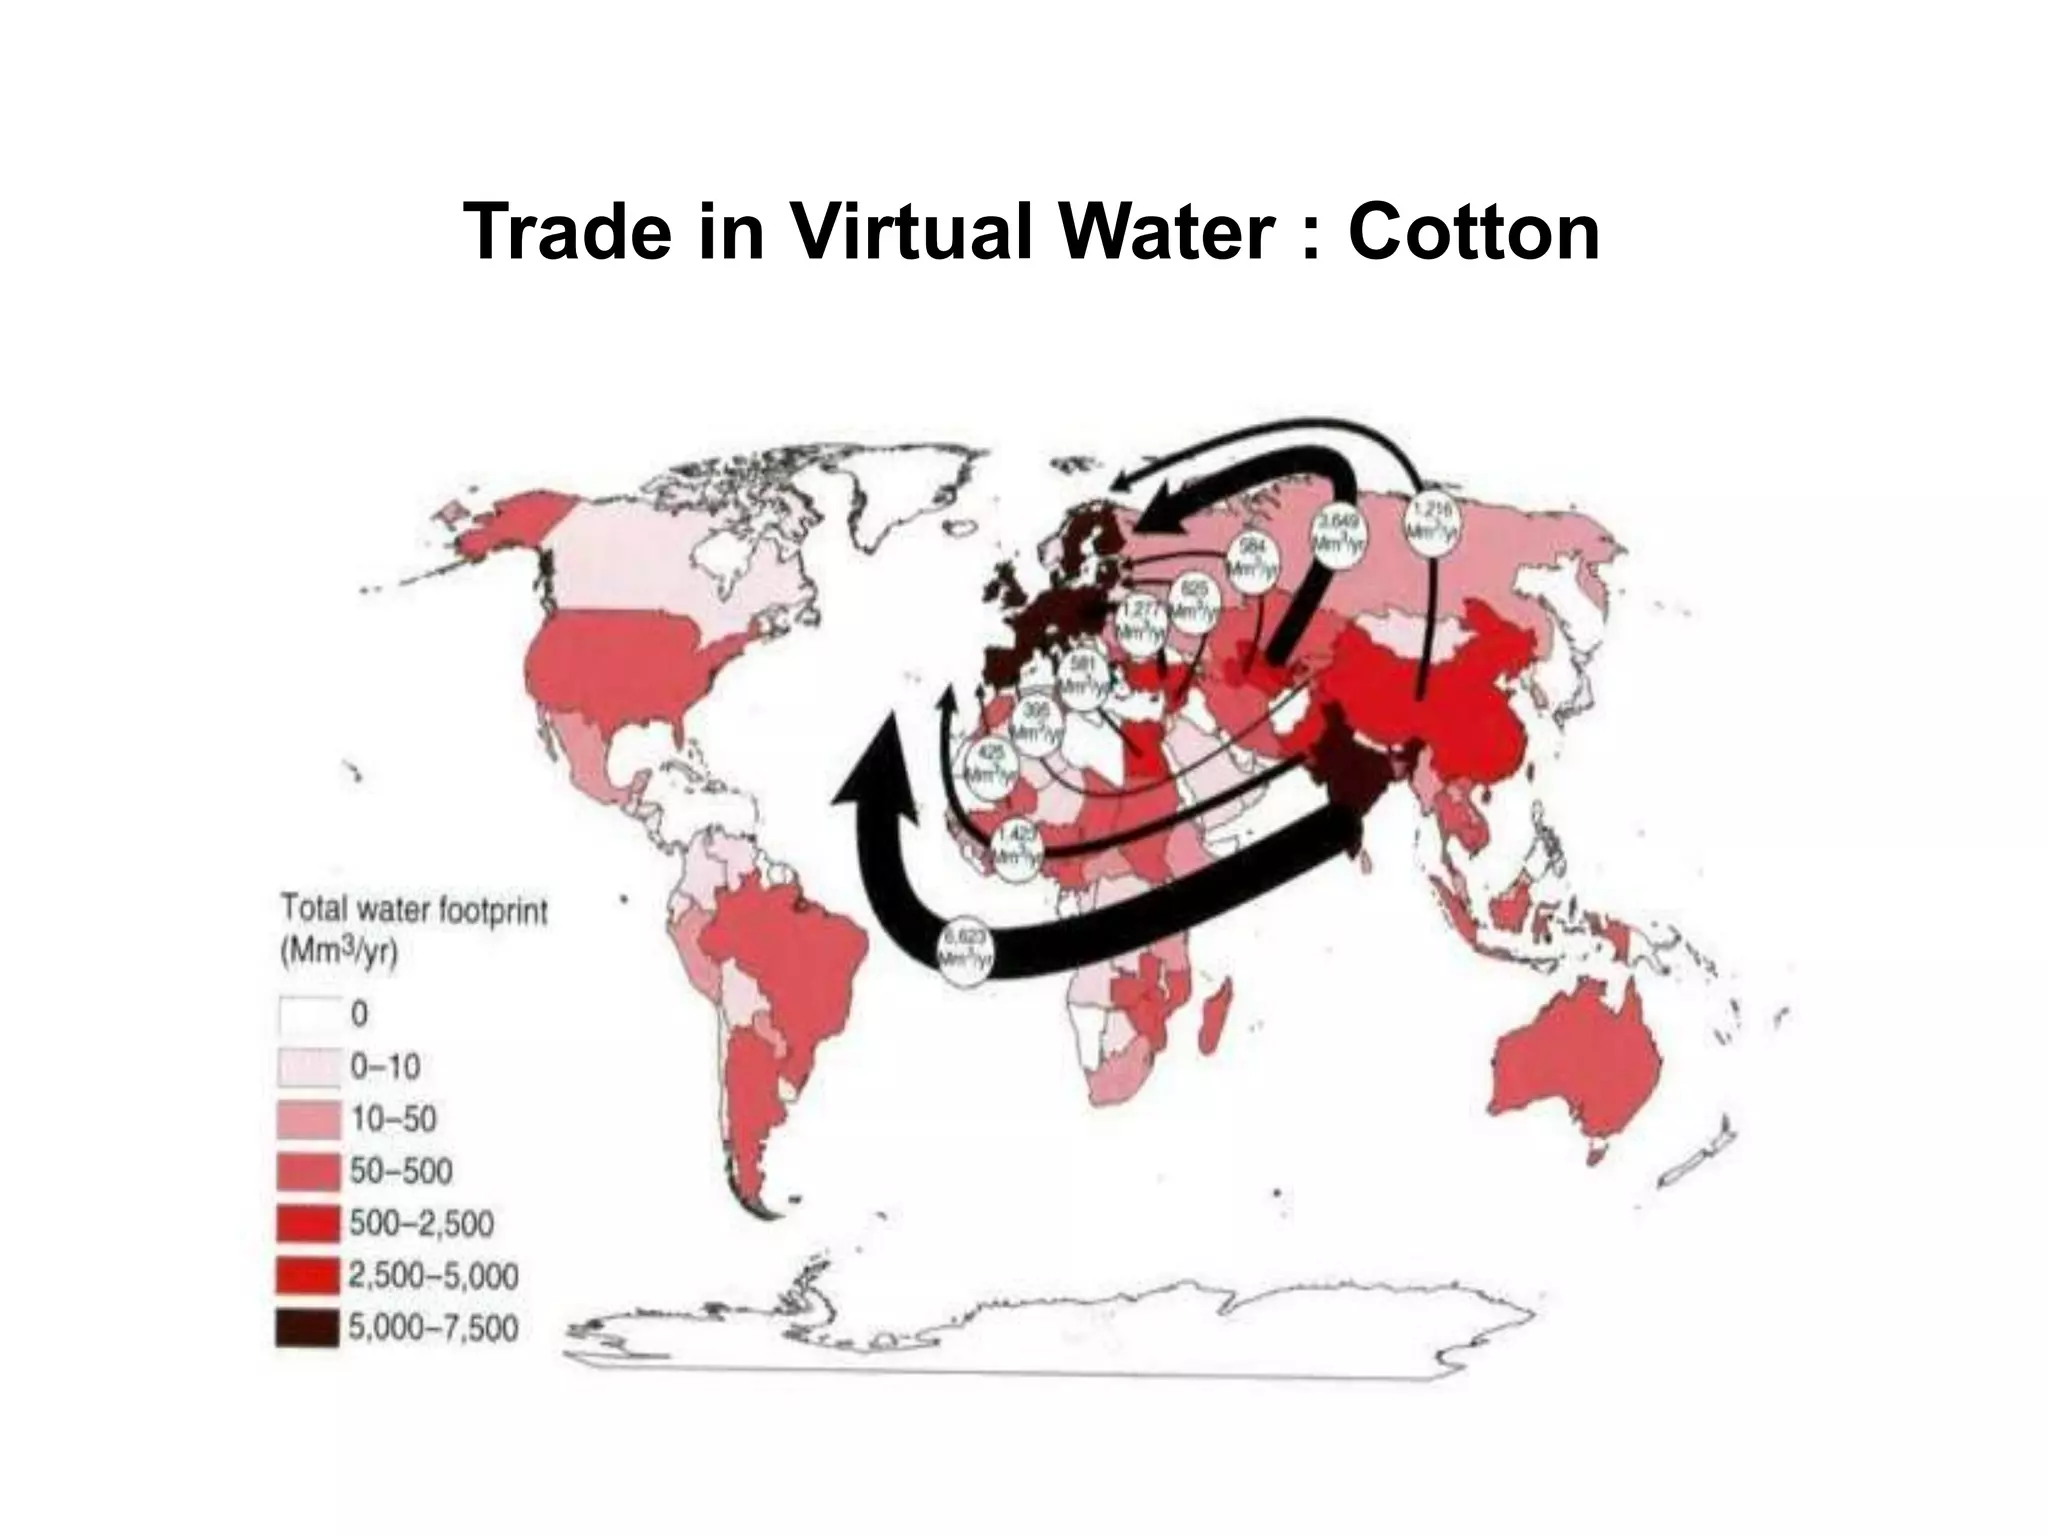
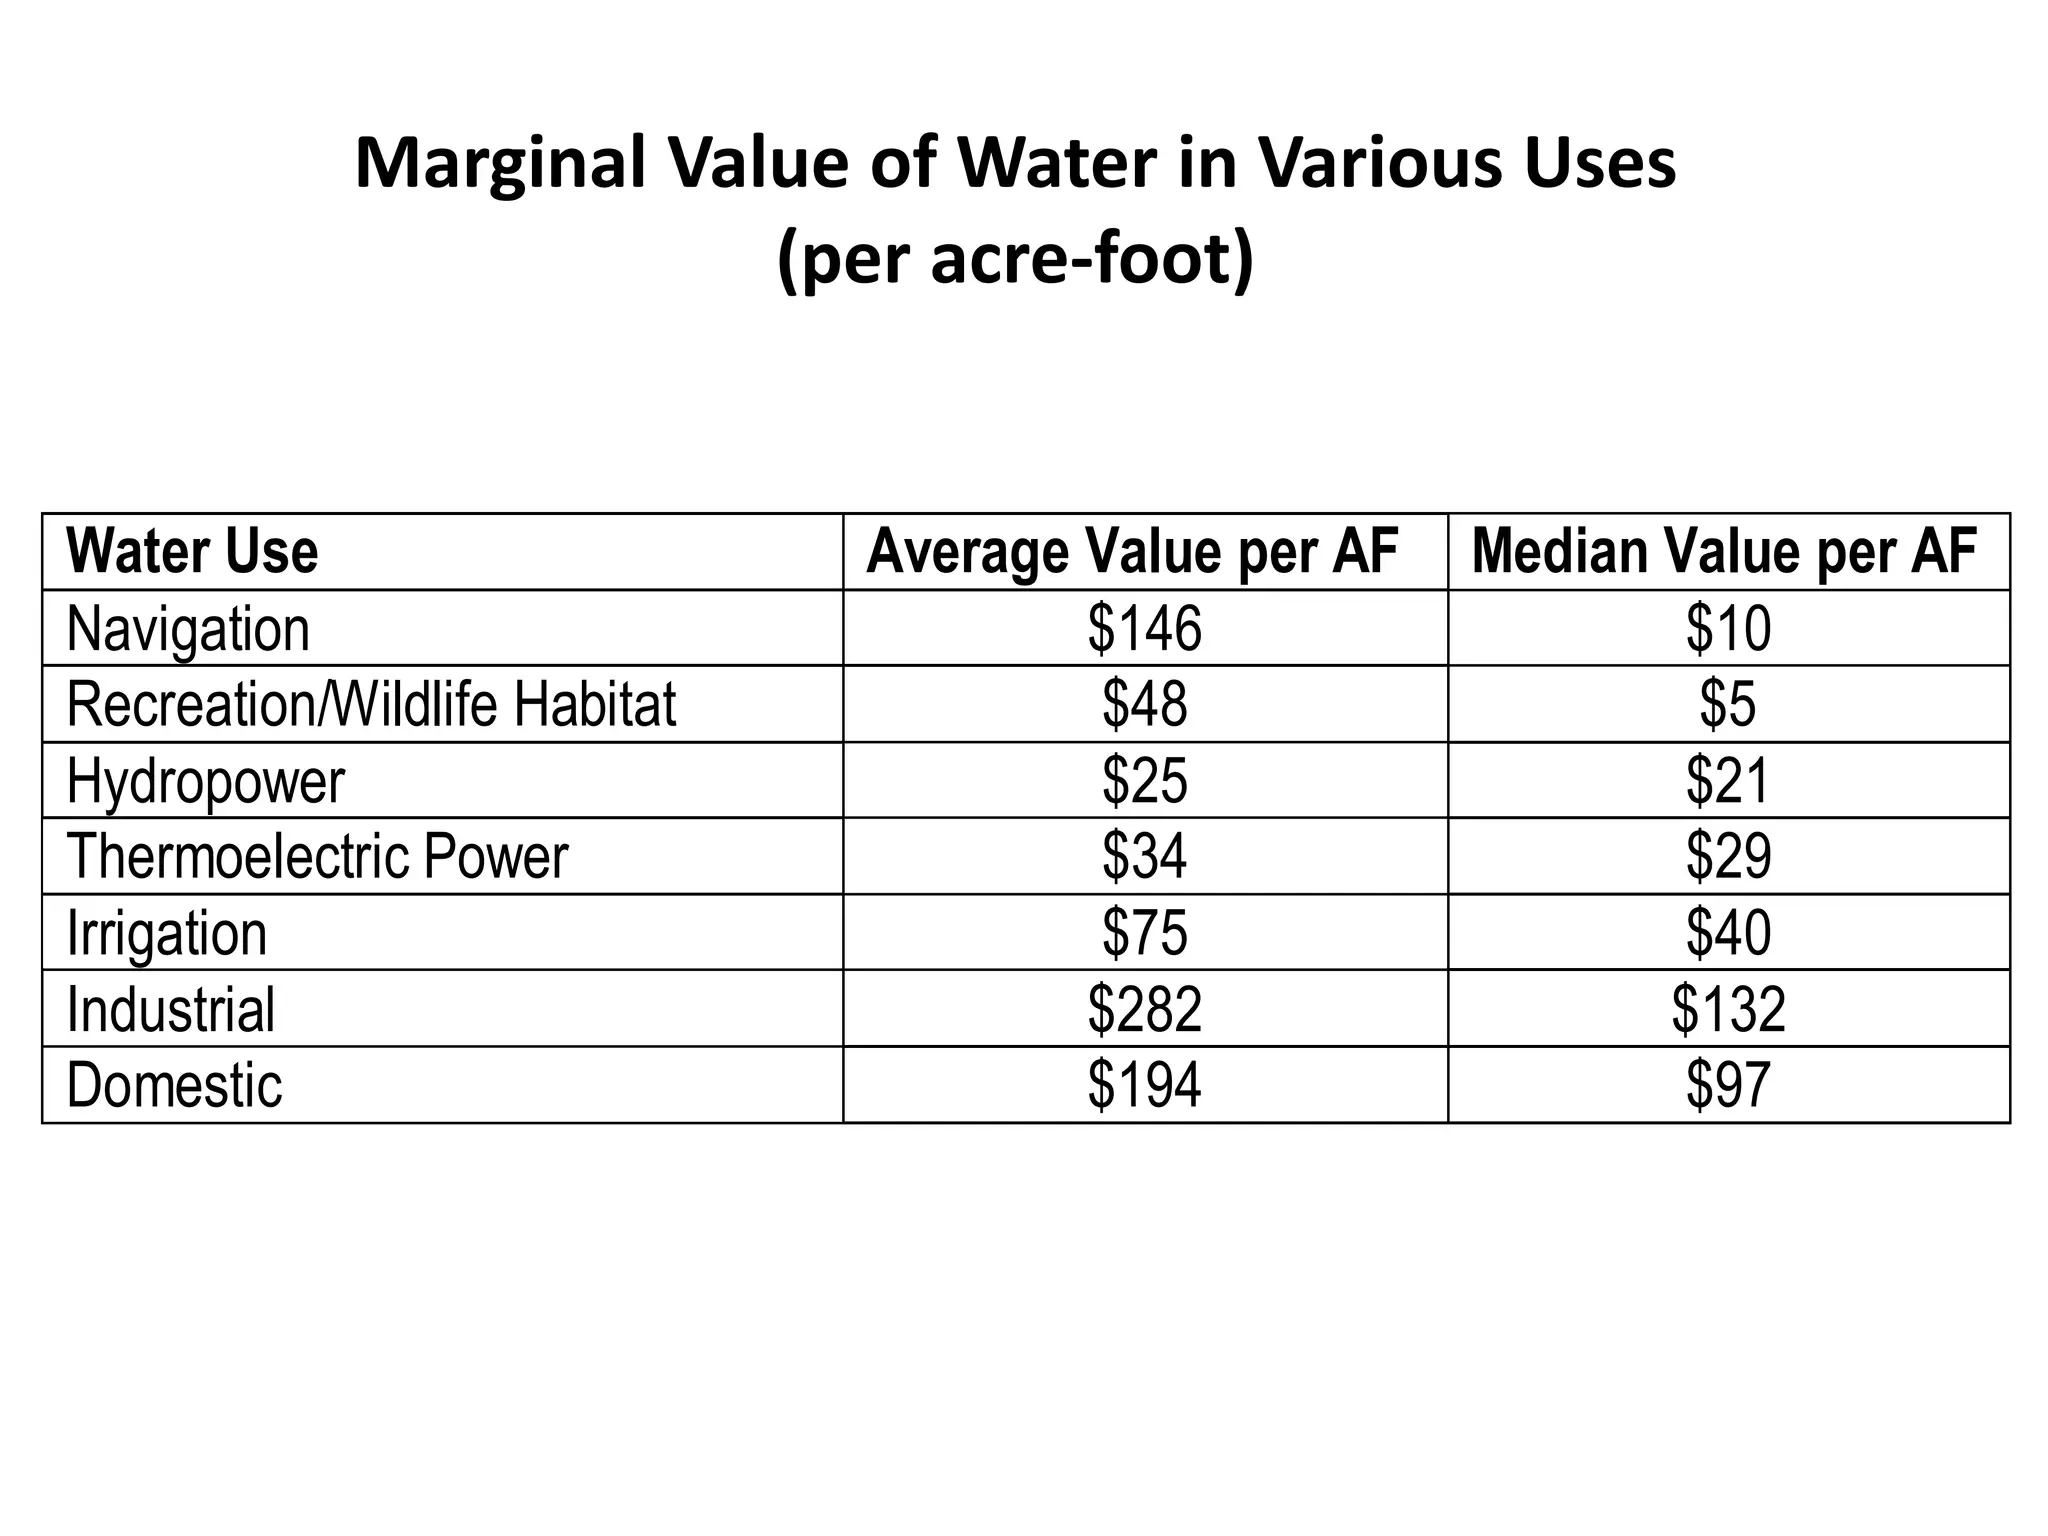
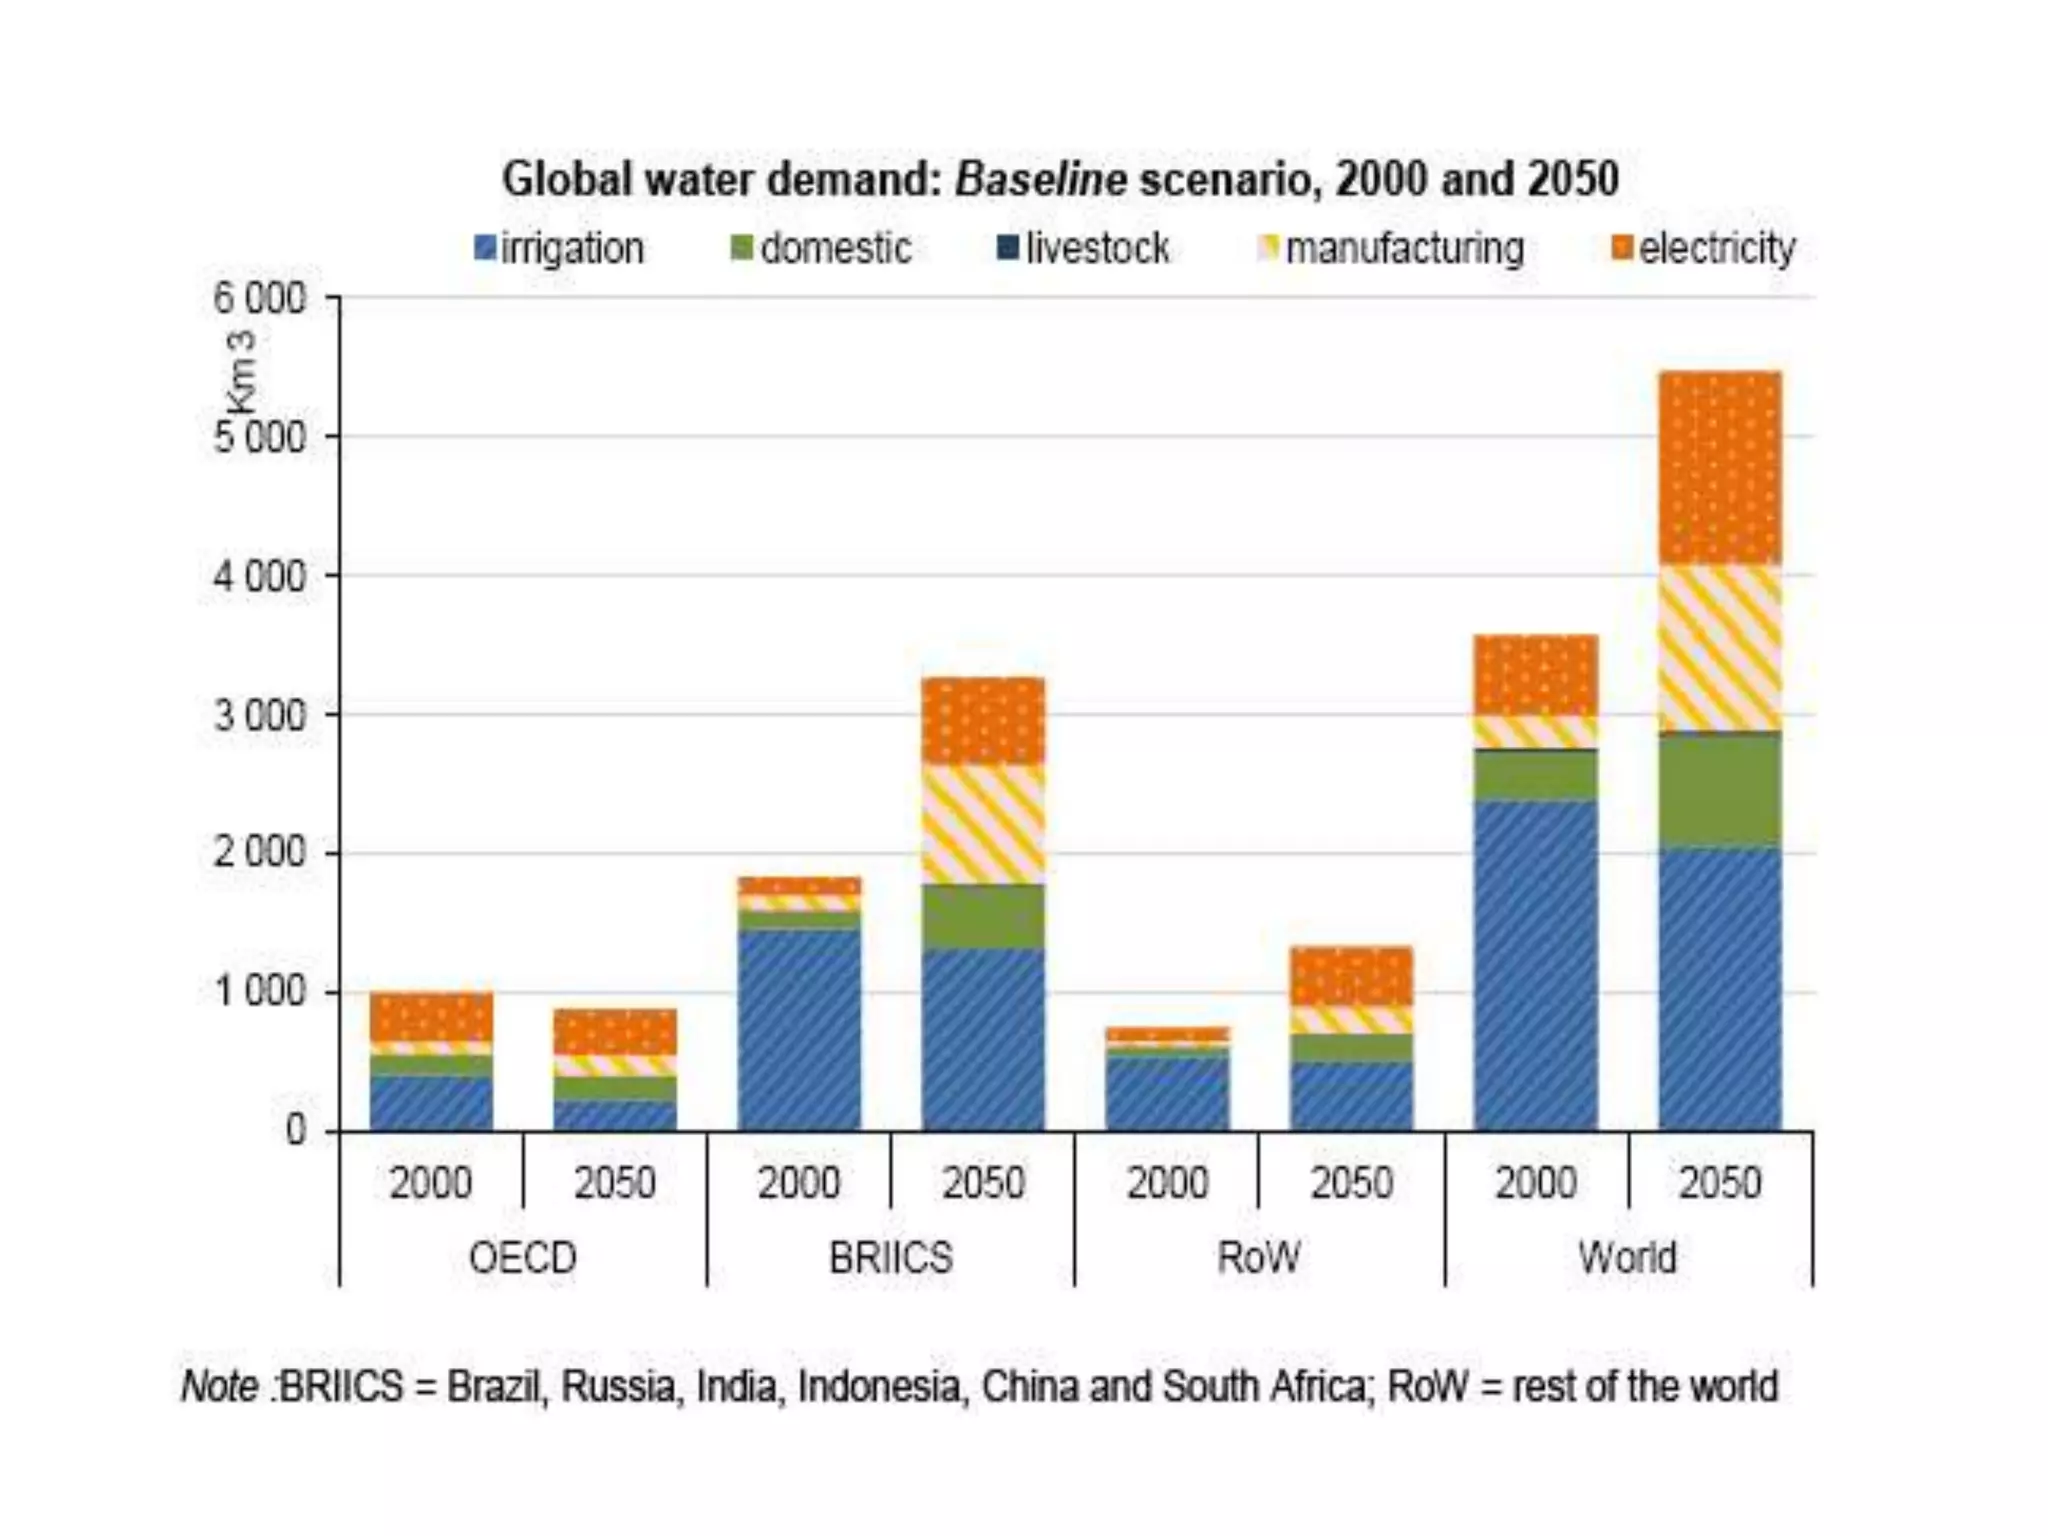
6. Region Average water availability
(cubic meters/person)
Middle East and North Africa 500
Sub-Saharan Africa 1,000
Caribbean 2,466
Asia/Pacific 2,970
Europe 4,741
Latin America 7,200
North America (including Mexico) 13,401
Water Availability per region (2012)
10. Virtual Water:
All the water (green, blue, grey) used throughout the
process of production of each good
Product Virtual-water
content (liters)
1 sheet of paper (80 g/m2) 10
1 tomato (70 g) 13
1 slice of bread (30 g) 40
1 orange (100 g) 50
1 apple (100 g) 70
1 glass of beer (250 ml) 75
1 glass of wine (125 ml) 120
1 egg (40 g) 135
1 glass of orange juice (200 ml) 170
1 bag of potato crisps (200 g) 185
1 glass of milk (200 ml) 200
1 hamburger (150 g) 2,400
1 cotton T-shirt 2,700
1 pair of shoes (bovine leather) 8,000
11. Type of fuel
Amount of water needed in the
extraction/production of 2 Million
BTUs of energy
Natural Gas (conventional) 5 gallons
Unconventional natural gas (shale) 33 gallons
Oil (conventional) 32 gallons
Oil tar sands (mining) 616 gallons
Biofuel type 1 (irrigated corn) 35,616 gallons
Biofuel type 2 (irrigated soy) 100,591 gallons
Virtual water used in six types of fuels, for a
round trip New York City- Washington D.C.
12. Calculate your own water footprint
= direct water use + virtual water of all goods and services
http://www.gracelinks.org/1408/water-footprint-calculator
The average person living in the US consumes about 2220 gallons of water a day: That’s 44
bathtubs each day. Diet makes a big difference: a vegetarian’ water footprint can be less than
50% of a meat eater’s footprint.
16. Transfers of virtual water through trade
Virtual-water balance per country
(billion cubic meters)
17. 1,5 million people internally displaced
because of the 2006-2011 drought
March 2011: Anti-Assad
Revolution erupts
Water Scarcity and Conflicts: Syria
18. Two people, one land, one aquifer:
Water and the Israeli-Palestinian conflict
19. Addressing Water Shortages
Increasing water supply?
•Dams (dramatic ecological and social consequences).
•Pumping aquifers (20% aquifers are already being mined beyond their rate of
recharge, including the Upper Ganges Valley in India and Pakistan, the Nile Delta
Region in Egypt, and the Central Valley in California).
•Desalination: energy-intensive and costly.
Dealination in California: $1800-$2800 per AF
Groundwater: $375-$1100 per AF
Surface water: $400-$800 per AF
•Water Conservation
Micro-irrigation – reuse and recycle wastewater
Cost of conservation (San Diego county): $150-$1000 per AF
•How to promote water efficiency?
20. Demand
Supply (MC)
Marginal Social Cost (MSC)
Price
Quantity of Water
QS
QE
Q*
PE
PS
P*
A B C
Regulation by the market?
The market price of water and
the problem of subsidies for large irrigators
Subsidies to irrigation lead to a consumption of Quantity Qs of water
Qe would be the market equilibrium without subsidies
Q* would be the ecologically optimal quantity withdrawn
22. Price
per
Unit
Quantity of Water Used
Uniform Rate Structure
Price
per
Unit
Quantity of Water Used
Increasing Block Rate Structure
Price
per
Unit
Quantity of Water Used
Decreasing Block Rate Structure
Pricing Structures
23. $0 $50 $100 $150 $200 $250
Atlanta
San Francisco
San Diego
Charlotte, N.C.
Austin, Tex.
Santa Fe, N.M.
City
Average monthly water bill
Cities with the greatest differences in water rates
50 gallons per person per day 100 150
Increasing Bloc Rate Structure in U.S. Cities
24. Water Use Average Value per AF Median Value per AF
Navigation $146 $10
Recreation/Wildlife Habitat $48 $5
Hydropower $25 $21
Thermoelectric Power $34 $29
Irrigation $75 $40
Industrial $282 $132
Domestic $194 $97
Marginal Value of Water in Various Uses
(per acre-foot)
25. Markets of Water Rights for Major Users
(irrigators, industries, cities)
• Water markets are in place in several countries,
including Australia, Chile, South Africa, the United
Kingdom, and the United States.
• In the US, Municipalities are the most common
purchaser of water (mostly from irrigators), but transfers
between irrigators are also common. About 17 percent
of the water purchased is for environmental purposes,
including purchases by municipalities and environmental
organizations. => great potential for water markets to
improve the environment
26. Water Management and Governance:
What institutional frameworks for water conservation?
• State control? Public services in developing countries have often proven inefficient
and corrupt
• Privatization? Promoted by World Bank and IMF – but without appropriate regulation,
water companies can charge excessive rates and fail to address the needs of the
poorest
The “Water War” in Cochabamba, Bolivia, 2000
27. The acequias of
New Mexico are
communal irrigation
canals, a way to
share water for
agriculture in a dry
land.
“Communities have relied on institutions resembling neither the state nor the market to
govern some resource systems with reasonable degrees of success over long periods of
time ”
- Elinor Ostrom, in “Governing the Commons” (1990)
Re-creating Collective Systems for Management of
the Commons?
28. Local Movements for Re-Municipalization of Water
• 2002: Felton water system was sold to
California American Water Co. (Cal-Am), a
subsidiary of RWE Aktiengesellschaft - the
third largest water company in the world.
RWE filed for a 74% rate increase.
• In 2003, residents form a coalition to buy
back their water resources to Cal-Am – at
ballot, 75% voters voted YES – A six-year
legal battle ensued.
• In 2008 Felton citizens won back their
water, inspiring dozens of other towns to
do the same.
180 cities and communities in 35 countries, including Buenos Aires, Johannesburg, Paris,
Accra, Berlin, La Paz, Maputo and Kuala Lumpur, have all “re-municipalized” their water
systems in the past 10 years.
Editor's Notes
This module addresses the physical constraints on water, presents an analysis of indicators such as virtual water and water footprint, and examines policy instruments to address these growing scarcities, including economic instruments such as water pricing, and non-price approaches such as institutional designs of water governance systems.
Freshwater is only 3% of the Planet’s water, and of thise 3%, 70% is in the form of ice, in the polar caps and glaciers, and 29% is underground. Freshwater that is readily available as rivers, lakes, and reservoirs amounts to 1%.
In the hydrologic cycle water moves between rivers, lakes, oceans, and the atmosphere, while a large percentage remains in underground aquifers.
The availability of freshwater is very unequally distributed geographically. A region or country is said to be experiencing water stress when annual water supplies fall below 1,700 cubic meters per person per year - and water scarcity when supplies fall below 1,000 cubic meters per person – we also talk about absolute water scarcity when supplies drop below 500 cubic meters per person per year.
The concept of economic water scarcity refers to situations where proper infrastructure in water distribution, water recycling and treatment, and sanitation are lacking, leading to inadequate water supply.
The Middle East and North Africa regions are already experiencing acute water scarcity, with a population of 432 million in 2007, expected to increase to 692 million in 2050. Sub-Saharan Africa suffers from water scarcity (1000 cubic meters per person per year) with a current population of 936 million in 2013, which is expected to double by 2050.
Green water: water that exists in flux in natural ecosystems, as clouds, mist, rain, soils and plants. Blue water: water withdrawn from water stocks including lakes, reservoirs, and groundwater aquifers for human activities (irrigated agriculture, industry, domestic use). Gray water: freshwater needed to dilute and flush away the pollutants that result from l human activities.
Of all water that is withdrawn for human activities, 70% is used for agriculture, primarily to irrigate crops; 19% is used for industry; and 11% for municipal and domestic uses. The share of water for agricultural uses can be as high as 95% (Vietnam), and as low as 0.3% (Germany).
Water consumption per capita varies widely across countries.
Virtual water is the amount of water that is embedded in goods or services, accounting for all of the water used as input at every step of the production process, either for agricultural goods, industrial goods, or services.
Different fuels have widely differing virtual water requirements.
Water consumption depends on lifestyle, including diet. Meat eater: 2,647 gallons/day; vegetarian: 1,266 gallons/day; vegan: 1,114 gallons/day
National water footprints add up all the water that is consumed by all sectors of the economy – including both water from national resources, water resources from other countries embodied in imported goods.
The energy sector is both a major user of water, and an essential input to water production, distribution, and treatment.
Virtual water trade patterns are shown in this example of cotton. These arrows show where water embodied in traded cotton originates and where it goes. Cotton exports to Europe come from countries including India, Pakistan, Turkmenistan, and Egypt, all of which experience water stress or water scarcity.
Red countries are net virtual water importers, including countries in the Middle East and North Africa. Green countries are net virtual water exporters – often countries that are water abundant, such as Canada, but also including some water stressed or water-scarce countries.
Water shortages have contributed to conflict, for example in Syria. A severe drought from 2006 to 2011 led to the ruin of hundreds of thousands of small scale farmers who emigrated to the outskirts of major cities, contributing to the pressure leading to revolution and continuing civil conflict.
Access to scarce water resources is one of the issues at stake in the In the Israeli-Palestinian conflict. The common aquifer which is in the underground of the West Bank is exploited by the Israelis, who are using four fifths or it, whereas Palestinians are only using one fifth.
The 48,000 large dams in operation in the world – half of the them in China – have largely exploited the best sites for water storage. 20% of the world’s aquifers are being overexploited. Desalination has a high energy requirement and relatively high costs. Demand side solutions include water conservation, micro-irrigation for agriculture, and reuse and recycling.
Water prices should reflect all the costs of water resources exploitation and management, including social costs. If negative externalities are not internalized, then the price of the market will be too low (Pe) and the quantity of water consumed too high (Qe) . Subsidies to irrigation water increase inefficiency, by allowing an even larger amount of subsidized water consumption Qs, sold at a price well below true cost.
The pattern of prices does not reflect water scarcity. While some arid cities, such as Santa Fe and San Diego, do charge high water rates, other dry regions, such as Las Vegas and Fresno, charge very low rates
Uniform block rates do not create any incentives for conservation, and decreasing block rates encourage greater consumption. Increasing block rates encourage economic actors to internalize the need for more efficient water practices. Equity considerations can also be included; for example in South Africa where the first bloc in an increasing bloc rate structure is free so that even poor households can afford a baseline amount of water.
Increasing bloc rate structures have been adopted by some major U.S. cities. Santa Fe applied it since a major draught in 2001, and even as its population has increased more than 10 percent since 2001, its per-capita water usage has dropped from 140 gallons a day in 2001 to about 100 gallons a day now
The table suggests that there may be some potential for reallocating water from relatively low-valued uses to higher-valued uses. However, the allocation of water in the United States and elsewhere is rarely determined by concerns about economic efficiency. Instead, water rights are allocated based on various historical and legal considerations.
Water markets are in place in several countries, including Australia, Chile, South Africa, the United Kingdom, and the United States.
In Cochabamba, Bolivia, the municipal water company SEMAPA was sold in the late 1990s to a transnational consortium controlled by U.S.-based Bechtel. After several weeks of civil disobedience and angry protest in the streets, popular pressure forced the Bolivian government into negotiating the abrogation of the contract with Bechtel and returning SEMAPA to public control.
Traditional local democratic forms of water governance assured ecological sustainability of their agro-ecosystems, for instance the system of acequias irrigation used in New Mexico
180 cities and communities in 35 countries, including Buenos Aires, Johannesburg, Paris, Accra, Berlin, La Paz, Maputo and Kuala Lumpur, have all “re-municipalized” their water systems in the past 10 years
Projections shows that water demand will dramatically, even with more efficient irrigation techniques. Growth will be especially rapid in the BRIICS countries – Brazil, Russia, India, Indonesia, China and South Africa. Scarcity of water may be accentuated in many areas by climate change. Efficient techniques and practices will be essential both in the developing world and in the industrialized nations, as well as democratic institutional systems of water management.