Download as PDF, PPTX

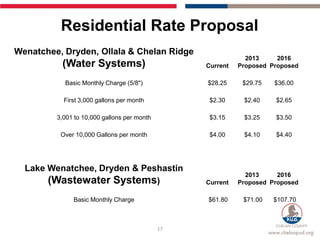
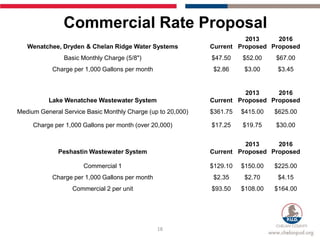
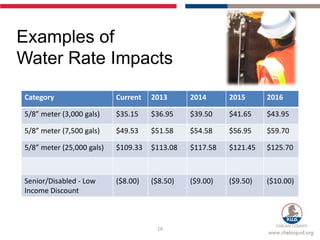
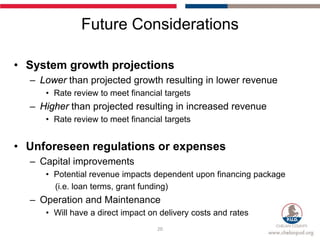
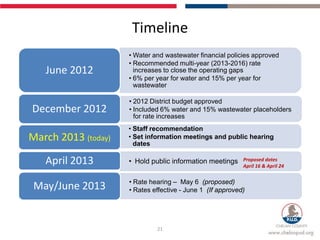

The document outlines the proposed water and wastewater rate adjustments for the years 2013 to 2016, focusing on modest, predictable increases to align with the cost of service and maintain financial sustainability. It includes specific percentage increases for residential and commercial rates, as well as details on the service systems and future planning. Key dates for public meetings and hearings regarding the rate proposals are also provided.


