Download to read offline

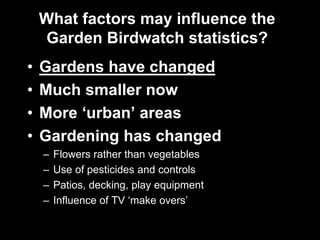
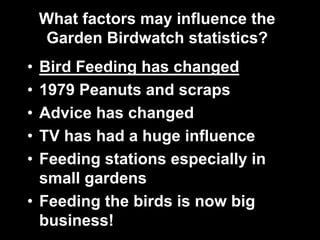
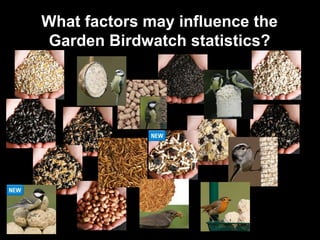
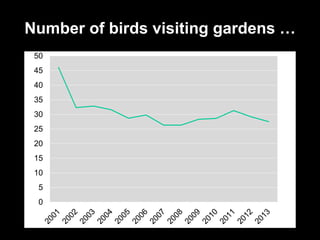
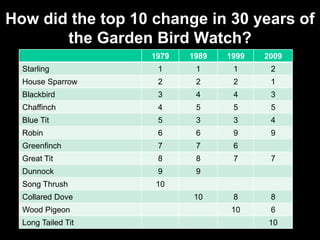
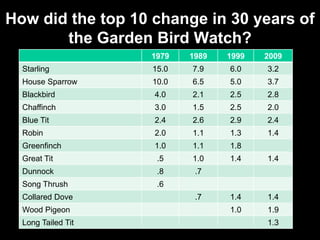
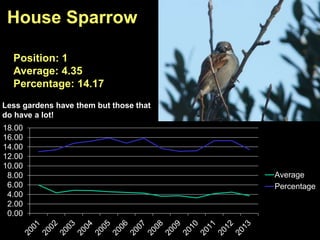
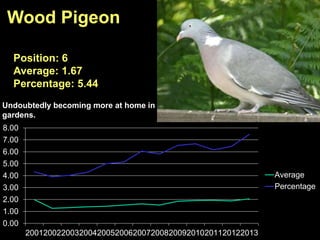
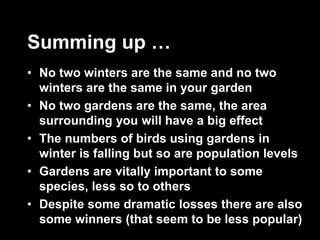

The document discusses the Big Garden Bird Watch, an annual citizen science survey of winter bird populations in UK gardens. It has recorded declines in some common species like house sparrows but increases in others like wood pigeons. Garden design changes and less natural food availability have impacted the numbers and types of birds that use gardens. While no two winters or gardens are the same, the survey shows the importance of gardens for some birds and how population trends are reflected in garden bird counts.


