SlideShare a Scribd company logo
1 of 58
Download to read offline
SOUTH FLORIDA
                WADING BIRD REPORT
Volume 14                                       Mark I. Cook and Mac Kobza, Editors                    November 2008


IN MEMORY
The contributors and editors of the South Florida Wading Bird
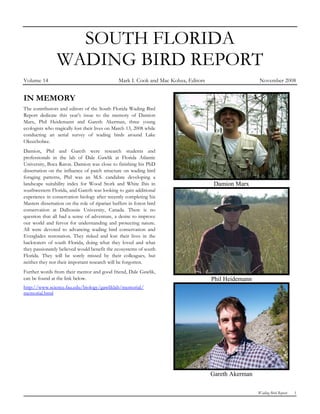
Report dedicate this year’s issue to the memory of Damion
Marx, Phil Heidemann and Gareth Akerman, three young
ecologists who tragically lost their lives on March 13, 2008 while
conducting an aerial survey of wading birds around Lake
Okeechobee.
Damion, Phil and Gareth were research students and
professionals in the lab of Dale Gawlik at Florida Atlantic
University, Boca Raton. Damion was close to finishing his PhD
dissertation on the influence of patch structure on wading bird
foraging patterns, Phil was an M.S. candidate developing a
landscape suitability index for Wood Stork and White Ibis in                           Damion Marx
southwestern Florida, and Gareth was looking to gain additional
experience in conservation biology after recently completing his
Masters dissertation on the role of riparian buffers in forest bird
conservation at Dalhousie University, Canada. There is no
question that all had a sense of adventure, a desire to improve
our world and fervor for understanding and protecting nature.
All were devoted to advancing wading bird conservation and
Everglades restoration. They risked and lost their lives in the
backwaters of south Florida, doing what they loved and what
they passionately believed would benefit the ecosystems of south
Florida. They will be sorely missed by their colleagues, but
neither they nor their important research will be forgotten.
Further words from their mentor and good friend, Dale Gawlik,
can be found at the link below.                                                       Phil Heidemann
http://www.science.fau.edu/biology/gawliklab/memorial/
memorial.html


                                                                                      Gareth Akerman

                                                                                                       Wading Bird Report   1
for two consecutive years (see special section). White Ibis
SYSTEM-WIDE SUMMARY                                                   numbers were down 61% on last year and 64% lower than the
                                                                      past ten years. Roseate Spoonbill nest numbers were the lowest
Water-year 2008 (May 2007 through Apr 2008) included the tail-        since records began in 1983.
end of an official two-year drought and started with below
average stage and a delayed onset to the wet season. Annual           Nesting effort in the Everglades is rarely distributed uniformly
rainfall was generally above average, particularly in the northern    among regions. In 2008, WCA-1 supported the most nests
WCAs, but its timing was far from normal with limited                 (71%) followed by WCA-3 (23%), whereas ENP supported only
precipitation during the wet season and multiple large rain events    6%. This spatial distribution of nests continues the recent trend
during the dry season. This resulted in below average stages and      of an annual increase in the proportion of birds nesting in WCA-
generally dry conditions at the onset of wading bird nesting, and     1 at the expense of nesting in WCA-3. ENP historically
a series of rainfall induced reversals during peak nesting.           supported the largest number of nests in the system at the
                                                                      traditional estuarine “rookeries” downstream of Shark Slough.
The estimated number of wading bird nests in South Florida in         Nesting effort in the estuaries has increased gradually over recent
2008 was 18,418. This is a 51% decrease relative to last year’s       years (e.g., 20% in 2006) but this year these regions supported
season, 74% less than the 68,750 nests of 2002, which was the         only minimum nesting. CERP’s goal is to increase the
best nesting year on record in South Florida since the 1940s, and     proportion of birds nesting in this estuarine ecotone. Another
59% less than the average of the last eight years. This year,         pattern over the past ten years has been for a large proportion of
counts from J. N. ‘Ding’ Darling National Wildlife Refuge             nests in South Florida to be concentrated in a single large colony
Complex are included in the total after a survey hiatus of two        (Alley North) located in northeast WCA-3A. For two
years.                                                                consecutive breeding seasons Alley North and the adjacent
                                                                      marsh dried prior to breeding and nesting was not initiated at the
Systematic nest survey coverage was expanded in 2005 to include       colony.
Lake Okeechobee and the recently restored section of the
Kissimmee River floodplain. In 2008, we expand coverage
further with the introduction of nest counts from Estero Bay
Aquatic Preserve. For Lake Okeechobee, 2008 ranks as the                  Locations of wading bird colonies with ≥ 50
worst nesting year on record with a peak of only 39 nests. This is        nests in South Florida, 2008.
a dramatic reduction on the 11,310 nests observed in 2006 and
lower even than the poor nesting effort of 2007 when 774 nests
                                                                                                              Kissimmee River
were recorded. On the restored sections of the Kissimmee
floodplain, the timing and magnitude of floodplain inundation
and recession are not yet optimal for colony formation, and
nesting has been very limited in recent decades. In 2008 only six                               Lake Okeechobee
nests were recorded on the floodplain. Implementation of the
regulation schedule for the Headwaters Revitalization Project in                                                                Solid Waste
                                                                                                                                Authority
2010 will allow water managers to more closely mimic the                                 Caloosahatchee
                                                                                                                          WCA 1
historical stage and discharge characteristics of the river,                Ding
                                                                                              River
                                                                                                      Rotenberger and     (Loxahatchee
presumably leading to suitable hydrologic conditions for wading            Darling                    Holey Land WMA      NWR)
bird nesting colonies. Estero Bay supported 206 wading bird
                                                                                     Estero
nests in 2008. Note that the totals for these three regions are not                   Bay                               WCA 3       WCA 2
included in the system-wide total.                                                                        BCNP

All species of wading birds suffered significantly reduced nest
numbers relative to the past ten years. For example, Wood Stork                           Southwest
reproduction was very much reduced and this was the first time                              Coast
that nesting was not initiated at the historical Corkscrew colony
                                                                                                                         ENP
  INSIDE THIS ISSUE
  3                  Hydrology 2008                                                                                 Florida
                                                                                                                      Bay
  7                  Regional Nesting Reports
  32                 Regional Bird Abundance
                                                                      Generally, nesting was not successful for most species. Many
  43                 Population Recovery Status 2008                  birds abandoned nests throughout the system after rain-induced
                                                                      water level reversals in March and April. In the few places that
  45                 Special Topics                                   Wood Storks attempted to nest in the Everglades (Paurotis Pond
                                                                      and Cuthbert Lake) all nests failed following these rain events.
                                                                      However, the presence of large numbers of mature White Ibis

                                                                                                                           Wading Bird Report   2
nestling at Lox West colony in July suggested that late-nesting
ibis in WCA-1 were reasonably successful.
                                                                         HYDROLOGY 2008
Two of four species-groups, White Ibis and Great Egrets, met             The amount of rain in the Everglades Protection Area (EPA) for
the numeric nesting targets proposed by the South Florida                Water Year 2008 (WY08 May 1, 2007 through April 30, 2008)
Ecosystem Restoration Task Force. Two other targets for the              was greater than last year by as much as 10.6 inches, in WCA-1,
Everglades restoration are an increase in the number of nesting          or by as little as 4.6 inches, in WCA-3. Most of this added
wading birds in the coastal Everglades and a shift in the timing         rainfall fell during the dry season, during wading bird nesting,
of Wood Stork nesting to earlier in the breeding season (Ogden,          making wading bird foraging conditions less than favorable. The
1994). The 2008 nesting year showed no improvement in the                rainfall and associated stage readings for WY2008 are shown in
timing of Wood Stork nesting or a general shift of colony                Table 1 below. Water Conservation Areas 1 and 2 saw a 7%
locations.                                                               increase in historic rainfall amounts and a 24% increase over
                                                                         WY07. On–the-other-hand, Water Conservation Areas 3 saw a
Although reproductive output was limited this year, Systematic           5% decrease in historic rainfall amounts and only a 10% increase
Reconnaissance Flight surveys revealed that the Everglades was           over WY07. The Everglades National Park (ENP) saw a 10%
an important foraging area in WY2008. A total of 632,016 birds           increase in historic rainfall amounts and a 15% increase over
were counted in the WCAs and ENP between December 2007                   WY07. It is interesting to note that after a year of severe
and June 2008, which is 29% more than the five-year average.             drought, the maximum stage for WCA-1 in WY08 came close to
The temporal patterns of abundance in 2008 were remarkably               the historic maximum stage. This kind of hydrology may account
similar to last year, with high numbers observed from December           for the resilience of the wading bird populations that were
through March followed by a marked decline from April as                 clustering in this region in WY08.
water levels increased. On the restored sections of the
Kissimmee River floodplain the mean number of birds per                  In WY08 most of the rain fell during the wet season months of
square kilometer rebounded after the post-restoration low of             June and September and then again during the dry season
2007, but this was less than a third of the density observed in          months of February, March and April. In ENP, rain in June was
2006.                                                                    13.28 inches and in September was 10.99 inches creating a pulse-
                                                                         like hydrograph (see Figure 1). In March to April monthly
This year’s poor reproductive effort and success were almost             rainfall in the Park averaged about 2.75 inches. In the WCA’s,
certainly due to two preceding years of drought and its affect on        rain in June was about 8.5 inches and in September was about
system-wide prey productivity. Low stages and short                      9.0 inches. In the WCA’s there were only two months out of the
hydroperiods are not conducive to fish and crayfish production,          year that rainfall dropped below 1 inch for the month. In the
and many areas in WY2007 and WY2008 were characterized by                Park rainfall was below 1 inch from November through January.
reduced dry-season prey densities (D Gawlik pers. com.) and              As shown in the following hydrographs, what might be expected
nestling diets that contained high proportions of terrestrial prey       from an above average annual rainfall following a year of
(M Cook pers. obs.). WY2008 did receive higher than average              drought (i.e., a return to good foraging conditions for wading
annual precipitation, but much of this rain fell too late to benefit     birds) did not come to fruition in water year 2008.
aquatic fauna and instead fell during the dry-season causing
widespread water-level reversals and the dispersal of an already         The following hydropattern figures highlight the average stage
limited prey base. This appeared to result in wide-spread nesting        changes in each of the WCAs for the last two years in relation to
failure for those birds that did attempt nesting. WCA-1                  the recent historic averages, flooding tolerances for tree islands,
experienced less severe drought conditions relative to other parts       drought tolerances for wetland peat, and recession rates and
of the Everglades, and this may account for the increased                depths that support both nesting initiation and foraging success
nesting effort in this area. It is unclear why numbers of foraging       by wading birds. These indices were used by the SFWMD to
birds should increase during drought years but it may be due to a        facilitate weekly operational discussions and decisions. Tree
lack of suitable foraging conditions elsewhere in south Florida.         island flooding tolerances are considered exceeded when depths
                                                                         on the islands are greater than 1 foot for more than
Mark I. Cook                                                             120 days (Wu and Sklar, 2002). Drought tolerances are
Mac Kobza                                                                considered exceeded when water levels are greater than 1 foot
Everglades Division                                                      below ground for more than 30 days, i.e., the criteria for
South Florida Water Management District                                  Minimum Flows and Levels in the Everglades (SFWMD, 2003).
3301 Gun Club Road, West Palm Beach, FL 33406                            Figure 1 shows the ground elevations in the WCAs as being
561-686-8800                                                             essentially the same as the threshold for peat conservation. The
mcook@sfwmd.gov                                                          wading bird nesting period is divided into three simple categories
rkobza@sfwmd.gov                                                         (red, yellow, and green) based upon foraging conditions in the
                                                                         Everglades (Gawlik et al. 2004). A red label indicates poor
Literature Cited                                                         conditions due to recession rates that are too fast (greater than
Ogden, J.C. 1994. Status of Wading Bird Recovery. D.E. Gawlik, ed. In:   0.6 foot per week) or too slow (less than 0.04 foot for more than
South Florida Wading Bird Report. Vol. 3, South Florida Water            two weeks). A red label is also given when the average depth
Management District, West Palm Beach, FL.                                change for the week is positive rather than negative. A yellow
                                                                         label indicates fair conditions due to a slow recession rate of 0.04
                                                                         foot for a week or a rapid recession between 0.17 foot and 0.6

                                                                                                                        Wading Bird Report   3
foot per week. A green/good label is assigned when water depth          islands for a period of 1-2 months, which is not enough to
decreased between 0.05 foot and 0.16 foot per week. Although           cause any tree island damage (Wu and Sklar, 2002). The few
these labels are not indicative of an appropriate depth for            islands that remain in this region are not likely to be impacted
foraging, they have been useful during high water conditions to        due to their NW location and their relative elevations. However,
highlight recession rates that can lead to good foraging depths        future efforts to restore WCA-2A islands will require a closer
toward the end of the dry season (i.e., April and May).                examination (i.e., frequency analysis) of these kinds of
                                                                       exceedences. In WCA-2A, the WY06 and WY07 dry seasons
WCA-1                                                                  were very similar. Both dry seasons had very good recession
The 2008 Water-Year for WCA-1 started at very low water                rates, and both times the region completely dried out. However,
conditions, after a nine-month period of below average water           in WY06, WCA-2A exhibited excellent foraging conditions and
levels. Water depths rose from a low in June of only a few inches      many flocks of wading birds were observed. In WY07,
to depths of 2.5 ft in a matter of only three months and               hydroperiod was very short and stage was below average for
remained above average throughout the rest of the water year           most of the year and as a result, reports of large or many flocks
(Figure 1A). The upper flooding tolerances for tree islands were       were greatly reduced. This year (WY08) there was some evidence
reached very briefly in October 2007. Recession rates were poor        of a large return of the WCA-2A prey-base for wading birds
for most of the 2008 dry season and stage trends were opposite         because the hydroperiod was lengthened and because foraging
from the steady declines observed during the previous dry              was limited to the month of May due to poor recession rates for
season. Last year, water depths became optimum for foraging in         most of the dry season (Figure 1B).
central and southern WCA-1 during April and May. This year,
optimum depths were not reached until June. However, June              WCA-2B has always been utilized by wading birds during
was probably an excellent foraging month because April and             droughts because it tends to stay deeper for longer periods than
May of this year had good recession rates creating the perfect         the rest of the EPA. This was particularly true in WY06 when
“set-up” for foraging when the right depths are reached.               dry season water levels went below ground in WCA-2A and the
Unfortunately, by July the optimum depths were starting to be          wading birds moved to WCA-2B. Last year, the drought was so
exceeded. Dry season foraging by wading birds in WCA-1                 severe that even 2B became too dry to support any foraging
probably slowed significantly in mid-July. For the third year in a     from May to July. It was unique to see depths drop some two
row, WCA-1 had the longest duration of good nesting and                feet below ground in this region last year. This year was a
foraging periods of any region in the EPA.                             completely different story. July rainfall caused water depths to
                                                                       increase rapidly in 2B and a maximum depth of 4 ft was reached
WCA-2A and 2B                                                          in November. Just when wading birds needed good recession
For the last three years in WCA-2A, the stage levels during the        rates (March, April and May), water levels increased and never
wet season have exceeded the upper flood tolerance for tree            dropped low enough to support foraging (Figure 1C). Relief
                                                                       from foraging this year is expected to increase the prey-base in
                                                                       this region and possibly support large nesting flocks next year.


Table 1. Average, minimum, and maximum stage (ft NGVD) and total annual rainfall (inches) for Water Year 2008 in
comparison to historic stage and rainfall.1 Subtract elevation from stage to calculate average depths.
                                                            WY2008 Stage                    Historic Stage
                    WY2008            Historic
     Area                                                      Mean                            Mean                     Elevation
                    Rainfall          Rainfall
                                                             (min; max)                      (min; max)
     WCA-1            55.54             51.96             16.20 (13.57; 17.54)             15.60 (10.0; 18.16)              15.1

     WCA-2            55.54             51.96             12.26 (10.29; 13.98)             12.55 (9.33; 15.64)              11.2

     WCA-3            48.89             51.37               9.3 (5.89; 10.16)              9.53 (4.78; 12.79)                8.2

     ENP              60.92             55.22              5.94 (5.39; 6.33)                5.98 (2.01; 8.08)                5.1
 1
  See Chapter 2 of the 2009 South Florida Environmental Report for a more detailed description of rain, stage, inflows, outflows,
 and historic databases.


                                                                                                                    Wading Bird Report   4
Figure 1. Hydrology in the WCAs and ENP in relation to recent average water depths (A: 10 yr ave, B: 13 yr ave, C: 13 yr
ave, D: 14 yr ave, E: 14 yr ave, F: 13 yr ave, G: 25 yr ave) and indices for tree islands, peat conservation, and wading bird
foraging depths.

A. WCA 1 – Site 9                                                 B. WCA 2A – Site 17


C. WCA 2B – Site 99                                               D. WCA 3A – Site 63


E. WCA 3A – Site 64                                               F. WCA 3B – Site 71


G. NE Shark River Slough


                                                                                                               Wading Bird Report   5
WCA-3A                                                                   year. It is unlikely that the prey-base is large enough for
The hydrology in the northeastern region of WCA-3A (Gage-63)             sufficient recruitment next year and foraging is not expected to
in WY07 was very different from that in WCA-1 and WCA-2A                 be good again in this region until appropriate hydrologic
(Figure 1D). In this part of the Everglades, the WY07 drought            conditions return.
extended well into WY08. (Note: More than one foot below
ground violates the guidance for Minimum Flows and Levels.) It           Fred Sklar
is very unlikely that such a reduced hydroperiod could be capable        Everglades Division
of rejuvenating the prey-base for the large wading bird rookery          South Florida Water Management District
(Alley North) where annual nesting during the past decade has            3301 Gun Club Road
frequently exceeded 20,000 nests. Water depths barely went over          West Palm Beach, Fl 33406
1 ft for a few weeks. When nesting was expected to begin in              561-682-6504
March, water levels increased rather than decreased as would be          fsklar@sfwmd.gov
needed to concentrate the prey-base into sloughs and pools. This
region dried out to a much greater degree than it did last year,         Literature Cited
which dried out to a much greater degree than the year before,           Gawlik, D. E., G. Crozier, K. H. Tarboton. 2004. Wading bird habitat
and the combination of a late wet season and extended dry                suitability index. Pages 111-127 in K. C. Tarboton, M. M. Irizarry-Ortiz,
season created an inhospitable environment for wading birds,             D. P. Loucks, S. M. Davis, and J. T. Obeysekera. Habitat suitability
especially those that frequent the popular Alley North Rookery.          indices for evaluation water management alternatives. Technical Report,
                                                                         South Florida Water Management District, West Palm Beach, FL.
During the dry seasons of WY06 and WY07, the birds were
lucky that their rookery did not burn. This was the second year in       SFWMD. 2003. Minimum Flows and Levels for Lake Okeechobee, the
a row the birds were smart enough not to use Alley North as a            Everglades, and the Biscayne Aquifer. Draft Report, February 2000.
nesting location.                                                        South Florida Water Management District, West Palm Beach, Fl.

The hydrologic pattern in central WCA-3A (Gage-64) in WY08               Wu, Y., K. Rutchey, W. Guan, L. Vilchek and F.H. Sklar. 2002. Chapter
did not suffer the drought as much as the northeast WCA-3A               16: Spatial Simulations of Tree Islands for Everglades Restoration. F.H.
(Figure 1E). Although there was no MFL violation to speak of,            Sklar and A. van der Valk, eds. In: Tree Isalnds of the Everglades, Kluwer
there was instead a greatly reduced wet-season stage. Water              Academic Publishers, MA.
depths did not go above 1 ft until October and never went over
2 ft the entire water year. What should have been a great wading
bird foraging environment starting in March was instead
disrupted by increasing water levels rather than decreasing water
levels for almost the entire nesting (dry) season. Last year the
shallow depths and short duration of the wet season was
probably sufficient to cause widespread depletion of wading bird
prey species. This year, the lack of foraging and the longer
hydroperiod may well translate into a banner prey-base for next
year (WY09).

WCA-3B
In WY06, the water depths in WCA-3B did not go below 0.5
foot (optimum foraging depth) until May 2006, after most
nesting behaviors had ceased. In WY07, short but numerous
reversals made this region marginal for foraging. This year water
depths remained almost constant all year round, and recession
rates were not long-lived enough (Figure 1F) to function as a
prey-concentrating mechanism (assuming that depths were
adequate for prey recruitment). So, for three years in a row, this
region’s hydrology has not supported wading bird nesting or
foraging.

Northeast Shark River Slough
The uniqueness of the hydrology and drought in the Everglades
during WY07 and WY08 is captured by the Northeast Shark
River Slough (NESRS) hydrograph (Figure 1G). For three years
in a row this region of Everglades National Park experienced
significant violations of the MFL standard, and most of those
violations occurred this year. Water levels in this part of the
system began dropping in December, and never had any water to
support wading birds during the nesting season. It is no surprise,
looking at this hydrograph, that large areas of this region (i.e., the
Mustang Corner) experienced vegetation and peat fires this past
                                                                                                                             Wading Bird Report   6
with information from ground checks. In addition, we used
REGIONAL NESTING REPORTS                                             some estimates from the South Florida Water Management
                                                                     District, which performs surveys of the larger colonies via
WATER CONSERVATION AREAS 2                                           helicopter in the first week of every month. These were
                                                                     particularly valuable for times when the colonies were changing
AND 3, AND A.R.M. LOXAHATCHEE                                        quickly (new startups and abandonments) that might have been
NATIONAL WILDLIFE REFUGE                                             otherwise missed by our mid-month systematic surveys.

In 2008, the University of Florida team monitored nesting in
WCAs 2 and 3 and Loxahatchee for nesting by long-legged
wading birds. We concentrated effort on documenting numbers
of Great Egrets, White Ibises, Snowy Egrets and Wood Storks,
and continued to refine our methods for estimating numbers of
birds in very large colonies. We also made a partial assessment of
the use of unmanned aerial systems (small unmanned aircraft)
specifically for use in wading bird surveys of various kinds.

Methods
We performed two types of systematic surveys in 2008: aerial and
ground surveys. The primary objective of both kinds of surveys
is to systematically encounter and document nesting colonies.
On or about the 15th of each month between February and June
we performed systematic aerial surveys for colonies, with
observers on both sides of a Cessna 172, flight altitude at 800
feet AGL, and east-west oriented flight transects spaced 1.6
nautical miles apart. These conditions have been demonstrated
to result in overlapping coverage on successive transects under a
variety of weather and visibility conditions, and have been used
continuously since 1986. We took aerial photos of larger colonies
from directly overhead and from multiple angles, and made
detailed counts of the apparently nesting birds showing in these
slides via projection. The reported numbers of nest starts are                             Joel Curzon Photography © 2008
usually “peak” counts, in which the highest count for the season
is used as the estimate of nests. The only exceptions to this rule   In the past, we have performed systematic, 100% coverage
were colonies in which clearly different cohorts were noted in       ground surveys of colonies by airboat in WCAs 1, 2 and 3 once
the same colony, in which case the peak counts of the cohorts        between early April and late May. These were designed to
was summed. In some cases we also modified total aerial counts       document small colonies or those of dark-colored species that
                                                                     are difficult to detect from aerial surveys. Since 2004, 100%
 ABBREVIATIONS                                                       coverage ground surveys were discontinued due to a change in
 Species: Great Egret (GREG), Snowy Egret (SNEG),                    MAP guidelines for monitoring. However, we did perform some
 Reddish Egret (REEG), Cattle Egret (CAEG), Great Blue               systematic ground surveys in WCA 3 that allowed for a direct
 Heron (GBHE), Great White Heron (GWHE), Little Blue                 comparison of densities of colonies in certain areas. This was
 Heron (LBHE), Tricolored Heron (TRHE), Green Heron                  designed to give an index of abundance for small colonies and
 (GRHE), Black-crowned Night-Heron (BCNH), Yellow-                   dark-colored species that might be sustainable. In the case of all
 crowned Night-Heron (YCNH), Roseate Spoonbill (ROSP),               ground surveys, all tree islands were approached closely enough
 Wood Stork (WOST), White Ibis (WHIB), Glossy Ibis                   to flush nesting birds, and nests were either counted directly, or
 (GLIB), Anhinga (ANHI), Double-crested Cormorant                    estimated from flushed birds.
 (DCCO), Brown Pelican (BRPE), Osprey (OSPR), Bald
 Eagle (BAEA), small dark herons (SML DRK), and small                As part of an effort to measure nest turnover in colonies, we
 white herons (SML WHT).                                             also estimated nest success in several colonies, by repeatedly
                                                                     recording the contents and fates of marked nests.
 Regions, Agencies, and Miscellaneous: Water
 Conservation Area (WCA), Everglades National Park (ENP),            Results
 Wildlife Management Area (WMA), A.R.M. Loxahatchee                  Total counts in the WCAs and Loxahatchee NWR
 National Wildlife Refuge (LNWR), Lake Worth Drainage                Combining all species at all colonies in LNWR, WCA 2, and
 District (LWDD), Solid Waste Authority (SWA), South                 WCA 3, we estimated a grand total of 15,204 nests of wading
 Florida Water Management District (SFWMD), U.S. Army                birds (Cattle Egrets, Anhingas and cormorants excluded) were
 Corp of Engineers (USACOE), Systematic Reconnaissance               initiated between February and July of 2008 (Tables 1 & 2). Note
 Flights (SRF), Comprehensive Everglades Restoration Plan            that this figure does not include birds nesting at the Tamiami
 (CERP), and Natural Systems Model (NSM).                            West colony, which we also monitored intensively in ENP.

                                                                                                                   Wading Bird Report   7
Table 1. Numbers of nests of wading birds found in A.R.M. Loxahatchee National Wildlife Refuge during systematic
surveys, Jan - June 2008
Latitude Longitude WCA          Colony    GREG WHIB WOST ROSP SNEG GBHE LBHE SmWt        LgDk SmDk TRHE GLIB BCNH Total
26.55010 -80.44270 1            LOXW      233  3561      16   567                                                 4377
26.53280 -80.27620 1            NEWCOL4   229            2         1         2553                                 2785
26.43822 -80.39053 1            LOX99     221  892                           140         3                        1256
26.49650 -80.22288 1            LOXRAMP        180                      680                                       860
26.43510 -80.23720 1            LOX70          800                                                                800
26.37217 -80.26020 1            LOX73     30   513                 1         6                                    550
26.45857 -80.24032 1            NEWCOL2   294                                32                                   326
26.39895 -80.24992 1            VENUS     114  36                            27               2                   179
26.45913 -80.42335 1            VULCAN                                  156                                       156
26.59810 -80.28547 1            ZULU                                         23                                   23
26.50985 -80.32375 1            WATS                                    17                                        17
26.55353 -80.26452 1            YAM       8                   9                                                   17
26.57228 -80.27217 1            YMIR      10                       5                          2                   17
26.52470 -80.43570 1            WAFFLE                                       16                                   16
26.45010 -80.26287 1            VOLTA     12                                                                      12
26.46838 -80.37228 1            WELT                                    11                                        11
26.37197 -80.31035 1            UTU       8                                                                       8
26.37210 -80.29265 1            UZANA     8                                                                       8
26.39393 -80.33868 1            UZUME     8                                                                       8
26.55737 -80.25987 1            YEW       6                                                                       6
26.39220 -80.31227 1            UZED      4                                                                       4
Total nests for Colonies > 50             1121 5982      18   567  2    836  2758        3    2                   11289
Total nests for Colonies < 50             64                  9    5    28   39               2                   147
Grand total                               1185 5982      18   576  7    864  2797        3    4                   11436


Table 2. Numbers of nests of wading birds found in WCAs 2 and 3 during systematic surveys, Jan - June 2008
Latitude Longitude WCA          Colony         GREG WHIB WOST ROSP SNEG GBHE LBHE Sml.    Lrg Sml. TRHE GLIB BCNH Total
26.12428 -80.54148 3            6THBRDG        76   1000      1    250  3         250                             1580
26.21360 -80.81470 3            ROTOR          108                 3    2    297  37                              447
25.86842 -80.80663 3            ENKI                                         172  8                102            282
26.12408 -80.50438 3            CYPRESS CITY   245            9         15                                        269
26.38775 -80.23857 3            UNTEW               243                                                           243
26.09846 -80.76870 3            MELBA                              3         47                    58             108
26.24600 -80.49300 3            SPOONIE                       40                  11                              51
26.20132 -80.52873 3            ALLEY NORTH    43                       1                                         44
25.86541 -80.80342 3            ECHO                                         37                    4              41
25.82065 -80.67693 3            YONTEAU        27                                 7                               34
25.77353 -80.83722 3            HIDDEN         30                                                                 30
25.93890 -80.53030 3            HERBIE         28                                                                 28
26.20979 -80.66408 3            RAMA                               1         25                                   26
25.83184 -80.53257 3            DANA           22                                                                 22
26.10715 -80.49802 3            NANSE          20                                                                 20
26.04602 -80.62586 3            BIG MEL        14                       1                     1                   16
26.03640 -80.78980 3            HILBRA         13                       1                                         14
25.82025 -80.50132 3            CYDER          12                                                                 12
26.01230 -80.63233 3            JOULE          10                       2                                         12
26.00012 -80.59513 3            JANUS          8                        3                                         11
25.76900 -80.67835 3            BRAHMA         10                                                                 10
25.81939 -80.61354 3            CINDER         10                                                                 10
25.91565 -80.63022 3            VACATION       6                        4                                         10
25.94280 -80.66680 3            HANDEL         9                                                                  9
25.96052 -80.57207 3            HORUS          8                                                                  8
25.92347 -80.51858 3            GANGA          7                                                                  7
25.92390 -80.54260 3            GRANT          7                                                                  7
25.84863 -80.51932 3            DIONYSUS       5                                                                  5
25.84723 -80.53150 3            DAMKINA        4                                                                  4
25.95902 -80.47898 3            HESTIA         3                                                                  3
25.83770 -80.81890 3            CANDER                                  2                                         2
26.01360 -80.45632 3            JUNO                                    2                                         2
25.91450 -80.47640 3            GARGOYLE                                1                                         1
26.01557 -80.56272 3            JUPITER        1                                                                  1
26.24335 -80.35072 2            SHIVA          144  7              26   1    12                    1              191
26.23782 -80.31280 2            RHEA           19                       3                                         22
Ground surveys          3                      29                       23   11                    4         119  186
Total nests for Colonies > 50                  573  1250      50   282  21   528  306              161            3171
Total nests for Colonies < 50                  316                 1    20   62   7           1    4              411
Grand total                                    918  1250 0    50   283  64   601  313     0   1    169  0    119  3768


                                                                                                          Wading Bird Report   8
Table 3. Annual numbers of nests of aquatic birds found in A.R.M. Loxahatchee National Wildlife Refuge and WCAs 2 and
3 from 2005 through 2008
WCA                  Year   GREG WHIB WOST ROSP SNEG GBHE LBHE Unkwn SmDk TRHE GLIB BCNH CAEG Total
LNWR                 2005   1361   2994                    238                  599                                                           5192
                     2006   1800   5194                    3745       3                                   50       50     30                  10872
                     2007   1792   8271                               13        730     66                1                          4797     15670
                     2008   1185   2421             18     9          10        864     6925     4                                            11436


WCAs 2&3             2005   2209   13004 20         11     2253       201       634     1                 388      75     220                 19016
                     2006   5697   15698 190        40     4540       328       1212    28                561      192    289                 28775
                     2007   2141   10932            39     247        467       284     1700              142             409                 16361
                     2008   918    760              50     36         64        601     516      1        169             119                 3768

Total for all WCAs 2005     3570   15998 20         11     2491       201       1233    1                 388      75     220                 24208
                   2006     7497   20892 190        40     8285       331       1212    28                611      242    319                 39647
                   2007     3933   19203            39     247        480       1014    1766              143             409        4797     32031
                   2008     2103   3181             68     45         74        1465    7441     5        169             119                 15204

The size of the nesting aggregation in 2008 in the WCAs and                 some important way to the attractiveness of nesting. This result
LNWR combined was approximately 44% of the average of                       certainly suggests more detailed analysis.
similar counts during the past five years, 47% of the average of
                                                                            In recent reports we did not differentiate total nest counts
the past ten years, and 25% of the banner year of 2002. Numbers
                                                                            according to conservation area. Segregated totals for LNWR
of Great Egret nests were only 33% the average of the last five
                                                                            and WCA’s 2 & 3 from 2005 – 2008 can be found in Table 3.
years, and 34% of the average of the last ten. In 2008, Wood
Stork nests were very much reduced, with no pairs attempting to             Peter Frederick
nest in the WCAs. White Ibis nests were 37% of the average of               John Simon
the last five and 40% the average of the last ten years. Compared           Department of Wildlife Ecology and Conservation
with the banner year of 2002, only 23% of the ibis pairs nested in          P.O. Box 110430
2007. Approximately 860 Snowy Egrets attempted nesting,                     University of Florida, Gainesville, Florida 32611-0430
which was only 27% of the previous five years average and 24%               352-846-0565
of the last ten. Our estimates of ANHI numbers were poor this               pcf@mail.ifas.ufl.edu
season. The delayed wading bird nesting meant that virtually no             jcsimon@ufl.edu
internal colony visits were conducted until well after peak ANHI
activity.
Generally, nesting was not successful for any species, with the
possible exception of ibises in Loxahatchee. Large abandonment
events were seen throughout the system with the water level
reversals that began in March and continued through April. We
followed the fates of marked nests in three colonies in WCA 3:
Vacation (N25 54.939 W80 37.813), Cypress City, and 6th
Bridge. For all three islands, the nests initiated in March (mostly
GREG) showed extremely high failure rates—90% for both
Vacation (N = 10) and Cypress City (N = 21) based on marked
nests and similar levels for 6th Bridge based on aerial photos. A
subsequent nesting effort beginning mid-May/early-June on 6th
Bridge revealed slightly better results (~50-75% failure), although
the field season ended before the fates of many nests could be
confirmed. In the places that Wood Storks did show evidence of
nest attempts (Tamiami West, Paurotis Pond), all nests failed.
The difference in numbers of nests and nest success between
Loxahatchee and WCA 3 this year was dramatic. Generally the
largest colony in the system is at Alley North in WCA 3. This
colony did not really form this year and contained no ibis nests.
Loxahatchee contributed 76% of the total birds nesting in the
WCAs, 82% of the ibises, and 57% of Great Egrets. This is
highly disproportionate to its area and represents a departure
with the past pattern. It seems likely that the more stable water
conditions in Loxahatchee both over the last couple of years and
over the course of the 2008 nesting season have contributed in

                                                                                                                                Wading Bird Report    9
EVERGLADES NATIONAL PARK                                             Great Egrets nested at both Rookery Branch and East River
                                                                     colonies but abandoned in April. A few Roseate Spoonbills
Mainland Areas February – August 2008                                were seen at the Broad River colony site but we are not sure if
                                                                     they nested.
Methods
Aerial colony surveys of ENP were conducted monthly                  The drastically reduced nesting activity observed this year was
(February through August) by one observer from a Cessna 182          most likely a result of the severe drought conditions that
fixed-wing aircraft (~15 hours). Known colony sites were             prevailed throughout the area. Foraging areas around most
checked during each survey on 8 and 20 February, 3 and 17            colony sites were dry until April. After several significant rain
March, 14 April, 20 May, 4 June, 1 and 16 July, and 1 August.        events in April, the conditions went from nearly completely dry
(Note: not all colonies were surveyed on each date and some          to mostly flooded.
were checked while flying other wildlife project flights.) We also   Beginning 1 July, the Rodgers River Island colony site was active
conducted two systematic colony surveys of the grassland             with approximately 30 nesting Great Egrets. Fewer birds were
regions within Shark and Taylor Sloughs where transient colonies     seen nesting on the island when checked on 1 August. All other
often form (usually Great Egrets) on 23 and 25 April. Systematic     colony sites were empty.
surveys comprised 20 east-west oriented transects spaced 1.6
nautical miles apart (see Figure 1) using two observers from each    Frank Key (Florida Bay) January - May 2008
side of a Cessna 182 (~12 hours). Flight altitude was 800 feet
AGL.                                                                 Aerial surveys of Frank Key in Florida Bay were conducted on 8
                                                                     February, 19 March, 18 April, 20 May and 4 June by one
Results                                                              observer when conducting other ENP wildlife survey flights.
We observed comparatively little nesting activity within the         Birds initiated nesting within the main egret and pelican colony
mainland colonies of ENP this season (950 nests, Table 1).           sometime after 8 February. On 19 March, 75 Great Egrets and
Compared to 2007, nest number estimates for all species              25 Brown Pelicans were observed incubating on nests. On 18
combined were down by 71%. Breaking this down by species,            April, the number of active Great Egret nests had declined to 40,
Wood Stork nest numbers were down by 57%, Great Egret by             however small young were seen on remaining nests. Pelican
84%, White Ibis by 62% and Snowy Egret by 32%.                       nests had increased to 60 and Double-crested Cormorants were
Only seven colonies were active and only two - Paurotis Pond         also observed nesting among the egrets and pelicans. By May all
and Alligator Bay - appeared to successfully fledge young. White     egrets had abandoned their nests, however approximately 30
Ibis were the most numerous of species nesting at both colonies.     pelican nests were still active with half-grown young in the nests.
Great Egrets, Tricolored Herons and Little Blue Herons fledged       White Ibis and Snowy Egrets were not seen in the colony this
young quite late in the nesting season at both colonies. Young       year.
egret and ibis branchlings could be seen from the airplane           Several pairs of Great White Herons (n = 4) nested successfully
begging for food and later flying around the colonies. From          on Frank Key but were not located within the main egret and
photos taken during flights, young Tricolored Herons (both           pelican nesting colony.
colonies) and Little Blue Herons (Paurotis Pond) were seen
standing in trees. Roseate Spoonbill fledglings were seen at         Lori Oberhofer
Paurotis Pond in February (see Lorenz et al. this issue for          Sonny Bass
details).                                                            Everglades National Park
                                                                     South Florida Natural Resources Center
We did not find any new colonies while flying systematic surveys     40001 State Road 9336
over Shark and Taylor Sloughs. However we plan to continue           Homestead, FL 33034
these flights next season and anticipate that new colonies will be   (305) 242-7889
found when conditions are more favorable for nesting. In             (305) 242-7833
addition to systematic surveys, we also plan to conduct earlier      lori_oberhofer@nps.gov
checks for Roseate Spoonbill nesting activity (starting in           sonny_bass@nps.gov
October) at colonies where spoonbills have nested in recent
years (i.e., Paurotis Pond and headwaters colonies.)
Wood stork nesting was unsuccessful this year in ENP. They
attempted to nest only at Paurotis Pond and Cuthbert Lake,
while the traditional nesting colonies of Tamiami West and
Rodgers River had no stork activity. At Paurotis Pond, Wood
Storks had a few nest starts when checked on 20 February. On 3
March there were 70 nests. On 17 March 40-50 of 125 visible
nests had incubating adults and most of the remainder had adults
standing at nests. Cuthbert Lake had very little Wood Stork
activity. The few storks that gathered were not observed until 17
March. On that date approximately 20 pairs had visible nest
starts. Unfortunately, Wood Storks at both Paurotis and
Cuthbert abandoned all nests after several significant rain events
in April.

                                                                                                                    Wading Bird Report   10
Table 1. Peak numbers of wading bird nests found in Everglades National Park colonies from 8 February through 1
August, 2008.
 Mainland colonies only   Latitude    Longitude
 Colony name              WGS84       WGS84        GREG   WOST   WHIB    SNEG   CAEG   ROSP   TRHE   LBHE     BCNH       TOTAL
 Alligator Bay            25 40.259   -81 08.828   50            300     50                   +      +                   400
 Broad River              25 30.176   -80 58.464                                       +                                 +
 Cuthbert Lake            25 12.560   -80 46.500   30     20*                                                            30
 East River Rookery       25 16.116   -80 52.071   5*                                                                    0
 Paurotis Pond            25 16.890   -80 48.180   50     125*   250     +             +      +      +                   300
 Rodgers River Bay
                          25 33.400   -81 04.190   30                                                                    30
 Island
 Rookery Branch           25 27.814   -80 51.153  40*                                                                    0
 Total                                            205        145    550   50           +      +      +                   950
 + Indicates species present and nesting, but unable to determine numbers
 * Indicates nesting activity but abandoned nests


Figure 1. Systematic survey transects and known colony sites within Everglades National Park.


                                                                                                            Wading Bird Report   11
WOOD STORK NESTING AT CORKSCREW                                       Other wood stork colonies in SW Florida
SWAMP SANCTUARY                                                       Numerous aerial surveys of other known wood stork colony
                                                                      locations in Collier, Lee and Hendry Counties were conducted
Location: N26° 22.5024 W081° 36.9859                                  from November 2007 through May 2008. The Lenore Island
                                                                      colony on the Caloosahatchee River was the only active nesting
Methods                                                               location found this season. Lenore Island is a mangrove island 2
Corkscrew Sanctuary Staff conducted aerial surveys to known           miles down stream of the I-75 bridge on the Caloosahatchee
colony sites in Collier, Hendry and Lee County periodically from      river.
early November through May to monitor the Wood Stork                  Methods
nesting effort. No nesting effort was observed at Corkscrew           A fixed wing aircraft was flown at 1000’ over nesting sites.
Swamp Sanctuary at anytime throughout the nesting season.             When nesting efforts were identified; digital photographs were
                                                                      taken from 1000’ and 500’. An 8.2 megapixel Canon EOS 30D
Results                                                               body was used in combination with a 70-300mm lens for close-
Wood storks arrived in Collier County in early October,               ups and an 18-55mm wide angle lens for landscape images. The
occasionally visible foraging in roadside ditches. No nesting was     close-up lens was equipped with an image stabilizer. Digital
initiated at the sanctuary for the second year in a row. Wood         photos of the aerial survey for colony were examined and
storks were observed at the Sanctuary foraging at the lettuce         identifiable nested were digitally marked and recorded.
lakes in early March which were dry by the first of April. No
other wading birds were observed nesting at Corkscrew                 Results
throughout the survey period.                                         Wood Storks: Lenore Island was the only productive wood
                                                                      stork nesting site this season. It was surveyed 9 times and
Hydrology                                                             photographed on 5 occasions from January through May of
Water levels at the Corkscrew staff gage peaked just under 27” in     2008. The peak wood stork nesting effort was recorded on
late-September. This is more than 10” below the average wet-          March 28th, where 45 nests were positively identified, another six
season high. Rainfall totals recorded at the Corkscrew visitor        points on the island could have been wood stork nests, but the
center were 27.75” from June 1st through September 30th, which        images were inconclusive. All of these nests are believed to have
is nearly 10” below the rainy season average for that period. This    been in the early stages of incubation. The pronounced drought
drought continued through the traditional nesting season in           is believed to be the catalyst behind the depressed nesting
Southwest Florida. By March 15th water levels at the Lettuce          numbers. Considerable nest abandonment occurred in April and
Lake Steven’s gage were at 5.04” which is more than 20” below         May and the total nesting effort at Lenore Island produced an
average.                                                              estimated 10 successful nests with a total of 12 wood stork
                                                                      fledglings. The productivity for this colony comes to 0.27 chicks
                                                                      per nest attempt.
                                                                      Other waders: Forty great egrets were documented nesting from
                                                                      images captured on March 28th. Many of these appeared to be
                                                                      incubating. The May 29th survey revealed 37 great egret nests,
                                                                      many of which were new initiations as eggs were visible. The
                                                                      fate of these nests is unclear. At least 13 great blue herons
                                                                      nested on Lenore Island, along with two snowy egrets, one
                                                                      black-crowned night heron and one yellow-crowned night heron.
                                                                      Anhingas, double-crested cormorants, and brown pelicans were
                                                                      also nesting on the island. Estimates of colony nesting effort
                                                                      and productivity can be found below in Table 1.
                                                                      Jason Lauritsen
                                                                      Corkscrew Swamp Sanctuary
                                                                      375 Sanctuary Road West
                                                                      Naples, FL 34120
                                                                      jlauritsen@audubon.org

Table 1. Wading bird nesting effort recorded in Southwest Florida.
                                                                                                          SML         SML
 Latitude      Longitude     Colony                              WOST                 GBHE        GREG    WT          DRK           Total
                                                       nests   successful   fledged
 26 22.502     -81 36.985    Corkscrew                 0                              na          na      na          na            0
 26 41.332     -81 49.809    Lenore Island             45      10           12        13          40      2           5             105
                             (Caloosahatchee West)
 26 41.795     -81 47.697    Caloosahatchee East       0                              0                   0           0             0
 26 22.223     -81 16.363    Collier/Hendry Line       0                              0           0       0           0             0
                                                                                                                    Wading Bird Report    12
SOLID WASTE AUTHORITY OF PALM
BEACH COUNTY ROOKERY
Methods
Typically, Breeding Bird Censuses (BBCs) are conducted from
February – July in the SWA Roost by two observers every 8-10
weeks, representing approximately 12 man-hours. During the
BBC, all islands from three abandoned shell pits are
systematically surveyed from a small boat, and the identified bird
species and nest numbers are recorded. Surveys are conducted
during the morning hours so as to minimize any burden caused
by the presence of observers. However, this year’s severe
drought restricted boat access into the colony. The peak nest
numbers are a compilation of early season boat counts and visual
counts from the observation towers.

Location & Study Area
The SWA roost is located on spoil islands in abandoned shell
pits that were mined in the early 1960’s in Palm Beach County,
Florida (Lat. 26o46’41”N: Long. 80o08’32”W NAD27). The
spoil islands consist of overburden material and range from 5 to
367 m in length, with an average width of 5 m. Islands are
separated by 5-6.5 m with vegetation touching among close
islands. The borrow pits are flooded with fresh water to a depth
of 3 m. Dominant vegetation is Brazilian pepper (Schinus
terebinthifolius), Australian pine (Casurina spp.), and Melaleuca
(Melaleuca quinquenervia), all non-native species. Local features
influencing the roost include: 1) the North County Resource
Recovery Facility and landfill and 2) the City of West Palm
Beach’s Grassy Waters (=Water Catchment Area), a 44 km2
remnant of the Loxahatchee Slough.

Results
This report presents preliminary data for the 2008 breeding
season. Typically, nesting activities have been observed at this
colony through September, and these surveys being reported are
only through the end of July. Only the peak nest numbers are
being reported for each of the bird species (Table 1).

The estimated peak number of wading bird nests for the SWA           Mary Beth (Mihalik) Morrison, Todd Sandt &
Colony is 2042 which represents about a 74.9 % increase from         David Broten
the previous 2007 season. Despite the drought, there were nests      Solid Waste Authority of Palm Beach County
of the following bird species: Great Egrets, Snowy Egrets, Cattle    7501 North Jog Road
Egrets, Wood Storks, White Ibis, Little Blue Herons, Tricolor        West Palm Beach, FL 33412
Herons, and Anhinga. The Wood Stork nest numbers were                (561) 640-4000 ext. 4613
slightly higher than last year. It should also be mentioned that     mmorrison@swa.org
there was at least 5-7 Roseate Spoonbill nests with a few
fledglings observed from the boat.


         Table 1. Peak number of wading bird nests in SWA Rookery from February to July 2008
          GREG SNEG CAEG GBHE                         LBHE WOST            WHIB ANHI         TRHE      Total Nests
           122  34   451   0                           15   154             706  419          66          2042


                                                                                                           Wading Bird Report   13
ROSEATE SPOONBILL NESTING IN
FLORIDA BAY ANNUAL REPORT
                                                                    Table 1. Number of ROSP nests in Florida Bay Nov 2007-March
2007-2008                                                           2008. An asterisk (*) indicates colony with nesting success surveys
                                                                    (see Table 2).
Methods
                                                                                                  2007           Summary since
Spoonbill Colony Surveys.                                           Sub-region      Colony        -08                1984
Thirty-nine of Florida Bay’s keys have been used by Roseate                                              Min        Mean             Max
Spoonbills as nesting colonies (Figure 1, Table 1). These           Northwest       Sandy*         80    62         154.09           250
colonies have been divided into five distinct nesting regions                       Frank          42     0          53.06           125
(Table 1) based on each colony’s primary foraging location                          Clive          27    11          27.00            52
                                                                                    Palm           55     9          24.00            55
(Figure 1, Lorenz et al. 2001). During the 2007-2008 nesting                        Oyster          0     0           6.06            45
cycle (Nov-May), complete nest counts were performed in all                         Subtotal      204    65         211.22           325
five regions by entering the active colony and thoroughly
searching for nests. Nesting success was estimated for the four     Northeast       Deer*         15       2           6.67           15
                                                                                    Tern           0       0         104.57          184
active regions through mark and re-visit surveys of the most                        N. Nest        2       0           0.25            2
active colony within the region. These surveys entailed marking                     S. Nest       13       0          18.28           59
up to 50 nests shortly after full clutches had been laid and re-                    Porjoe        10       0          28.55          118
visiting the nests on a 7-10d cycle to monitor chick development.                   N Park         0       0          18.00           50
                                                                                    Duck           1       0           1.94           13
                                                                                    Pass           0       0           0.50           4
Banding Program.                                                                    Subtotal      41      41         177.83          333
The purpose of this banding program is to understand the
movements and population dynamics of the state’s spoonbill          Central         Calusa*       13      0           12.50           21
                                                                                    E. Bob
population. We are interested in the location of post breeding                      Allen          0      0           13.89           35
dispersers, the possibility of breeder exchanges between Florida                    Manatee        3      0           0.19            3
Bay and Tampa Bay, and state-wide regional movements of the                         Jimmie
general population. We are hoping to see trends in spoonbills’                      Channel       14      6           19.83           47
                                                                                    Little
movements with future banding and resighting efforts. Please                        Pollock        0      0            2.44           13
refer anyone with information on resighting banded spoonbills                       S. Park        0      0           10.61           39
to       the     senior       author      or     our     website                    Little
(http://www.audubonofflorida.org/who_tavernier_reportspoon                          Jimmie         0       0           6.00           12
                                                                                    First Mate     1       1           1.00            1
bills.html).                                                                        Captain        1       1           5.00            9
                                                                                    Black Betsy    4       4           4.00            4
                                                                                    Subtotal      36      15          52.94           96

                                                                                    E.
                                                                    Southwest       Buchanon       0      0           6.13            27
                                                                                    W.
                                                                                    Buchanon       0      0            3.40            9
                                                                                    Barnes         0      0            0.27            3
                                                                                    Twin           1      0            1.67            8
                                                                                    Subtotal       1      0           10.13           35

                                                                    Southeast       Stake*        11      0           5.44            19
                                                                                    M.
                                                                                    Butternut     3       1           20.67           66
                                                                                    Bottle        11      0           11.41           40
                                                                                    Cowpens        2      0            5.88           15
                                                                                    Cotton         0      0            0.00            0
                                                                                    West           1      0            2.93            9
                                                                                    Low            0      0            0.00            0
                                                                                    Pigeon        17      0            9.38           56
                                                                                    Crab           0      0            2.13            8
                                                                                    East           0      0            3.35           13
                                                                                    Crane          1      1           12.81           27
                                                                                    E.
                                                                                    Butternut      9       0           5.87           27
                                                                                    Subtotal      55      39          79.80          117

                                                                    Florida Bay Total             341    341         543.94          880


                                                                                                                      Wading Bird Report   14
In Florida Bay, spoonbill nestlings were banded at 10 of the 24        Thirty nestlings from 13 nests were banded at the Sandy Key
colonies where spoonbills nested. In Tampa Bay, we banded              colony (Table 3) between Dec 21 and Jan 17. Only 20% of the
spoonbills at the largest colony in the region, Richard T. Paul        banded chicks were observed post-fledging on the fringes of the
Alafia Bank Bird Sanctuary (Alafia Bank, Hillsborough Bay), the        colony, and 73% of the banded chicks were never observed alive
state’s largest mixed colonial waterbird colony. The ten colonies      or dead. Based on band resightings, nesting success was
in Florida Bay were distributed among four regions: Northwest          estimated at only 0.46 c/n, much lower than the 1.76 c/n
(n = 1), Northeast (n = 3), Central (n = 2), and Southeast (n =        estimate based on nest monitoring. Only one fledgling remained
4). Three colonies in the northwestern region can experience           on the island by the Mar 7, 2008 survey.
heavy predation by American Crows when disturbed by humans
and were omitted from the banding program                              Northeastern Region: Deer Key
                                                                       All eight spoonbill nesting colonies were surveyed in the
Details of the banding procedure are described in Lorenz et al.        Northeastern region of Florida Bay. Only 41 nests were found,
2007, with the exception that banding did not occur at the             which is well below average, and is the lowest nest count for this
Washburn Jr. Sanctuary in 2008.                                        region during the period of continuous monitoring (Table 1).
                                                                       Only five of the eight colonies were active during the 2007-08
Spoonbill Monitoring Results                                           nesting season.

Northwestern Region: Sandy Key                                         Spoonbills have nested on Tern Key since monitoring began in
All five colonies in the Northwestern region were surveyed in          1983-84, but nesting was absent here during the 2007-08
2007-08 (Table 1). We counted a total of 204 nests, which is           breeding season. The lowest previous count was 60 nests in the
below the average of the last 23 years.                                1998-99 nesting season. We used Deer Key as a surrogate for
                                                                       Tern Key as it was the largest nesting colony in the Northeastern
Nest success surveys were conducted at Sandy Key on Oct 16,            region this nesting season. Note that Mean values for Tables 1
24, Nov 6, 20, 27, Dec 6, 11, 21, Jan 1, 9, 17, 23, Feb 9, and Mar     and 2 represent the historical focal colony for the sub-region,
7. All nests were initiated within 17 days of one another, which       not for the individual colony, as Deer Key has not traditionally
is somewhat synchronous compared to recent years. We                   been the focal colony for Northeastern Florida Bay.
estimate that the first eggs were laid on Nov 18 and the last on
Dec 5. The mean laying date was Nov 25, and the mean hatch             Spoonbill nest success surveys were conducted at Deer Key on
date was Dec 15. The number of nests found on Sandy Key (n             Oct 18, Nov 3, 19, Dec 5, 19, Jan 4, 10, 18, 25, and Feb 21. As
= 80) was well below that normally counted since 1984 (mean =          in recent years, the nesting effort for the main focal colony was
154). We marked 53 nests for revisitation but were able to             alarmingly small: only 15 nests in 2007-08 compared to almost
follow the outcome of only 21 nests due to the composition of          200 nests ten years ago and over 500 nests twenty-five years ago
the colony. Of these 21 nests, 90% were successful at raising          (for the previous main focal colony, Tern Key). At Deer Key,
chicks to at least 21d old (the age when they first leave the nest)    the first egg was laid on Dec 1 and the last on Dec 17; the mean
and they produced an average of 1.76 chicks per nesting attempt        laying date was Dec 10, and mean hatching date Dec 30. Again,
(c/n) which is above average of the past 23 years (1.30 c/n;           nesting was somewhat synchronous and occurred within a 16-
Table 2).                                                              day period. We believe this decline in northeastern Florida Bay
                                                                       is due to water management on the foraging grounds. Although
                                                                       this effort is small for the sub-region, this is the largest nesting
                                                                       effort for Deer Key since nests were discovered there in 2005-
                                                                       06. Deer Key birds were also relatively successful producing an
                                                                       averaging of 1.77 c/n compared to the average of 0.84 c/n since
                                                                       1984 (Table 2). All 15 of the nests initiated on the island were
                                                                       marked for revisitation. Of these, 87% were successful at raising
                                                                       chicks to 21d old. Total production for the colony was estimated
                                                                       at 23 chicks.

                                                                       In the northeastern region, 36 nestlings were banded from 18
The threshold fledging rate for a successful nesting is at least one   nests within 3 colonies (Deer, South Nest, and North Nest Keys;
c/n on average. Total production for Sandy Key was estimated           Table 3). Chicks were banded between Jan 4 and Jan 18. Sixty-
at 140 chicks fledged. This figure may be an over-estimation, as       seven percent of the banded chicks were observed post-fledging
no more than 40 fledglings were observed outside the colony,           but before they abandoned their natal colony for an estimated
and was probably a result of only calculating productivity based       production of 1.33 c/n, an average slightly below that estimated
on the outcomes of 21 of 53 nests. We have seen in the past that       by the Deer Key colony surveys. This high productivity and
although chicks reach the 21-day benchmark, the colony can             success rate along with Deer Key’s much better than average
subsequently experience a catastrophic collapse, which may also        nest success is a hopeful sign that those birds that nest in the
account for the low fledgling count. Sandy Key nesting was             Northeastern region, albeit in small numbers, are able to
successful in 2007-08 (as defined by the number of chicks              successfully produce young.
reaching 21 days) but care should be taken when interpreting this
result given the limitations of the data.

                                                                                                                       Wading Bird Report   15
A very small second nesting event (three nests) did occur at Deer   chicks were found dead before leaving their nests, and 51% were
Key in mid-February. This number provides some support for          observed alive post-fledging before they abandoned their natal
the hypothesis that second nesting is populated by birds that       colony. Based on the banding effort, the success rate in the
failed to produce or fledge young in the primary nesting. The       Southeastern region was 0.95 c/n, only slightly less than the
second nesting yielded two successful nests with an average of      Stake Key survey estimate.
one chick reaching 21d post-hatching per nest attempt. We
                                                                    The success rate observed through nest surveys is greater than
observed 3 fledglings at the colony post-nesting.
                                                                    last year’s 0.92 c/n attempt at Stake Key, and is also above the
                                                                    average 0.98 c/n since 1984. Historically, birds at the
Southeastern Region: Stake Key
                                                                    southeastern colonies foraged primarily in the mangrove
All of the twelve Southeastern colonies were surveyed for nesting
                                                                    wetlands on the mainline Florida Keys. Although most of these
activity in 2007-08 (Table 1).
                                                                    wetlands were filled by 1972 as part of Keys development boom,
Nest success surveys were conducted at Stake Key on Oct 17,         we presume (based on anecdotal evidence) that the few
30, Nov 13, 27, Dec 12, 19, 31, Jan 8, 15, 21, 28, and Feb 29.      remaining Keys wetlands still serve as important foraging
The first egg was laid on approximately Nov 28, with a mean lay     grounds for these birds. Since 1972 (when large scale filling of
date of Dec 9. The mean hatch date was Dec 29. Eleven nests         wetlands ended), nesting attempts in the Southeastern region
were initiated on the island. On average, each nest attempt         generally fared poorly: 8 of 12 years surveyed were failures
produced a successful 1.2 c/n.                                      (Table 2). The success of Stake Key birds is an exception to the
                                                                    historical trend. However, based on previous work (Lorenz et
We banded 35 nestlings from 19 nests within 4 colonies (E.
                                                                    al. 2001) it appears that the quality of the Southeastern region for
Butternut, Stake, Pigeon, and Bottle Keys, Table 3). Chicks were
                                                                    nesting spoonbills is marginal at best, thereby explaining the low
banded between Dec 31 and Jan 16. Approximately 9% of these
                                                                    overall effort. Prior to the Keys land boom spoonbills nesting in
                                                                    the Southeastern region successfully produced on average >2.00
                                                                    c/n (Lorenz et al. 2002).

          Figure 1. Map of Florida Bay indicating spoonbill colony locations (red circles) and nesting regions
          (blue circles). Arrows indicate the primary foraging area for each region. The dashed lines from the
          central region are speculative. Approximate locations of fish sampling sites are represented by green
          circles.


                                                                                                                    Wading Bird Report   16
Table 3. Number of ROSP banded in Florida Bay Dec 2007-Feb 2008, and in Tampa Bay, April 2008-May 2008.
 "Number of ROSP Resighted Alive" indicates the number of birds resighted after the age of 21+ days.
                                   Colonies where                                      Number of        Number of          Number of
                                      Roseate            Number of     Number of        ROSP             ROSP             ROSP where
                                   Spoonbills were         Nests        Chicks         Resighted        Resighted           Fate is
    Estuary       Sub-region          Banded              Banded        Banded           Alive            Dead             Unknown

  Florida Bay     Northwest       Sandy                      13             30           6 (20%)           2 (7%)           22 (73%)

                  Northeast       Deer                       11             20           15 (75%)             0              5 (25%)
                                  S. Nest                     6             14           8 (57%)              0              6 (43%)
                                  N. Nest                    1              2            1 (50%)              0              1 (50%)

                  Central         Calusa                     9              16           7 (44%)          1 (6%)            8 (50%)
                                  Jimmie Channel             10             18           3 (17%)          5 (28%)           10 (55%)

                  Southeast       Stake                      6             11            8 (73%)          2 (18%)             1 (9%)
                                  E. Butternut                2             2            1 (50%)              0             1 (50%)
                                  Pigeon                     6             10            4 (40%)              0             6 (60%)
                                  Bottle                     5             12            5 (42%)          1 (8%)             6 (50%)
                                  Florida Bay Total          69            135           58 (43%)         11 (8%)           66 (49%)

  Tampa Bay                       Alafia Bank                34             62           52 (84%)             0             10 (16%)


Central Region: Calusa Key                                             Spoonbills nesting in the Central region have reasonable access
A new nesting colony was discovered this year in the Central           to the entire mosaic of foraging habitats found in the other four
region for a total of ten colonies totaling 36 nests (Table 1). This   regions (Figure 1). This catholic foraging style may cost a little
new colony consists of one red mangrove on a mud bank along            more energetically (longer flights to foraging areas), but the
Black Betsy Key, and although not technically part of the main         increased likelihood of finding suitable foraging locations may
island of Black Betsy, it is named as such because of its proximity    counterbalance the cost. However, if the specific foraging
to the main island.                                                    habitats utilized by spoonbills in all of the other four regions
                                                                       become compromised, the spoonbills of the Central region
Nesting success surveys at Calusa Key were conducted on Oct            would also be affected negatively. If these foraging grounds do
22, Nov 5, 15, 29, Dec 7, 12, 20, 31, Jan 8, 15, 22, 28 and Mar 6.     not support abundant and concentrated prey, long flights to
Thirteen nests were found on Calusa, which is slightly above           more productive areas may be too energetically demanding for a
average (12.5 nests since 1984). The first egg was laid on Nov         spoonbill to make, resulting in lower nest success. Based on
20, and the last on Dec 7, with a mean laying date of Nov 29 and       flight-line counts and fixed-wing aircraft observations, it appears
mean hatching date of Dec 19. This year’s nesting was not              that the birds from the Central region are flying over the Russell
successful, only 50% of the nests successfully raised chicks to        and Black Betsy Keys to the Taylor Slough area to forage.
21d and produced on average only 0.92 c/n. This year was
slightly more productive than last year (0.76 chicks per nest          Southwestern Region: Twin Keys
attempt, 52% successful nest attempts). Total production for the       All keys in the southwestern region were surveyed multiple times
colony was estimated at 12 chicks, and this was confirmed              in 2007-08 but only one nest was found on Twin Key (Table 1).
through colony surveys.                                                This nest did produce young, and two chicks were observed post
                                                                       21 days hatching.
We banded 34 nestlings from 19 nests within 2 colonies (Jimmie
and Calusa Keys, Table 3) in the Central region. Chicks were           Bay-wide Synthesis
banded between Dec 12 and Jan 15. Approximately 29% of the             Bay-wide, Roseate Spoonbills nest numbers in 2007-2008 were
banded chicks were observed post-fledging before they                  the lowest on record (341 nests; Table 1), indicating a continued
abandoned the natal colony. The banding effort estimate for            downward spiral that began with completion of major water
production was 0.52 c/n, much lower than the survey estimate.          management structures in the early 1980s. Historically, the
                                                                       Northeastern region was the most productive region of the bay
Significant nesting in the Central region is a relatively new          (Lorenz et al. 2001). Since 1982, this region has been heavily
phenomenon, having started in the mid-1980s. As such, little           impacted by major water control structures that lie immediately
information has been collected on where these birds feed, but          upstream from the foraging grounds (Lorenz 2000). This year,
the central location suggests that they may opportunistically          the success rate at Deer Key was extraordinary and exceeded the
exploit the primary resources used by the other regions.               0.84 c/n average since 1984; however, the overall effort was
                                                                                                                      Wading Bird Report   17
astonishingly low for a focal colony, and the total number of       through 2005, but have not nested there in normal numbers the
nests for the Northeastern sub-region was abysmal. The              past two nesting seasons, probably due to a predator we have
historical focal colony of the Northeast bay, Tern Key, did not     not been able to remove.
produce a single nest. Nest efforts and success rates at Tern Key
have been decreasing for several years, but not since the early
1960s have birds completely abandoned the colony.

In all, 135 chicks were banded from 69 nests across Florida Bay.
Of these 8% were observed dead either before leaving the nest
or outside the colony and 43% were observed alive post-fledging.
No birds have been resighted outside of their natal colonies.

Comparison to Tampa Bay Nesting Population
We began banding spoonbill nestlings at the Alafia Bank, Tampa
Bay, in 2003 as part of a pilot study for the banding program.
The goals of this program were two-fold: 1) to determine the
movements of spoonbills within the state and the region and 2)
to get estimates of nesting success to compare to Florida Bay.
Reports of spoonbills producing greater than 2.0 c/n were
regularly reported throughout Florida Bay as late as the early
1970s. Following the destruction of wetlands in the Keys and
water diversion in the northeastern part of Florida Bay, the
average dropped below 1.0 c/n. Tampa Bay colonies provided
an opportunity to see how productive spoonbills were in another
part of the state to assess if this decline was unique to Florida
Bay or a more regional response. Answering this question is
critical to demonstrating the causal relationships between
Everglades management and the observed decline in Florida Bay.

In 2008, spoonbills nested in 10 colonies (Clearwater Harbor I-
25, Belleair Beach, Dogleg Key, Coffeepot Bayou, Alafia Bank,
Washburn, Washburn Jr., Dot Dash, Roberts Bay, and Lake
Somerset) in the greater Tampa Bay area, although two of the
colonies occupied in 2007 (Miguel Bay in Terra Ceia Bay and
Little Bird Key National Wildlife Refuge in Boca Ciega Bay) were
not occupied in 2008 and nesting occurred at two new colonies:
Belleair Beach (1 adult and a fledged brood of 3) and Lake
Somerset inland in Polk County (2 nests, with unfledged broods
of 2 young and 1 young as of July 5). This is the first nesting
report for Lake Somerset (Hodgson and Paul in prep.). The
largest colony in the region is the Richard T. Paul Alafia Bank     At the Alafia Bank, we banded 62 nestlings from 34 nests during
Bird Sanctuary in Hillsborough Bay, with 270 pairs (based on a      three banding sessions on May 7, 21 and 23 (Table 3). Of the 62
flightline survey conducted on May 1, adjusted by seasonal          nestlings banded, we resighted 52 (84%) of them alive as
productivity data) in 2008. A total of 172 fledged birds were       fledglings through July 9. Only 10 of the total birds banded
observed during one survey of the Alafia Bank colony this           were not resighted as of Jul 9. Based on our estimation of 1.53
season.                                                             fledged c/n (52 resighted nestlings/34 nests), we expect about
                                                                    413 spoonbills (270 nests @ 1.53 c/n) fledged from the Alafia
We conducted banding for the Tampa Bay area only at the Alafia      Bank. Based on the estimates from Alafia Bank, and our direct
Bank this year. The Little Bird Key (“Washburn Jr.”) colony in      counts or flight line estimates of spoonbill nests at the other
Terra Ceia Bay, usually the second largest colony regionally, was   occupied colonies this year we estimate a total of ≥441 chicks
occupied early in the nesting season and spoonbills had             fledged from ≥327 total nests (≥1.44 c/n) in 10 colonies in
commenced building platforms when the colony was checked on         Tampa Bay. Spoonbill nesting was affected by low rainfall and
Apr 9. We observed at least 12 pairs, which was much fewer          summer drought in the two summers preceding this nesting
than in 2007. At a follow-up inspection on May 15 we                season, followed by heavy rainfall early this spring, which
determined that a raccoon had apparently swum out to the            discouraged birds at the beginning of the nesting season and
island, which is only about 150 m offshore from a populated         caused a slower onset of spoonbill nesting. From late March to
area, in the intervals since our earlier visit because we found     mid-June water levels fell low through a bad drought, then in
raccoon tracks and most of the colony had been abandoned.           early July we had heavy rainfall just as the spoonbills were trying
The spoonbills had left Washburn Jr. and we found a few             to bring off their fledges and, going into the end of the fledging
building new platforms at the Nina Griffith Washburn Sanctuary      period, the water levels are way up and forage availability is
about 2.6 km north. Spoonbills had been nesting at Washburn         becoming limited so that fledges that should have already left the
                                                                                                                   Wading Bird Report   18
Wading Bird Report Honors Three Young Ecologists Who Died Conducting Research

More Related Content

What's hot

UW WSM - Practicum final draft
UW WSM - Practicum final draftUW WSM - Practicum final draft
UW WSM - Practicum final draftEthan Huffaker
 
Abundance of commercial bivalves
Abundance of commercial bivalvesAbundance of commercial bivalves
Abundance of commercial bivalvesRodney Peñafiel
 
Research Proposal - Are the Adélie penguin, Pygoscelis adeliae, populations w...
Research Proposal - Are the Adélie penguin, Pygoscelis adeliae, populations w...Research Proposal - Are the Adélie penguin, Pygoscelis adeliae, populations w...
Research Proposal - Are the Adélie penguin, Pygoscelis adeliae, populations w...ElizabethHowarth1
 
Gonczar_Argonne_Research_Paper_Final_ (1)
Gonczar_Argonne_Research_Paper_Final_ (1)Gonczar_Argonne_Research_Paper_Final_ (1)
Gonczar_Argonne_Research_Paper_Final_ (1)Michael Gonczar
 
Haberlin et al, 2016, Diversity and occurrence of siphonophores in Irish coas...
Haberlin et al, 2016, Diversity and occurrence of siphonophores in Irish coas...Haberlin et al, 2016, Diversity and occurrence of siphonophores in Irish coas...
Haberlin et al, 2016, Diversity and occurrence of siphonophores in Irish coas...Damien Haberlin
 
V8 Supercar Race, Sydney Olympic Park and Waterbird Impacts.
V8 Supercar Race, Sydney Olympic Park and Waterbird Impacts.V8 Supercar Race, Sydney Olympic Park and Waterbird Impacts.
V8 Supercar Race, Sydney Olympic Park and Waterbird Impacts.Dr Stephen Ambrose
 
Trends in Macrophyte Diversity in Anthropogenic Perturbed Lentic Ecosystems w...
Trends in Macrophyte Diversity in Anthropogenic Perturbed Lentic Ecosystems w...Trends in Macrophyte Diversity in Anthropogenic Perturbed Lentic Ecosystems w...
Trends in Macrophyte Diversity in Anthropogenic Perturbed Lentic Ecosystems w...Premier Publishers
 
Croton Gorge Slide33slides
Croton Gorge Slide33slidesCroton Gorge Slide33slides
Croton Gorge Slide33slidesLeo Wiegman
 
Aspects of life-history strategy of Marcusenius senegalensis (Pisces: Osteogl...
Aspects of life-history strategy of Marcusenius senegalensis (Pisces: Osteogl...Aspects of life-history strategy of Marcusenius senegalensis (Pisces: Osteogl...
Aspects of life-history strategy of Marcusenius senegalensis (Pisces: Osteogl...AI Publications
 
Final Form
Final FormFinal Form
Final Formssg5034
 
Factors Contributing to the Decline of the Anchovy Fisheries in Krueng Raya B...
Factors Contributing to the Decline of the Anchovy Fisheries in Krueng Raya B...Factors Contributing to the Decline of the Anchovy Fisheries in Krueng Raya B...
Factors Contributing to the Decline of the Anchovy Fisheries in Krueng Raya B...Zulhamsyah Imran
 

What's hot (20)

Grimaldo2009MCF
Grimaldo2009MCFGrimaldo2009MCF
Grimaldo2009MCF
 
Grimaldo_et_al_2004
Grimaldo_et_al_2004Grimaldo_et_al_2004
Grimaldo_et_al_2004
 
UW WSM - Practicum final draft
UW WSM - Practicum final draftUW WSM - Practicum final draft
UW WSM - Practicum final draft
 
Abundance of commercial bivalves
Abundance of commercial bivalvesAbundance of commercial bivalves
Abundance of commercial bivalves
 
Research Proposal - Are the Adélie penguin, Pygoscelis adeliae, populations w...
Research Proposal - Are the Adélie penguin, Pygoscelis adeliae, populations w...Research Proposal - Are the Adélie penguin, Pygoscelis adeliae, populations w...
Research Proposal - Are the Adélie penguin, Pygoscelis adeliae, populations w...
 
Gonczar_Argonne_Research_Paper_Final_ (1)
Gonczar_Argonne_Research_Paper_Final_ (1)Gonczar_Argonne_Research_Paper_Final_ (1)
Gonczar_Argonne_Research_Paper_Final_ (1)
 
R_KingSpreeDayPoster'16
R_KingSpreeDayPoster'16R_KingSpreeDayPoster'16
R_KingSpreeDayPoster'16
 
Haberlin et al, 2016, Diversity and occurrence of siphonophores in Irish coas...
Haberlin et al, 2016, Diversity and occurrence of siphonophores in Irish coas...Haberlin et al, 2016, Diversity and occurrence of siphonophores in Irish coas...
Haberlin et al, 2016, Diversity and occurrence of siphonophores in Irish coas...
 
V8 Supercar Race, Sydney Olympic Park and Waterbird Impacts.
V8 Supercar Race, Sydney Olympic Park and Waterbird Impacts.V8 Supercar Race, Sydney Olympic Park and Waterbird Impacts.
V8 Supercar Race, Sydney Olympic Park and Waterbird Impacts.
 
APS_Vol13-Issue2_48-53_Woody
APS_Vol13-Issue2_48-53_WoodyAPS_Vol13-Issue2_48-53_Woody
APS_Vol13-Issue2_48-53_Woody
 
Metapop Case Study
Metapop Case StudyMetapop Case Study
Metapop Case Study
 
Trends in Macrophyte Diversity in Anthropogenic Perturbed Lentic Ecosystems w...
Trends in Macrophyte Diversity in Anthropogenic Perturbed Lentic Ecosystems w...Trends in Macrophyte Diversity in Anthropogenic Perturbed Lentic Ecosystems w...
Trends in Macrophyte Diversity in Anthropogenic Perturbed Lentic Ecosystems w...
 
Croton Gorge Slide33slides
Croton Gorge Slide33slidesCroton Gorge Slide33slides
Croton Gorge Slide33slides
 
Aspects of life-history strategy of Marcusenius senegalensis (Pisces: Osteogl...
Aspects of life-history strategy of Marcusenius senegalensis (Pisces: Osteogl...Aspects of life-history strategy of Marcusenius senegalensis (Pisces: Osteogl...
Aspects of life-history strategy of Marcusenius senegalensis (Pisces: Osteogl...
 
The Wallow
The WallowThe Wallow
The Wallow
 
42 43
42 4342 43
42 43
 
Final Form
Final FormFinal Form
Final Form
 
Eops 2012 08_27
Eops 2012 08_27Eops 2012 08_27
Eops 2012 08_27
 
Grimaldo tidal marsh
Grimaldo tidal marshGrimaldo tidal marsh
Grimaldo tidal marsh
 
Factors Contributing to the Decline of the Anchovy Fisheries in Krueng Raya B...
Factors Contributing to the Decline of the Anchovy Fisheries in Krueng Raya B...Factors Contributing to the Decline of the Anchovy Fisheries in Krueng Raya B...
Factors Contributing to the Decline of the Anchovy Fisheries in Krueng Raya B...
 

Similar to Wading Bird Report Honors Three Young Ecologists Who Died Conducting Research

South Florida Wading Bird Report 2011
South Florida Wading Bird Report 2011South Florida Wading Bird Report 2011
South Florida Wading Bird Report 2011Mac Kobza
 
Adélie Penguin Population Trends in Cape Bird
Adélie Penguin Population Trends in Cape BirdAdélie Penguin Population Trends in Cape Bird
Adélie Penguin Population Trends in Cape BirdJessica Carde
 
Effect of dam on biodiversity
Effect of dam on biodiversityEffect of dam on biodiversity
Effect of dam on biodiversityrenjith rk
 
Problem of ghana national bird sanctuary,india
Problem of ghana national bird sanctuary,indiaProblem of ghana national bird sanctuary,india
Problem of ghana national bird sanctuary,indiaammod
 
Upper Colorado River Endangered Fish Recovery Program
Upper Colorado River Endangered  Fish Recovery ProgramUpper Colorado River Endangered  Fish Recovery Program
Upper Colorado River Endangered Fish Recovery ProgramState of Utah, Salt Lake City
 
Angelica Morales - Final Proposal
Angelica Morales - Final ProposalAngelica Morales - Final Proposal
Angelica Morales - Final ProposalA. Cathy Morales
 
South West Habitat Guidelines
South West Habitat GuidelinesSouth West Habitat Guidelines
South West Habitat GuidelinesPitchstone Waters
 
2008 quelônios delta_jacui_ing
2008 quelônios delta_jacui_ing2008 quelônios delta_jacui_ing
2008 quelônios delta_jacui_ingProjeto Chelonia
 
GEOG336_Campbell_Final_Draft
GEOG336_Campbell_Final_DraftGEOG336_Campbell_Final_Draft
GEOG336_Campbell_Final_DraftBenjamin Campbell
 
Hawaii - The Vanishing Hawaiian Forests - Saving Ohia Forests - Pathways
Hawaii - The Vanishing Hawaiian Forests - Saving Ohia Forests - PathwaysHawaii - The Vanishing Hawaiian Forests - Saving Ohia Forests - Pathways
Hawaii - The Vanishing Hawaiian Forests - Saving Ohia Forests - PathwaysClifton M. Hasegawa & Associates, LLC
 
(FINAL) ROUGH DRAFT FOR SENIOR RESEARCH Jennifer Edit 4-14-15
(FINAL) ROUGH DRAFT FOR SENIOR RESEARCH  Jennifer Edit 4-14-15(FINAL) ROUGH DRAFT FOR SENIOR RESEARCH  Jennifer Edit 4-14-15
(FINAL) ROUGH DRAFT FOR SENIOR RESEARCH Jennifer Edit 4-14-15Jennifer Cherry
 

Similar to Wading Bird Report Honors Three Young Ecologists Who Died Conducting Research (20)

South Florida Wading Bird Report 2011
South Florida Wading Bird Report 2011South Florida Wading Bird Report 2011
South Florida Wading Bird Report 2011
 
UWV draft 3
UWV draft 3UWV draft 3
UWV draft 3
 
Grimaldo Salvage
Grimaldo SalvageGrimaldo Salvage
Grimaldo Salvage
 
Adélie Penguin Population Trends in Cape Bird
Adélie Penguin Population Trends in Cape BirdAdélie Penguin Population Trends in Cape Bird
Adélie Penguin Population Trends in Cape Bird
 
Effect of dam on biodiversity
Effect of dam on biodiversityEffect of dam on biodiversity
Effect of dam on biodiversity
 
koaro poster
koaro posterkoaro poster
koaro poster
 
Problem of ghana national bird sanctuary,india
Problem of ghana national bird sanctuary,indiaProblem of ghana national bird sanctuary,india
Problem of ghana national bird sanctuary,india
 
Essay finished
Essay finishedEssay finished
Essay finished
 
Upper Colorado River Endangered Fish Recovery Program
Upper Colorado River Endangered  Fish Recovery ProgramUpper Colorado River Endangered  Fish Recovery Program
Upper Colorado River Endangered Fish Recovery Program
 
Artigo_Bioterra_V23_N2_08
Artigo_Bioterra_V23_N2_08Artigo_Bioterra_V23_N2_08
Artigo_Bioterra_V23_N2_08
 
M. Stoever Final Assignment
M. Stoever Final AssignmentM. Stoever Final Assignment
M. Stoever Final Assignment
 
Angelica Morales - Final Proposal
Angelica Morales - Final ProposalAngelica Morales - Final Proposal
Angelica Morales - Final Proposal
 
South West Habitat Guidelines
South West Habitat GuidelinesSouth West Habitat Guidelines
South West Habitat Guidelines
 
McHugh proof
McHugh proofMcHugh proof
McHugh proof
 
Toft et al
Toft et alToft et al
Toft et al
 
2008 quelônios delta_jacui_ing
2008 quelônios delta_jacui_ing2008 quelônios delta_jacui_ing
2008 quelônios delta_jacui_ing
 
GEOG336_Campbell_Final_Draft
GEOG336_Campbell_Final_DraftGEOG336_Campbell_Final_Draft
GEOG336_Campbell_Final_Draft
 
Does Moderate Ocean Noise Disrupt Foraging?
Does Moderate Ocean Noise Disrupt Foraging?Does Moderate Ocean Noise Disrupt Foraging?
Does Moderate Ocean Noise Disrupt Foraging?
 
Hawaii - The Vanishing Hawaiian Forests - Saving Ohia Forests - Pathways
Hawaii - The Vanishing Hawaiian Forests - Saving Ohia Forests - PathwaysHawaii - The Vanishing Hawaiian Forests - Saving Ohia Forests - Pathways
Hawaii - The Vanishing Hawaiian Forests - Saving Ohia Forests - Pathways
 
(FINAL) ROUGH DRAFT FOR SENIOR RESEARCH Jennifer Edit 4-14-15
(FINAL) ROUGH DRAFT FOR SENIOR RESEARCH  Jennifer Edit 4-14-15(FINAL) ROUGH DRAFT FOR SENIOR RESEARCH  Jennifer Edit 4-14-15
(FINAL) ROUGH DRAFT FOR SENIOR RESEARCH Jennifer Edit 4-14-15
 

More from Mac Kobza

BOCO_ERE_Update_10132015
BOCO_ERE_Update_10132015BOCO_ERE_Update_10132015
BOCO_ERE_Update_10132015Mac Kobza
 
wildlifereport2014
wildlifereport2014wildlifereport2014
wildlifereport2014Mac Kobza
 
wildlifereport2013
wildlifereport2013wildlifereport2013
wildlifereport2013Mac Kobza
 
wildlifereport2012
wildlifereport2012wildlifereport2012
wildlifereport2012Mac Kobza
 
wildlifereport2011
wildlifereport2011wildlifereport2011
wildlifereport2011Mac Kobza
 
Preliminary Draft SensitiveGISDataPolicy
Preliminary Draft SensitiveGISDataPolicyPreliminary Draft SensitiveGISDataPolicy
Preliminary Draft SensitiveGISDataPolicyMac Kobza
 
Environmental resource element of the boulder county comprehensive plan 2014
Environmental resource element of the boulder county comprehensive plan 2014Environmental resource element of the boulder county comprehensive plan 2014
Environmental resource element of the boulder county comprehensive plan 2014Mac Kobza
 

More from Mac Kobza (7)

BOCO_ERE_Update_10132015
BOCO_ERE_Update_10132015BOCO_ERE_Update_10132015
BOCO_ERE_Update_10132015
 
wildlifereport2014
wildlifereport2014wildlifereport2014
wildlifereport2014
 
wildlifereport2013
wildlifereport2013wildlifereport2013
wildlifereport2013
 
wildlifereport2012
wildlifereport2012wildlifereport2012
wildlifereport2012
 
wildlifereport2011
wildlifereport2011wildlifereport2011
wildlifereport2011
 
Preliminary Draft SensitiveGISDataPolicy
Preliminary Draft SensitiveGISDataPolicyPreliminary Draft SensitiveGISDataPolicy
Preliminary Draft SensitiveGISDataPolicy
 
Environmental resource element of the boulder county comprehensive plan 2014
Environmental resource element of the boulder county comprehensive plan 2014Environmental resource element of the boulder county comprehensive plan 2014
Environmental resource element of the boulder county comprehensive plan 2014
 

Recently uploaded

Chandrayaan 3 Successful Moon Landing Mission.pdf
Chandrayaan 3 Successful Moon Landing Mission.pdfChandrayaan 3 Successful Moon Landing Mission.pdf
Chandrayaan 3 Successful Moon Landing Mission.pdfauroraaudrey4826
 
Opportunities, challenges, and power of media and information
Opportunities, challenges, and power of media and informationOpportunities, challenges, and power of media and information
Opportunities, challenges, and power of media and informationReyMonsales
 
Dynamics of Destructive Polarisation in Mainstream and Social Media: The Case...
Dynamics of Destructive Polarisation in Mainstream and Social Media: The Case...Dynamics of Destructive Polarisation in Mainstream and Social Media: The Case...
Dynamics of Destructive Polarisation in Mainstream and Social Media: The Case...Axel Bruns
 
VIP Girls Available Call or WhatsApp 9711199012
VIP Girls Available Call or WhatsApp 9711199012VIP Girls Available Call or WhatsApp 9711199012
VIP Girls Available Call or WhatsApp 9711199012ankitnayak356677
 
Quiz for Heritage Indian including all the rounds
Quiz for Heritage Indian including all the roundsQuiz for Heritage Indian including all the rounds
Quiz for Heritage Indian including all the roundsnaxymaxyy
 
Manipur-Book-Final-2-compressed.pdfsal'rpk
Manipur-Book-Final-2-compressed.pdfsal'rpkManipur-Book-Final-2-compressed.pdfsal'rpk
Manipur-Book-Final-2-compressed.pdfsal'rpkbhavenpr
 
Top 10 Wealthiest People In The World.pdf
Top 10 Wealthiest People In The World.pdfTop 10 Wealthiest People In The World.pdf
Top 10 Wealthiest People In The World.pdfauroraaudrey4826
 
Brief biography of Julius Robert Oppenheimer
Brief biography of Julius Robert OppenheimerBrief biography of Julius Robert Oppenheimer
Brief biography of Julius Robert OppenheimerOmarCabrera39
 
complaint-ECI-PM-media-1-Chandru.pdfra;;prfk
complaint-ECI-PM-media-1-Chandru.pdfra;;prfkcomplaint-ECI-PM-media-1-Chandru.pdfra;;prfk
complaint-ECI-PM-media-1-Chandru.pdfra;;prfkbhavenpr
 
Global Terrorism and its types and prevention ppt.
Global Terrorism and its types and prevention ppt.Global Terrorism and its types and prevention ppt.
Global Terrorism and its types and prevention ppt.NaveedKhaskheli1
 
N Chandrababu Naidu Launches 'Praja Galam' As Part of TDP’s Election Campaign
N Chandrababu Naidu Launches 'Praja Galam' As Part of TDP’s Election CampaignN Chandrababu Naidu Launches 'Praja Galam' As Part of TDP’s Election Campaign
N Chandrababu Naidu Launches 'Praja Galam' As Part of TDP’s Election Campaignanjanibaddipudi1
 
57 Bidens Annihilation Nation Policy.pdf
57 Bidens Annihilation Nation Policy.pdf57 Bidens Annihilation Nation Policy.pdf
57 Bidens Annihilation Nation Policy.pdfGerald Furnkranz
 
Referendum Party 2024 Election Manifesto
Referendum Party 2024 Election ManifestoReferendum Party 2024 Election Manifesto
Referendum Party 2024 Election ManifestoSABC News
 
HARNESSING AI FOR ENHANCED MEDIA ANALYSIS A CASE STUDY ON CHATGPT AT DRONE EM...
HARNESSING AI FOR ENHANCED MEDIA ANALYSIS A CASE STUDY ON CHATGPT AT DRONE EM...HARNESSING AI FOR ENHANCED MEDIA ANALYSIS A CASE STUDY ON CHATGPT AT DRONE EM...
HARNESSING AI FOR ENHANCED MEDIA ANALYSIS A CASE STUDY ON CHATGPT AT DRONE EM...Ismail Fahmi
 
AP Election Survey 2024: TDP-Janasena-BJP Alliance Set To Sweep Victory
AP Election Survey 2024: TDP-Janasena-BJP Alliance Set To Sweep VictoryAP Election Survey 2024: TDP-Janasena-BJP Alliance Set To Sweep Victory
AP Election Survey 2024: TDP-Janasena-BJP Alliance Set To Sweep Victoryanjanibaddipudi1
 
Different Frontiers of Social Media War in Indonesia Elections 2024
Different Frontiers of Social Media War in Indonesia Elections 2024Different Frontiers of Social Media War in Indonesia Elections 2024
Different Frontiers of Social Media War in Indonesia Elections 2024Ismail Fahmi
 

Recently uploaded (16)

Chandrayaan 3 Successful Moon Landing Mission.pdf
Chandrayaan 3 Successful Moon Landing Mission.pdfChandrayaan 3 Successful Moon Landing Mission.pdf
Chandrayaan 3 Successful Moon Landing Mission.pdf
 
Opportunities, challenges, and power of media and information
Opportunities, challenges, and power of media and informationOpportunities, challenges, and power of media and information
Opportunities, challenges, and power of media and information
 
Dynamics of Destructive Polarisation in Mainstream and Social Media: The Case...
Dynamics of Destructive Polarisation in Mainstream and Social Media: The Case...Dynamics of Destructive Polarisation in Mainstream and Social Media: The Case...
Dynamics of Destructive Polarisation in Mainstream and Social Media: The Case...
 
VIP Girls Available Call or WhatsApp 9711199012
VIP Girls Available Call or WhatsApp 9711199012VIP Girls Available Call or WhatsApp 9711199012
VIP Girls Available Call or WhatsApp 9711199012
 
Quiz for Heritage Indian including all the rounds
Quiz for Heritage Indian including all the roundsQuiz for Heritage Indian including all the rounds
Quiz for Heritage Indian including all the rounds
 
Manipur-Book-Final-2-compressed.pdfsal'rpk
Manipur-Book-Final-2-compressed.pdfsal'rpkManipur-Book-Final-2-compressed.pdfsal'rpk
Manipur-Book-Final-2-compressed.pdfsal'rpk
 
Top 10 Wealthiest People In The World.pdf
Top 10 Wealthiest People In The World.pdfTop 10 Wealthiest People In The World.pdf
Top 10 Wealthiest People In The World.pdf
 
Brief biography of Julius Robert Oppenheimer
Brief biography of Julius Robert OppenheimerBrief biography of Julius Robert Oppenheimer
Brief biography of Julius Robert Oppenheimer
 
complaint-ECI-PM-media-1-Chandru.pdfra;;prfk
complaint-ECI-PM-media-1-Chandru.pdfra;;prfkcomplaint-ECI-PM-media-1-Chandru.pdfra;;prfk
complaint-ECI-PM-media-1-Chandru.pdfra;;prfk
 
Global Terrorism and its types and prevention ppt.
Global Terrorism and its types and prevention ppt.Global Terrorism and its types and prevention ppt.
Global Terrorism and its types and prevention ppt.
 
N Chandrababu Naidu Launches 'Praja Galam' As Part of TDP’s Election Campaign
N Chandrababu Naidu Launches 'Praja Galam' As Part of TDP’s Election CampaignN Chandrababu Naidu Launches 'Praja Galam' As Part of TDP’s Election Campaign
N Chandrababu Naidu Launches 'Praja Galam' As Part of TDP’s Election Campaign
 
57 Bidens Annihilation Nation Policy.pdf
57 Bidens Annihilation Nation Policy.pdf57 Bidens Annihilation Nation Policy.pdf
57 Bidens Annihilation Nation Policy.pdf
 
Referendum Party 2024 Election Manifesto
Referendum Party 2024 Election ManifestoReferendum Party 2024 Election Manifesto
Referendum Party 2024 Election Manifesto
 
HARNESSING AI FOR ENHANCED MEDIA ANALYSIS A CASE STUDY ON CHATGPT AT DRONE EM...
HARNESSING AI FOR ENHANCED MEDIA ANALYSIS A CASE STUDY ON CHATGPT AT DRONE EM...HARNESSING AI FOR ENHANCED MEDIA ANALYSIS A CASE STUDY ON CHATGPT AT DRONE EM...
HARNESSING AI FOR ENHANCED MEDIA ANALYSIS A CASE STUDY ON CHATGPT AT DRONE EM...
 
AP Election Survey 2024: TDP-Janasena-BJP Alliance Set To Sweep Victory
AP Election Survey 2024: TDP-Janasena-BJP Alliance Set To Sweep VictoryAP Election Survey 2024: TDP-Janasena-BJP Alliance Set To Sweep Victory
AP Election Survey 2024: TDP-Janasena-BJP Alliance Set To Sweep Victory
 
Different Frontiers of Social Media War in Indonesia Elections 2024
Different Frontiers of Social Media War in Indonesia Elections 2024Different Frontiers of Social Media War in Indonesia Elections 2024
Different Frontiers of Social Media War in Indonesia Elections 2024
 

Wading Bird Report Honors Three Young Ecologists Who Died Conducting Research

  • 1. SOUTH FLORIDA WADING BIRD REPORT Volume 14 Mark I. Cook and Mac Kobza, Editors November 2008 IN MEMORY The contributors and editors of the South Florida Wading Bird Report dedicate this year’s issue to the memory of Damion Marx, Phil Heidemann and Gareth Akerman, three young ecologists who tragically lost their lives on March 13, 2008 while conducting an aerial survey of wading birds around Lake Okeechobee. Damion, Phil and Gareth were research students and professionals in the lab of Dale Gawlik at Florida Atlantic University, Boca Raton. Damion was close to finishing his PhD dissertation on the influence of patch structure on wading bird foraging patterns, Phil was an M.S. candidate developing a landscape suitability index for Wood Stork and White Ibis in Damion Marx southwestern Florida, and Gareth was looking to gain additional experience in conservation biology after recently completing his Masters dissertation on the role of riparian buffers in forest bird conservation at Dalhousie University, Canada. There is no question that all had a sense of adventure, a desire to improve our world and fervor for understanding and protecting nature. All were devoted to advancing wading bird conservation and Everglades restoration. They risked and lost their lives in the backwaters of south Florida, doing what they loved and what they passionately believed would benefit the ecosystems of south Florida. They will be sorely missed by their colleagues, but neither they nor their important research will be forgotten. Further words from their mentor and good friend, Dale Gawlik, can be found at the link below. Phil Heidemann http://www.science.fau.edu/biology/gawliklab/memorial/ memorial.html Gareth Akerman Wading Bird Report 1
  • 2. for two consecutive years (see special section). White Ibis SYSTEM-WIDE SUMMARY numbers were down 61% on last year and 64% lower than the past ten years. Roseate Spoonbill nest numbers were the lowest Water-year 2008 (May 2007 through Apr 2008) included the tail- since records began in 1983. end of an official two-year drought and started with below average stage and a delayed onset to the wet season. Annual Nesting effort in the Everglades is rarely distributed uniformly rainfall was generally above average, particularly in the northern among regions. In 2008, WCA-1 supported the most nests WCAs, but its timing was far from normal with limited (71%) followed by WCA-3 (23%), whereas ENP supported only precipitation during the wet season and multiple large rain events 6%. This spatial distribution of nests continues the recent trend during the dry season. This resulted in below average stages and of an annual increase in the proportion of birds nesting in WCA- generally dry conditions at the onset of wading bird nesting, and 1 at the expense of nesting in WCA-3. ENP historically a series of rainfall induced reversals during peak nesting. supported the largest number of nests in the system at the traditional estuarine “rookeries” downstream of Shark Slough. The estimated number of wading bird nests in South Florida in Nesting effort in the estuaries has increased gradually over recent 2008 was 18,418. This is a 51% decrease relative to last year’s years (e.g., 20% in 2006) but this year these regions supported season, 74% less than the 68,750 nests of 2002, which was the only minimum nesting. CERP’s goal is to increase the best nesting year on record in South Florida since the 1940s, and proportion of birds nesting in this estuarine ecotone. Another 59% less than the average of the last eight years. This year, pattern over the past ten years has been for a large proportion of counts from J. N. ‘Ding’ Darling National Wildlife Refuge nests in South Florida to be concentrated in a single large colony Complex are included in the total after a survey hiatus of two (Alley North) located in northeast WCA-3A. For two years. consecutive breeding seasons Alley North and the adjacent marsh dried prior to breeding and nesting was not initiated at the Systematic nest survey coverage was expanded in 2005 to include colony. Lake Okeechobee and the recently restored section of the Kissimmee River floodplain. In 2008, we expand coverage further with the introduction of nest counts from Estero Bay Aquatic Preserve. For Lake Okeechobee, 2008 ranks as the Locations of wading bird colonies with ≥ 50 worst nesting year on record with a peak of only 39 nests. This is nests in South Florida, 2008. a dramatic reduction on the 11,310 nests observed in 2006 and lower even than the poor nesting effort of 2007 when 774 nests Kissimmee River were recorded. On the restored sections of the Kissimmee floodplain, the timing and magnitude of floodplain inundation and recession are not yet optimal for colony formation, and nesting has been very limited in recent decades. In 2008 only six Lake Okeechobee nests were recorded on the floodplain. Implementation of the regulation schedule for the Headwaters Revitalization Project in Solid Waste Authority 2010 will allow water managers to more closely mimic the Caloosahatchee WCA 1 historical stage and discharge characteristics of the river, Ding River Rotenberger and (Loxahatchee presumably leading to suitable hydrologic conditions for wading Darling Holey Land WMA NWR) bird nesting colonies. Estero Bay supported 206 wading bird Estero nests in 2008. Note that the totals for these three regions are not Bay WCA 3 WCA 2 included in the system-wide total. BCNP All species of wading birds suffered significantly reduced nest numbers relative to the past ten years. For example, Wood Stork Southwest reproduction was very much reduced and this was the first time Coast that nesting was not initiated at the historical Corkscrew colony ENP INSIDE THIS ISSUE 3 Hydrology 2008 Florida Bay 7 Regional Nesting Reports 32 Regional Bird Abundance Generally, nesting was not successful for most species. Many 43 Population Recovery Status 2008 birds abandoned nests throughout the system after rain-induced water level reversals in March and April. In the few places that 45 Special Topics Wood Storks attempted to nest in the Everglades (Paurotis Pond and Cuthbert Lake) all nests failed following these rain events. However, the presence of large numbers of mature White Ibis Wading Bird Report 2
  • 3. nestling at Lox West colony in July suggested that late-nesting ibis in WCA-1 were reasonably successful. HYDROLOGY 2008 Two of four species-groups, White Ibis and Great Egrets, met The amount of rain in the Everglades Protection Area (EPA) for the numeric nesting targets proposed by the South Florida Water Year 2008 (WY08 May 1, 2007 through April 30, 2008) Ecosystem Restoration Task Force. Two other targets for the was greater than last year by as much as 10.6 inches, in WCA-1, Everglades restoration are an increase in the number of nesting or by as little as 4.6 inches, in WCA-3. Most of this added wading birds in the coastal Everglades and a shift in the timing rainfall fell during the dry season, during wading bird nesting, of Wood Stork nesting to earlier in the breeding season (Ogden, making wading bird foraging conditions less than favorable. The 1994). The 2008 nesting year showed no improvement in the rainfall and associated stage readings for WY2008 are shown in timing of Wood Stork nesting or a general shift of colony Table 1 below. Water Conservation Areas 1 and 2 saw a 7% locations. increase in historic rainfall amounts and a 24% increase over WY07. On–the-other-hand, Water Conservation Areas 3 saw a Although reproductive output was limited this year, Systematic 5% decrease in historic rainfall amounts and only a 10% increase Reconnaissance Flight surveys revealed that the Everglades was over WY07. The Everglades National Park (ENP) saw a 10% an important foraging area in WY2008. A total of 632,016 birds increase in historic rainfall amounts and a 15% increase over were counted in the WCAs and ENP between December 2007 WY07. It is interesting to note that after a year of severe and June 2008, which is 29% more than the five-year average. drought, the maximum stage for WCA-1 in WY08 came close to The temporal patterns of abundance in 2008 were remarkably the historic maximum stage. This kind of hydrology may account similar to last year, with high numbers observed from December for the resilience of the wading bird populations that were through March followed by a marked decline from April as clustering in this region in WY08. water levels increased. On the restored sections of the Kissimmee River floodplain the mean number of birds per In WY08 most of the rain fell during the wet season months of square kilometer rebounded after the post-restoration low of June and September and then again during the dry season 2007, but this was less than a third of the density observed in months of February, March and April. In ENP, rain in June was 2006. 13.28 inches and in September was 10.99 inches creating a pulse- like hydrograph (see Figure 1). In March to April monthly This year’s poor reproductive effort and success were almost rainfall in the Park averaged about 2.75 inches. In the WCA’s, certainly due to two preceding years of drought and its affect on rain in June was about 8.5 inches and in September was about system-wide prey productivity. Low stages and short 9.0 inches. In the WCA’s there were only two months out of the hydroperiods are not conducive to fish and crayfish production, year that rainfall dropped below 1 inch for the month. In the and many areas in WY2007 and WY2008 were characterized by Park rainfall was below 1 inch from November through January. reduced dry-season prey densities (D Gawlik pers. com.) and As shown in the following hydrographs, what might be expected nestling diets that contained high proportions of terrestrial prey from an above average annual rainfall following a year of (M Cook pers. obs.). WY2008 did receive higher than average drought (i.e., a return to good foraging conditions for wading annual precipitation, but much of this rain fell too late to benefit birds) did not come to fruition in water year 2008. aquatic fauna and instead fell during the dry-season causing widespread water-level reversals and the dispersal of an already The following hydropattern figures highlight the average stage limited prey base. This appeared to result in wide-spread nesting changes in each of the WCAs for the last two years in relation to failure for those birds that did attempt nesting. WCA-1 the recent historic averages, flooding tolerances for tree islands, experienced less severe drought conditions relative to other parts drought tolerances for wetland peat, and recession rates and of the Everglades, and this may account for the increased depths that support both nesting initiation and foraging success nesting effort in this area. It is unclear why numbers of foraging by wading birds. These indices were used by the SFWMD to birds should increase during drought years but it may be due to a facilitate weekly operational discussions and decisions. Tree lack of suitable foraging conditions elsewhere in south Florida. island flooding tolerances are considered exceeded when depths on the islands are greater than 1 foot for more than Mark I. Cook 120 days (Wu and Sklar, 2002). Drought tolerances are Mac Kobza considered exceeded when water levels are greater than 1 foot Everglades Division below ground for more than 30 days, i.e., the criteria for South Florida Water Management District Minimum Flows and Levels in the Everglades (SFWMD, 2003). 3301 Gun Club Road, West Palm Beach, FL 33406 Figure 1 shows the ground elevations in the WCAs as being 561-686-8800 essentially the same as the threshold for peat conservation. The mcook@sfwmd.gov wading bird nesting period is divided into three simple categories rkobza@sfwmd.gov (red, yellow, and green) based upon foraging conditions in the Everglades (Gawlik et al. 2004). A red label indicates poor Literature Cited conditions due to recession rates that are too fast (greater than Ogden, J.C. 1994. Status of Wading Bird Recovery. D.E. Gawlik, ed. In: 0.6 foot per week) or too slow (less than 0.04 foot for more than South Florida Wading Bird Report. Vol. 3, South Florida Water two weeks). A red label is also given when the average depth Management District, West Palm Beach, FL. change for the week is positive rather than negative. A yellow label indicates fair conditions due to a slow recession rate of 0.04 foot for a week or a rapid recession between 0.17 foot and 0.6 Wading Bird Report 3
  • 4. foot per week. A green/good label is assigned when water depth islands for a period of 1-2 months, which is not enough to decreased between 0.05 foot and 0.16 foot per week. Although cause any tree island damage (Wu and Sklar, 2002). The few these labels are not indicative of an appropriate depth for islands that remain in this region are not likely to be impacted foraging, they have been useful during high water conditions to due to their NW location and their relative elevations. However, highlight recession rates that can lead to good foraging depths future efforts to restore WCA-2A islands will require a closer toward the end of the dry season (i.e., April and May). examination (i.e., frequency analysis) of these kinds of exceedences. In WCA-2A, the WY06 and WY07 dry seasons WCA-1 were very similar. Both dry seasons had very good recession The 2008 Water-Year for WCA-1 started at very low water rates, and both times the region completely dried out. However, conditions, after a nine-month period of below average water in WY06, WCA-2A exhibited excellent foraging conditions and levels. Water depths rose from a low in June of only a few inches many flocks of wading birds were observed. In WY07, to depths of 2.5 ft in a matter of only three months and hydroperiod was very short and stage was below average for remained above average throughout the rest of the water year most of the year and as a result, reports of large or many flocks (Figure 1A). The upper flooding tolerances for tree islands were were greatly reduced. This year (WY08) there was some evidence reached very briefly in October 2007. Recession rates were poor of a large return of the WCA-2A prey-base for wading birds for most of the 2008 dry season and stage trends were opposite because the hydroperiod was lengthened and because foraging from the steady declines observed during the previous dry was limited to the month of May due to poor recession rates for season. Last year, water depths became optimum for foraging in most of the dry season (Figure 1B). central and southern WCA-1 during April and May. This year, optimum depths were not reached until June. However, June WCA-2B has always been utilized by wading birds during was probably an excellent foraging month because April and droughts because it tends to stay deeper for longer periods than May of this year had good recession rates creating the perfect the rest of the EPA. This was particularly true in WY06 when “set-up” for foraging when the right depths are reached. dry season water levels went below ground in WCA-2A and the Unfortunately, by July the optimum depths were starting to be wading birds moved to WCA-2B. Last year, the drought was so exceeded. Dry season foraging by wading birds in WCA-1 severe that even 2B became too dry to support any foraging probably slowed significantly in mid-July. For the third year in a from May to July. It was unique to see depths drop some two row, WCA-1 had the longest duration of good nesting and feet below ground in this region last year. This year was a foraging periods of any region in the EPA. completely different story. July rainfall caused water depths to increase rapidly in 2B and a maximum depth of 4 ft was reached WCA-2A and 2B in November. Just when wading birds needed good recession For the last three years in WCA-2A, the stage levels during the rates (March, April and May), water levels increased and never wet season have exceeded the upper flood tolerance for tree dropped low enough to support foraging (Figure 1C). Relief from foraging this year is expected to increase the prey-base in this region and possibly support large nesting flocks next year. Table 1. Average, minimum, and maximum stage (ft NGVD) and total annual rainfall (inches) for Water Year 2008 in comparison to historic stage and rainfall.1 Subtract elevation from stage to calculate average depths. WY2008 Stage Historic Stage WY2008 Historic Area Mean Mean Elevation Rainfall Rainfall (min; max) (min; max) WCA-1 55.54 51.96 16.20 (13.57; 17.54) 15.60 (10.0; 18.16) 15.1 WCA-2 55.54 51.96 12.26 (10.29; 13.98) 12.55 (9.33; 15.64) 11.2 WCA-3 48.89 51.37 9.3 (5.89; 10.16) 9.53 (4.78; 12.79) 8.2 ENP 60.92 55.22 5.94 (5.39; 6.33) 5.98 (2.01; 8.08) 5.1 1 See Chapter 2 of the 2009 South Florida Environmental Report for a more detailed description of rain, stage, inflows, outflows, and historic databases. Wading Bird Report 4
  • 5. Figure 1. Hydrology in the WCAs and ENP in relation to recent average water depths (A: 10 yr ave, B: 13 yr ave, C: 13 yr ave, D: 14 yr ave, E: 14 yr ave, F: 13 yr ave, G: 25 yr ave) and indices for tree islands, peat conservation, and wading bird foraging depths. A. WCA 1 – Site 9 B. WCA 2A – Site 17 C. WCA 2B – Site 99 D. WCA 3A – Site 63 E. WCA 3A – Site 64 F. WCA 3B – Site 71 G. NE Shark River Slough Wading Bird Report 5
  • 6. WCA-3A year. It is unlikely that the prey-base is large enough for The hydrology in the northeastern region of WCA-3A (Gage-63) sufficient recruitment next year and foraging is not expected to in WY07 was very different from that in WCA-1 and WCA-2A be good again in this region until appropriate hydrologic (Figure 1D). In this part of the Everglades, the WY07 drought conditions return. extended well into WY08. (Note: More than one foot below ground violates the guidance for Minimum Flows and Levels.) It Fred Sklar is very unlikely that such a reduced hydroperiod could be capable Everglades Division of rejuvenating the prey-base for the large wading bird rookery South Florida Water Management District (Alley North) where annual nesting during the past decade has 3301 Gun Club Road frequently exceeded 20,000 nests. Water depths barely went over West Palm Beach, Fl 33406 1 ft for a few weeks. When nesting was expected to begin in 561-682-6504 March, water levels increased rather than decreased as would be fsklar@sfwmd.gov needed to concentrate the prey-base into sloughs and pools. This region dried out to a much greater degree than it did last year, Literature Cited which dried out to a much greater degree than the year before, Gawlik, D. E., G. Crozier, K. H. Tarboton. 2004. Wading bird habitat and the combination of a late wet season and extended dry suitability index. Pages 111-127 in K. C. Tarboton, M. M. Irizarry-Ortiz, season created an inhospitable environment for wading birds, D. P. Loucks, S. M. Davis, and J. T. Obeysekera. Habitat suitability especially those that frequent the popular Alley North Rookery. indices for evaluation water management alternatives. Technical Report, South Florida Water Management District, West Palm Beach, FL. During the dry seasons of WY06 and WY07, the birds were lucky that their rookery did not burn. This was the second year in SFWMD. 2003. Minimum Flows and Levels for Lake Okeechobee, the a row the birds were smart enough not to use Alley North as a Everglades, and the Biscayne Aquifer. Draft Report, February 2000. nesting location. South Florida Water Management District, West Palm Beach, Fl. The hydrologic pattern in central WCA-3A (Gage-64) in WY08 Wu, Y., K. Rutchey, W. Guan, L. Vilchek and F.H. Sklar. 2002. Chapter did not suffer the drought as much as the northeast WCA-3A 16: Spatial Simulations of Tree Islands for Everglades Restoration. F.H. (Figure 1E). Although there was no MFL violation to speak of, Sklar and A. van der Valk, eds. In: Tree Isalnds of the Everglades, Kluwer there was instead a greatly reduced wet-season stage. Water Academic Publishers, MA. depths did not go above 1 ft until October and never went over 2 ft the entire water year. What should have been a great wading bird foraging environment starting in March was instead disrupted by increasing water levels rather than decreasing water levels for almost the entire nesting (dry) season. Last year the shallow depths and short duration of the wet season was probably sufficient to cause widespread depletion of wading bird prey species. This year, the lack of foraging and the longer hydroperiod may well translate into a banner prey-base for next year (WY09). WCA-3B In WY06, the water depths in WCA-3B did not go below 0.5 foot (optimum foraging depth) until May 2006, after most nesting behaviors had ceased. In WY07, short but numerous reversals made this region marginal for foraging. This year water depths remained almost constant all year round, and recession rates were not long-lived enough (Figure 1F) to function as a prey-concentrating mechanism (assuming that depths were adequate for prey recruitment). So, for three years in a row, this region’s hydrology has not supported wading bird nesting or foraging. Northeast Shark River Slough The uniqueness of the hydrology and drought in the Everglades during WY07 and WY08 is captured by the Northeast Shark River Slough (NESRS) hydrograph (Figure 1G). For three years in a row this region of Everglades National Park experienced significant violations of the MFL standard, and most of those violations occurred this year. Water levels in this part of the system began dropping in December, and never had any water to support wading birds during the nesting season. It is no surprise, looking at this hydrograph, that large areas of this region (i.e., the Mustang Corner) experienced vegetation and peat fires this past Wading Bird Report 6
  • 7. with information from ground checks. In addition, we used REGIONAL NESTING REPORTS some estimates from the South Florida Water Management District, which performs surveys of the larger colonies via WATER CONSERVATION AREAS 2 helicopter in the first week of every month. These were particularly valuable for times when the colonies were changing AND 3, AND A.R.M. LOXAHATCHEE quickly (new startups and abandonments) that might have been NATIONAL WILDLIFE REFUGE otherwise missed by our mid-month systematic surveys. In 2008, the University of Florida team monitored nesting in WCAs 2 and 3 and Loxahatchee for nesting by long-legged wading birds. We concentrated effort on documenting numbers of Great Egrets, White Ibises, Snowy Egrets and Wood Storks, and continued to refine our methods for estimating numbers of birds in very large colonies. We also made a partial assessment of the use of unmanned aerial systems (small unmanned aircraft) specifically for use in wading bird surveys of various kinds. Methods We performed two types of systematic surveys in 2008: aerial and ground surveys. The primary objective of both kinds of surveys is to systematically encounter and document nesting colonies. On or about the 15th of each month between February and June we performed systematic aerial surveys for colonies, with observers on both sides of a Cessna 172, flight altitude at 800 feet AGL, and east-west oriented flight transects spaced 1.6 nautical miles apart. These conditions have been demonstrated to result in overlapping coverage on successive transects under a variety of weather and visibility conditions, and have been used continuously since 1986. We took aerial photos of larger colonies from directly overhead and from multiple angles, and made detailed counts of the apparently nesting birds showing in these slides via projection. The reported numbers of nest starts are Joel Curzon Photography © 2008 usually “peak” counts, in which the highest count for the season is used as the estimate of nests. The only exceptions to this rule In the past, we have performed systematic, 100% coverage were colonies in which clearly different cohorts were noted in ground surveys of colonies by airboat in WCAs 1, 2 and 3 once the same colony, in which case the peak counts of the cohorts between early April and late May. These were designed to was summed. In some cases we also modified total aerial counts document small colonies or those of dark-colored species that are difficult to detect from aerial surveys. Since 2004, 100% ABBREVIATIONS coverage ground surveys were discontinued due to a change in Species: Great Egret (GREG), Snowy Egret (SNEG), MAP guidelines for monitoring. However, we did perform some Reddish Egret (REEG), Cattle Egret (CAEG), Great Blue systematic ground surveys in WCA 3 that allowed for a direct Heron (GBHE), Great White Heron (GWHE), Little Blue comparison of densities of colonies in certain areas. This was Heron (LBHE), Tricolored Heron (TRHE), Green Heron designed to give an index of abundance for small colonies and (GRHE), Black-crowned Night-Heron (BCNH), Yellow- dark-colored species that might be sustainable. In the case of all crowned Night-Heron (YCNH), Roseate Spoonbill (ROSP), ground surveys, all tree islands were approached closely enough Wood Stork (WOST), White Ibis (WHIB), Glossy Ibis to flush nesting birds, and nests were either counted directly, or (GLIB), Anhinga (ANHI), Double-crested Cormorant estimated from flushed birds. (DCCO), Brown Pelican (BRPE), Osprey (OSPR), Bald Eagle (BAEA), small dark herons (SML DRK), and small As part of an effort to measure nest turnover in colonies, we white herons (SML WHT). also estimated nest success in several colonies, by repeatedly recording the contents and fates of marked nests. Regions, Agencies, and Miscellaneous: Water Conservation Area (WCA), Everglades National Park (ENP), Results Wildlife Management Area (WMA), A.R.M. Loxahatchee Total counts in the WCAs and Loxahatchee NWR National Wildlife Refuge (LNWR), Lake Worth Drainage Combining all species at all colonies in LNWR, WCA 2, and District (LWDD), Solid Waste Authority (SWA), South WCA 3, we estimated a grand total of 15,204 nests of wading Florida Water Management District (SFWMD), U.S. Army birds (Cattle Egrets, Anhingas and cormorants excluded) were Corp of Engineers (USACOE), Systematic Reconnaissance initiated between February and July of 2008 (Tables 1 & 2). Note Flights (SRF), Comprehensive Everglades Restoration Plan that this figure does not include birds nesting at the Tamiami (CERP), and Natural Systems Model (NSM). West colony, which we also monitored intensively in ENP. Wading Bird Report 7
  • 8. Table 1. Numbers of nests of wading birds found in A.R.M. Loxahatchee National Wildlife Refuge during systematic surveys, Jan - June 2008 Latitude Longitude WCA Colony GREG WHIB WOST ROSP SNEG GBHE LBHE SmWt LgDk SmDk TRHE GLIB BCNH Total 26.55010 -80.44270 1 LOXW 233 3561 16 567 4377 26.53280 -80.27620 1 NEWCOL4 229 2 1 2553 2785 26.43822 -80.39053 1 LOX99 221 892 140 3 1256 26.49650 -80.22288 1 LOXRAMP 180 680 860 26.43510 -80.23720 1 LOX70 800 800 26.37217 -80.26020 1 LOX73 30 513 1 6 550 26.45857 -80.24032 1 NEWCOL2 294 32 326 26.39895 -80.24992 1 VENUS 114 36 27 2 179 26.45913 -80.42335 1 VULCAN 156 156 26.59810 -80.28547 1 ZULU 23 23 26.50985 -80.32375 1 WATS 17 17 26.55353 -80.26452 1 YAM 8 9 17 26.57228 -80.27217 1 YMIR 10 5 2 17 26.52470 -80.43570 1 WAFFLE 16 16 26.45010 -80.26287 1 VOLTA 12 12 26.46838 -80.37228 1 WELT 11 11 26.37197 -80.31035 1 UTU 8 8 26.37210 -80.29265 1 UZANA 8 8 26.39393 -80.33868 1 UZUME 8 8 26.55737 -80.25987 1 YEW 6 6 26.39220 -80.31227 1 UZED 4 4 Total nests for Colonies > 50 1121 5982 18 567 2 836 2758 3 2 11289 Total nests for Colonies < 50 64 9 5 28 39 2 147 Grand total 1185 5982 18 576 7 864 2797 3 4 11436 Table 2. Numbers of nests of wading birds found in WCAs 2 and 3 during systematic surveys, Jan - June 2008 Latitude Longitude WCA Colony GREG WHIB WOST ROSP SNEG GBHE LBHE Sml. Lrg Sml. TRHE GLIB BCNH Total 26.12428 -80.54148 3 6THBRDG 76 1000 1 250 3 250 1580 26.21360 -80.81470 3 ROTOR 108 3 2 297 37 447 25.86842 -80.80663 3 ENKI 172 8 102 282 26.12408 -80.50438 3 CYPRESS CITY 245 9 15 269 26.38775 -80.23857 3 UNTEW 243 243 26.09846 -80.76870 3 MELBA 3 47 58 108 26.24600 -80.49300 3 SPOONIE 40 11 51 26.20132 -80.52873 3 ALLEY NORTH 43 1 44 25.86541 -80.80342 3 ECHO 37 4 41 25.82065 -80.67693 3 YONTEAU 27 7 34 25.77353 -80.83722 3 HIDDEN 30 30 25.93890 -80.53030 3 HERBIE 28 28 26.20979 -80.66408 3 RAMA 1 25 26 25.83184 -80.53257 3 DANA 22 22 26.10715 -80.49802 3 NANSE 20 20 26.04602 -80.62586 3 BIG MEL 14 1 1 16 26.03640 -80.78980 3 HILBRA 13 1 14 25.82025 -80.50132 3 CYDER 12 12 26.01230 -80.63233 3 JOULE 10 2 12 26.00012 -80.59513 3 JANUS 8 3 11 25.76900 -80.67835 3 BRAHMA 10 10 25.81939 -80.61354 3 CINDER 10 10 25.91565 -80.63022 3 VACATION 6 4 10 25.94280 -80.66680 3 HANDEL 9 9 25.96052 -80.57207 3 HORUS 8 8 25.92347 -80.51858 3 GANGA 7 7 25.92390 -80.54260 3 GRANT 7 7 25.84863 -80.51932 3 DIONYSUS 5 5 25.84723 -80.53150 3 DAMKINA 4 4 25.95902 -80.47898 3 HESTIA 3 3 25.83770 -80.81890 3 CANDER 2 2 26.01360 -80.45632 3 JUNO 2 2 25.91450 -80.47640 3 GARGOYLE 1 1 26.01557 -80.56272 3 JUPITER 1 1 26.24335 -80.35072 2 SHIVA 144 7 26 1 12 1 191 26.23782 -80.31280 2 RHEA 19 3 22 Ground surveys 3 29 23 11 4 119 186 Total nests for Colonies > 50 573 1250 50 282 21 528 306 161 3171 Total nests for Colonies < 50 316 1 20 62 7 1 4 411 Grand total 918 1250 0 50 283 64 601 313 0 1 169 0 119 3768 Wading Bird Report 8
  • 9. Table 3. Annual numbers of nests of aquatic birds found in A.R.M. Loxahatchee National Wildlife Refuge and WCAs 2 and 3 from 2005 through 2008 WCA Year GREG WHIB WOST ROSP SNEG GBHE LBHE Unkwn SmDk TRHE GLIB BCNH CAEG Total LNWR 2005 1361 2994 238 599 5192 2006 1800 5194 3745 3 50 50 30 10872 2007 1792 8271 13 730 66 1 4797 15670 2008 1185 2421 18 9 10 864 6925 4 11436 WCAs 2&3 2005 2209 13004 20 11 2253 201 634 1 388 75 220 19016 2006 5697 15698 190 40 4540 328 1212 28 561 192 289 28775 2007 2141 10932 39 247 467 284 1700 142 409 16361 2008 918 760 50 36 64 601 516 1 169 119 3768 Total for all WCAs 2005 3570 15998 20 11 2491 201 1233 1 388 75 220 24208 2006 7497 20892 190 40 8285 331 1212 28 611 242 319 39647 2007 3933 19203 39 247 480 1014 1766 143 409 4797 32031 2008 2103 3181 68 45 74 1465 7441 5 169 119 15204 The size of the nesting aggregation in 2008 in the WCAs and some important way to the attractiveness of nesting. This result LNWR combined was approximately 44% of the average of certainly suggests more detailed analysis. similar counts during the past five years, 47% of the average of In recent reports we did not differentiate total nest counts the past ten years, and 25% of the banner year of 2002. Numbers according to conservation area. Segregated totals for LNWR of Great Egret nests were only 33% the average of the last five and WCA’s 2 & 3 from 2005 – 2008 can be found in Table 3. years, and 34% of the average of the last ten. In 2008, Wood Stork nests were very much reduced, with no pairs attempting to Peter Frederick nest in the WCAs. White Ibis nests were 37% of the average of John Simon the last five and 40% the average of the last ten years. Compared Department of Wildlife Ecology and Conservation with the banner year of 2002, only 23% of the ibis pairs nested in P.O. Box 110430 2007. Approximately 860 Snowy Egrets attempted nesting, University of Florida, Gainesville, Florida 32611-0430 which was only 27% of the previous five years average and 24% 352-846-0565 of the last ten. Our estimates of ANHI numbers were poor this pcf@mail.ifas.ufl.edu season. The delayed wading bird nesting meant that virtually no jcsimon@ufl.edu internal colony visits were conducted until well after peak ANHI activity. Generally, nesting was not successful for any species, with the possible exception of ibises in Loxahatchee. Large abandonment events were seen throughout the system with the water level reversals that began in March and continued through April. We followed the fates of marked nests in three colonies in WCA 3: Vacation (N25 54.939 W80 37.813), Cypress City, and 6th Bridge. For all three islands, the nests initiated in March (mostly GREG) showed extremely high failure rates—90% for both Vacation (N = 10) and Cypress City (N = 21) based on marked nests and similar levels for 6th Bridge based on aerial photos. A subsequent nesting effort beginning mid-May/early-June on 6th Bridge revealed slightly better results (~50-75% failure), although the field season ended before the fates of many nests could be confirmed. In the places that Wood Storks did show evidence of nest attempts (Tamiami West, Paurotis Pond), all nests failed. The difference in numbers of nests and nest success between Loxahatchee and WCA 3 this year was dramatic. Generally the largest colony in the system is at Alley North in WCA 3. This colony did not really form this year and contained no ibis nests. Loxahatchee contributed 76% of the total birds nesting in the WCAs, 82% of the ibises, and 57% of Great Egrets. This is highly disproportionate to its area and represents a departure with the past pattern. It seems likely that the more stable water conditions in Loxahatchee both over the last couple of years and over the course of the 2008 nesting season have contributed in Wading Bird Report 9
  • 10. EVERGLADES NATIONAL PARK Great Egrets nested at both Rookery Branch and East River colonies but abandoned in April. A few Roseate Spoonbills Mainland Areas February – August 2008 were seen at the Broad River colony site but we are not sure if they nested. Methods Aerial colony surveys of ENP were conducted monthly The drastically reduced nesting activity observed this year was (February through August) by one observer from a Cessna 182 most likely a result of the severe drought conditions that fixed-wing aircraft (~15 hours). Known colony sites were prevailed throughout the area. Foraging areas around most checked during each survey on 8 and 20 February, 3 and 17 colony sites were dry until April. After several significant rain March, 14 April, 20 May, 4 June, 1 and 16 July, and 1 August. events in April, the conditions went from nearly completely dry (Note: not all colonies were surveyed on each date and some to mostly flooded. were checked while flying other wildlife project flights.) We also Beginning 1 July, the Rodgers River Island colony site was active conducted two systematic colony surveys of the grassland with approximately 30 nesting Great Egrets. Fewer birds were regions within Shark and Taylor Sloughs where transient colonies seen nesting on the island when checked on 1 August. All other often form (usually Great Egrets) on 23 and 25 April. Systematic colony sites were empty. surveys comprised 20 east-west oriented transects spaced 1.6 nautical miles apart (see Figure 1) using two observers from each Frank Key (Florida Bay) January - May 2008 side of a Cessna 182 (~12 hours). Flight altitude was 800 feet AGL. Aerial surveys of Frank Key in Florida Bay were conducted on 8 February, 19 March, 18 April, 20 May and 4 June by one Results observer when conducting other ENP wildlife survey flights. We observed comparatively little nesting activity within the Birds initiated nesting within the main egret and pelican colony mainland colonies of ENP this season (950 nests, Table 1). sometime after 8 February. On 19 March, 75 Great Egrets and Compared to 2007, nest number estimates for all species 25 Brown Pelicans were observed incubating on nests. On 18 combined were down by 71%. Breaking this down by species, April, the number of active Great Egret nests had declined to 40, Wood Stork nest numbers were down by 57%, Great Egret by however small young were seen on remaining nests. Pelican 84%, White Ibis by 62% and Snowy Egret by 32%. nests had increased to 60 and Double-crested Cormorants were Only seven colonies were active and only two - Paurotis Pond also observed nesting among the egrets and pelicans. By May all and Alligator Bay - appeared to successfully fledge young. White egrets had abandoned their nests, however approximately 30 Ibis were the most numerous of species nesting at both colonies. pelican nests were still active with half-grown young in the nests. Great Egrets, Tricolored Herons and Little Blue Herons fledged White Ibis and Snowy Egrets were not seen in the colony this young quite late in the nesting season at both colonies. Young year. egret and ibis branchlings could be seen from the airplane Several pairs of Great White Herons (n = 4) nested successfully begging for food and later flying around the colonies. From on Frank Key but were not located within the main egret and photos taken during flights, young Tricolored Herons (both pelican nesting colony. colonies) and Little Blue Herons (Paurotis Pond) were seen standing in trees. Roseate Spoonbill fledglings were seen at Lori Oberhofer Paurotis Pond in February (see Lorenz et al. this issue for Sonny Bass details). Everglades National Park South Florida Natural Resources Center We did not find any new colonies while flying systematic surveys 40001 State Road 9336 over Shark and Taylor Sloughs. However we plan to continue Homestead, FL 33034 these flights next season and anticipate that new colonies will be (305) 242-7889 found when conditions are more favorable for nesting. In (305) 242-7833 addition to systematic surveys, we also plan to conduct earlier lori_oberhofer@nps.gov checks for Roseate Spoonbill nesting activity (starting in sonny_bass@nps.gov October) at colonies where spoonbills have nested in recent years (i.e., Paurotis Pond and headwaters colonies.) Wood stork nesting was unsuccessful this year in ENP. They attempted to nest only at Paurotis Pond and Cuthbert Lake, while the traditional nesting colonies of Tamiami West and Rodgers River had no stork activity. At Paurotis Pond, Wood Storks had a few nest starts when checked on 20 February. On 3 March there were 70 nests. On 17 March 40-50 of 125 visible nests had incubating adults and most of the remainder had adults standing at nests. Cuthbert Lake had very little Wood Stork activity. The few storks that gathered were not observed until 17 March. On that date approximately 20 pairs had visible nest starts. Unfortunately, Wood Storks at both Paurotis and Cuthbert abandoned all nests after several significant rain events in April. Wading Bird Report 10
  • 11. Table 1. Peak numbers of wading bird nests found in Everglades National Park colonies from 8 February through 1 August, 2008. Mainland colonies only Latitude Longitude Colony name WGS84 WGS84 GREG WOST WHIB SNEG CAEG ROSP TRHE LBHE BCNH TOTAL Alligator Bay 25 40.259 -81 08.828 50 300 50 + + 400 Broad River 25 30.176 -80 58.464 + + Cuthbert Lake 25 12.560 -80 46.500 30 20* 30 East River Rookery 25 16.116 -80 52.071 5* 0 Paurotis Pond 25 16.890 -80 48.180 50 125* 250 + + + + 300 Rodgers River Bay 25 33.400 -81 04.190 30 30 Island Rookery Branch 25 27.814 -80 51.153 40* 0 Total 205 145 550 50 + + + 950 + Indicates species present and nesting, but unable to determine numbers * Indicates nesting activity but abandoned nests Figure 1. Systematic survey transects and known colony sites within Everglades National Park. Wading Bird Report 11
  • 12. WOOD STORK NESTING AT CORKSCREW Other wood stork colonies in SW Florida SWAMP SANCTUARY Numerous aerial surveys of other known wood stork colony locations in Collier, Lee and Hendry Counties were conducted Location: N26° 22.5024 W081° 36.9859 from November 2007 through May 2008. The Lenore Island colony on the Caloosahatchee River was the only active nesting Methods location found this season. Lenore Island is a mangrove island 2 Corkscrew Sanctuary Staff conducted aerial surveys to known miles down stream of the I-75 bridge on the Caloosahatchee colony sites in Collier, Hendry and Lee County periodically from river. early November through May to monitor the Wood Stork Methods nesting effort. No nesting effort was observed at Corkscrew A fixed wing aircraft was flown at 1000’ over nesting sites. Swamp Sanctuary at anytime throughout the nesting season. When nesting efforts were identified; digital photographs were taken from 1000’ and 500’. An 8.2 megapixel Canon EOS 30D Results body was used in combination with a 70-300mm lens for close- Wood storks arrived in Collier County in early October, ups and an 18-55mm wide angle lens for landscape images. The occasionally visible foraging in roadside ditches. No nesting was close-up lens was equipped with an image stabilizer. Digital initiated at the sanctuary for the second year in a row. Wood photos of the aerial survey for colony were examined and storks were observed at the Sanctuary foraging at the lettuce identifiable nested were digitally marked and recorded. lakes in early March which were dry by the first of April. No other wading birds were observed nesting at Corkscrew Results throughout the survey period. Wood Storks: Lenore Island was the only productive wood stork nesting site this season. It was surveyed 9 times and Hydrology photographed on 5 occasions from January through May of Water levels at the Corkscrew staff gage peaked just under 27” in 2008. The peak wood stork nesting effort was recorded on late-September. This is more than 10” below the average wet- March 28th, where 45 nests were positively identified, another six season high. Rainfall totals recorded at the Corkscrew visitor points on the island could have been wood stork nests, but the center were 27.75” from June 1st through September 30th, which images were inconclusive. All of these nests are believed to have is nearly 10” below the rainy season average for that period. This been in the early stages of incubation. The pronounced drought drought continued through the traditional nesting season in is believed to be the catalyst behind the depressed nesting Southwest Florida. By March 15th water levels at the Lettuce numbers. Considerable nest abandonment occurred in April and Lake Steven’s gage were at 5.04” which is more than 20” below May and the total nesting effort at Lenore Island produced an average. estimated 10 successful nests with a total of 12 wood stork fledglings. The productivity for this colony comes to 0.27 chicks per nest attempt. Other waders: Forty great egrets were documented nesting from images captured on March 28th. Many of these appeared to be incubating. The May 29th survey revealed 37 great egret nests, many of which were new initiations as eggs were visible. The fate of these nests is unclear. At least 13 great blue herons nested on Lenore Island, along with two snowy egrets, one black-crowned night heron and one yellow-crowned night heron. Anhingas, double-crested cormorants, and brown pelicans were also nesting on the island. Estimates of colony nesting effort and productivity can be found below in Table 1. Jason Lauritsen Corkscrew Swamp Sanctuary 375 Sanctuary Road West Naples, FL 34120 jlauritsen@audubon.org Table 1. Wading bird nesting effort recorded in Southwest Florida. SML SML Latitude Longitude Colony WOST GBHE GREG WT DRK Total nests successful fledged 26 22.502 -81 36.985 Corkscrew 0 na na na na 0 26 41.332 -81 49.809 Lenore Island 45 10 12 13 40 2 5 105 (Caloosahatchee West) 26 41.795 -81 47.697 Caloosahatchee East 0 0 0 0 0 26 22.223 -81 16.363 Collier/Hendry Line 0 0 0 0 0 0 Wading Bird Report 12
  • 13. SOLID WASTE AUTHORITY OF PALM BEACH COUNTY ROOKERY Methods Typically, Breeding Bird Censuses (BBCs) are conducted from February – July in the SWA Roost by two observers every 8-10 weeks, representing approximately 12 man-hours. During the BBC, all islands from three abandoned shell pits are systematically surveyed from a small boat, and the identified bird species and nest numbers are recorded. Surveys are conducted during the morning hours so as to minimize any burden caused by the presence of observers. However, this year’s severe drought restricted boat access into the colony. The peak nest numbers are a compilation of early season boat counts and visual counts from the observation towers. Location & Study Area The SWA roost is located on spoil islands in abandoned shell pits that were mined in the early 1960’s in Palm Beach County, Florida (Lat. 26o46’41”N: Long. 80o08’32”W NAD27). The spoil islands consist of overburden material and range from 5 to 367 m in length, with an average width of 5 m. Islands are separated by 5-6.5 m with vegetation touching among close islands. The borrow pits are flooded with fresh water to a depth of 3 m. Dominant vegetation is Brazilian pepper (Schinus terebinthifolius), Australian pine (Casurina spp.), and Melaleuca (Melaleuca quinquenervia), all non-native species. Local features influencing the roost include: 1) the North County Resource Recovery Facility and landfill and 2) the City of West Palm Beach’s Grassy Waters (=Water Catchment Area), a 44 km2 remnant of the Loxahatchee Slough. Results This report presents preliminary data for the 2008 breeding season. Typically, nesting activities have been observed at this colony through September, and these surveys being reported are only through the end of July. Only the peak nest numbers are being reported for each of the bird species (Table 1). The estimated peak number of wading bird nests for the SWA Mary Beth (Mihalik) Morrison, Todd Sandt & Colony is 2042 which represents about a 74.9 % increase from David Broten the previous 2007 season. Despite the drought, there were nests Solid Waste Authority of Palm Beach County of the following bird species: Great Egrets, Snowy Egrets, Cattle 7501 North Jog Road Egrets, Wood Storks, White Ibis, Little Blue Herons, Tricolor West Palm Beach, FL 33412 Herons, and Anhinga. The Wood Stork nest numbers were (561) 640-4000 ext. 4613 slightly higher than last year. It should also be mentioned that mmorrison@swa.org there was at least 5-7 Roseate Spoonbill nests with a few fledglings observed from the boat. Table 1. Peak number of wading bird nests in SWA Rookery from February to July 2008 GREG SNEG CAEG GBHE LBHE WOST WHIB ANHI TRHE Total Nests 122 34 451 0 15 154 706 419 66 2042 Wading Bird Report 13
  • 14. ROSEATE SPOONBILL NESTING IN FLORIDA BAY ANNUAL REPORT Table 1. Number of ROSP nests in Florida Bay Nov 2007-March 2007-2008 2008. An asterisk (*) indicates colony with nesting success surveys (see Table 2). Methods 2007 Summary since Spoonbill Colony Surveys. Sub-region Colony -08 1984 Thirty-nine of Florida Bay’s keys have been used by Roseate Min Mean Max Spoonbills as nesting colonies (Figure 1, Table 1). These Northwest Sandy* 80 62 154.09 250 colonies have been divided into five distinct nesting regions Frank 42 0 53.06 125 (Table 1) based on each colony’s primary foraging location Clive 27 11 27.00 52 Palm 55 9 24.00 55 (Figure 1, Lorenz et al. 2001). During the 2007-2008 nesting Oyster 0 0 6.06 45 cycle (Nov-May), complete nest counts were performed in all Subtotal 204 65 211.22 325 five regions by entering the active colony and thoroughly searching for nests. Nesting success was estimated for the four Northeast Deer* 15 2 6.67 15 Tern 0 0 104.57 184 active regions through mark and re-visit surveys of the most N. Nest 2 0 0.25 2 active colony within the region. These surveys entailed marking S. Nest 13 0 18.28 59 up to 50 nests shortly after full clutches had been laid and re- Porjoe 10 0 28.55 118 visiting the nests on a 7-10d cycle to monitor chick development. N Park 0 0 18.00 50 Duck 1 0 1.94 13 Pass 0 0 0.50 4 Banding Program. Subtotal 41 41 177.83 333 The purpose of this banding program is to understand the movements and population dynamics of the state’s spoonbill Central Calusa* 13 0 12.50 21 E. Bob population. We are interested in the location of post breeding Allen 0 0 13.89 35 dispersers, the possibility of breeder exchanges between Florida Manatee 3 0 0.19 3 Bay and Tampa Bay, and state-wide regional movements of the Jimmie general population. We are hoping to see trends in spoonbills’ Channel 14 6 19.83 47 Little movements with future banding and resighting efforts. Please Pollock 0 0 2.44 13 refer anyone with information on resighting banded spoonbills S. Park 0 0 10.61 39 to the senior author or our website Little (http://www.audubonofflorida.org/who_tavernier_reportspoon Jimmie 0 0 6.00 12 First Mate 1 1 1.00 1 bills.html). Captain 1 1 5.00 9 Black Betsy 4 4 4.00 4 Subtotal 36 15 52.94 96 E. Southwest Buchanon 0 0 6.13 27 W. Buchanon 0 0 3.40 9 Barnes 0 0 0.27 3 Twin 1 0 1.67 8 Subtotal 1 0 10.13 35 Southeast Stake* 11 0 5.44 19 M. Butternut 3 1 20.67 66 Bottle 11 0 11.41 40 Cowpens 2 0 5.88 15 Cotton 0 0 0.00 0 West 1 0 2.93 9 Low 0 0 0.00 0 Pigeon 17 0 9.38 56 Crab 0 0 2.13 8 East 0 0 3.35 13 Crane 1 1 12.81 27 E. Butternut 9 0 5.87 27 Subtotal 55 39 79.80 117 Florida Bay Total 341 341 543.94 880 Wading Bird Report 14
  • 15. In Florida Bay, spoonbill nestlings were banded at 10 of the 24 Thirty nestlings from 13 nests were banded at the Sandy Key colonies where spoonbills nested. In Tampa Bay, we banded colony (Table 3) between Dec 21 and Jan 17. Only 20% of the spoonbills at the largest colony in the region, Richard T. Paul banded chicks were observed post-fledging on the fringes of the Alafia Bank Bird Sanctuary (Alafia Bank, Hillsborough Bay), the colony, and 73% of the banded chicks were never observed alive state’s largest mixed colonial waterbird colony. The ten colonies or dead. Based on band resightings, nesting success was in Florida Bay were distributed among four regions: Northwest estimated at only 0.46 c/n, much lower than the 1.76 c/n (n = 1), Northeast (n = 3), Central (n = 2), and Southeast (n = estimate based on nest monitoring. Only one fledgling remained 4). Three colonies in the northwestern region can experience on the island by the Mar 7, 2008 survey. heavy predation by American Crows when disturbed by humans and were omitted from the banding program Northeastern Region: Deer Key All eight spoonbill nesting colonies were surveyed in the Details of the banding procedure are described in Lorenz et al. Northeastern region of Florida Bay. Only 41 nests were found, 2007, with the exception that banding did not occur at the which is well below average, and is the lowest nest count for this Washburn Jr. Sanctuary in 2008. region during the period of continuous monitoring (Table 1). Only five of the eight colonies were active during the 2007-08 Spoonbill Monitoring Results nesting season. Northwestern Region: Sandy Key Spoonbills have nested on Tern Key since monitoring began in All five colonies in the Northwestern region were surveyed in 1983-84, but nesting was absent here during the 2007-08 2007-08 (Table 1). We counted a total of 204 nests, which is breeding season. The lowest previous count was 60 nests in the below the average of the last 23 years. 1998-99 nesting season. We used Deer Key as a surrogate for Tern Key as it was the largest nesting colony in the Northeastern Nest success surveys were conducted at Sandy Key on Oct 16, region this nesting season. Note that Mean values for Tables 1 24, Nov 6, 20, 27, Dec 6, 11, 21, Jan 1, 9, 17, 23, Feb 9, and Mar and 2 represent the historical focal colony for the sub-region, 7. All nests were initiated within 17 days of one another, which not for the individual colony, as Deer Key has not traditionally is somewhat synchronous compared to recent years. We been the focal colony for Northeastern Florida Bay. estimate that the first eggs were laid on Nov 18 and the last on Dec 5. The mean laying date was Nov 25, and the mean hatch Spoonbill nest success surveys were conducted at Deer Key on date was Dec 15. The number of nests found on Sandy Key (n Oct 18, Nov 3, 19, Dec 5, 19, Jan 4, 10, 18, 25, and Feb 21. As = 80) was well below that normally counted since 1984 (mean = in recent years, the nesting effort for the main focal colony was 154). We marked 53 nests for revisitation but were able to alarmingly small: only 15 nests in 2007-08 compared to almost follow the outcome of only 21 nests due to the composition of 200 nests ten years ago and over 500 nests twenty-five years ago the colony. Of these 21 nests, 90% were successful at raising (for the previous main focal colony, Tern Key). At Deer Key, chicks to at least 21d old (the age when they first leave the nest) the first egg was laid on Dec 1 and the last on Dec 17; the mean and they produced an average of 1.76 chicks per nesting attempt laying date was Dec 10, and mean hatching date Dec 30. Again, (c/n) which is above average of the past 23 years (1.30 c/n; nesting was somewhat synchronous and occurred within a 16- Table 2). day period. We believe this decline in northeastern Florida Bay is due to water management on the foraging grounds. Although this effort is small for the sub-region, this is the largest nesting effort for Deer Key since nests were discovered there in 2005- 06. Deer Key birds were also relatively successful producing an averaging of 1.77 c/n compared to the average of 0.84 c/n since 1984 (Table 2). All 15 of the nests initiated on the island were marked for revisitation. Of these, 87% were successful at raising chicks to 21d old. Total production for the colony was estimated at 23 chicks. In the northeastern region, 36 nestlings were banded from 18 The threshold fledging rate for a successful nesting is at least one nests within 3 colonies (Deer, South Nest, and North Nest Keys; c/n on average. Total production for Sandy Key was estimated Table 3). Chicks were banded between Jan 4 and Jan 18. Sixty- at 140 chicks fledged. This figure may be an over-estimation, as seven percent of the banded chicks were observed post-fledging no more than 40 fledglings were observed outside the colony, but before they abandoned their natal colony for an estimated and was probably a result of only calculating productivity based production of 1.33 c/n, an average slightly below that estimated on the outcomes of 21 of 53 nests. We have seen in the past that by the Deer Key colony surveys. This high productivity and although chicks reach the 21-day benchmark, the colony can success rate along with Deer Key’s much better than average subsequently experience a catastrophic collapse, which may also nest success is a hopeful sign that those birds that nest in the account for the low fledgling count. Sandy Key nesting was Northeastern region, albeit in small numbers, are able to successful in 2007-08 (as defined by the number of chicks successfully produce young. reaching 21 days) but care should be taken when interpreting this result given the limitations of the data. Wading Bird Report 15
  • 16. A very small second nesting event (three nests) did occur at Deer chicks were found dead before leaving their nests, and 51% were Key in mid-February. This number provides some support for observed alive post-fledging before they abandoned their natal the hypothesis that second nesting is populated by birds that colony. Based on the banding effort, the success rate in the failed to produce or fledge young in the primary nesting. The Southeastern region was 0.95 c/n, only slightly less than the second nesting yielded two successful nests with an average of Stake Key survey estimate. one chick reaching 21d post-hatching per nest attempt. We The success rate observed through nest surveys is greater than observed 3 fledglings at the colony post-nesting. last year’s 0.92 c/n attempt at Stake Key, and is also above the average 0.98 c/n since 1984. Historically, birds at the Southeastern Region: Stake Key southeastern colonies foraged primarily in the mangrove All of the twelve Southeastern colonies were surveyed for nesting wetlands on the mainline Florida Keys. Although most of these activity in 2007-08 (Table 1). wetlands were filled by 1972 as part of Keys development boom, Nest success surveys were conducted at Stake Key on Oct 17, we presume (based on anecdotal evidence) that the few 30, Nov 13, 27, Dec 12, 19, 31, Jan 8, 15, 21, 28, and Feb 29. remaining Keys wetlands still serve as important foraging The first egg was laid on approximately Nov 28, with a mean lay grounds for these birds. Since 1972 (when large scale filling of date of Dec 9. The mean hatch date was Dec 29. Eleven nests wetlands ended), nesting attempts in the Southeastern region were initiated on the island. On average, each nest attempt generally fared poorly: 8 of 12 years surveyed were failures produced a successful 1.2 c/n. (Table 2). The success of Stake Key birds is an exception to the historical trend. However, based on previous work (Lorenz et We banded 35 nestlings from 19 nests within 4 colonies (E. al. 2001) it appears that the quality of the Southeastern region for Butternut, Stake, Pigeon, and Bottle Keys, Table 3). Chicks were nesting spoonbills is marginal at best, thereby explaining the low banded between Dec 31 and Jan 16. Approximately 9% of these overall effort. Prior to the Keys land boom spoonbills nesting in the Southeastern region successfully produced on average >2.00 c/n (Lorenz et al. 2002). Figure 1. Map of Florida Bay indicating spoonbill colony locations (red circles) and nesting regions (blue circles). Arrows indicate the primary foraging area for each region. The dashed lines from the central region are speculative. Approximate locations of fish sampling sites are represented by green circles. Wading Bird Report 16
  • 17. Table 3. Number of ROSP banded in Florida Bay Dec 2007-Feb 2008, and in Tampa Bay, April 2008-May 2008. "Number of ROSP Resighted Alive" indicates the number of birds resighted after the age of 21+ days. Colonies where Number of Number of Number of Roseate Number of Number of ROSP ROSP ROSP where Spoonbills were Nests Chicks Resighted Resighted Fate is Estuary Sub-region Banded Banded Banded Alive Dead Unknown Florida Bay Northwest Sandy 13 30 6 (20%) 2 (7%) 22 (73%) Northeast Deer 11 20 15 (75%) 0 5 (25%) S. Nest 6 14 8 (57%) 0 6 (43%) N. Nest 1 2 1 (50%) 0 1 (50%) Central Calusa 9 16 7 (44%) 1 (6%) 8 (50%) Jimmie Channel 10 18 3 (17%) 5 (28%) 10 (55%) Southeast Stake 6 11 8 (73%) 2 (18%) 1 (9%) E. Butternut 2 2 1 (50%) 0 1 (50%) Pigeon 6 10 4 (40%) 0 6 (60%) Bottle 5 12 5 (42%) 1 (8%) 6 (50%) Florida Bay Total 69 135 58 (43%) 11 (8%) 66 (49%) Tampa Bay Alafia Bank 34 62 52 (84%) 0 10 (16%) Central Region: Calusa Key Spoonbills nesting in the Central region have reasonable access A new nesting colony was discovered this year in the Central to the entire mosaic of foraging habitats found in the other four region for a total of ten colonies totaling 36 nests (Table 1). This regions (Figure 1). This catholic foraging style may cost a little new colony consists of one red mangrove on a mud bank along more energetically (longer flights to foraging areas), but the Black Betsy Key, and although not technically part of the main increased likelihood of finding suitable foraging locations may island of Black Betsy, it is named as such because of its proximity counterbalance the cost. However, if the specific foraging to the main island. habitats utilized by spoonbills in all of the other four regions become compromised, the spoonbills of the Central region Nesting success surveys at Calusa Key were conducted on Oct would also be affected negatively. If these foraging grounds do 22, Nov 5, 15, 29, Dec 7, 12, 20, 31, Jan 8, 15, 22, 28 and Mar 6. not support abundant and concentrated prey, long flights to Thirteen nests were found on Calusa, which is slightly above more productive areas may be too energetically demanding for a average (12.5 nests since 1984). The first egg was laid on Nov spoonbill to make, resulting in lower nest success. Based on 20, and the last on Dec 7, with a mean laying date of Nov 29 and flight-line counts and fixed-wing aircraft observations, it appears mean hatching date of Dec 19. This year’s nesting was not that the birds from the Central region are flying over the Russell successful, only 50% of the nests successfully raised chicks to and Black Betsy Keys to the Taylor Slough area to forage. 21d and produced on average only 0.92 c/n. This year was slightly more productive than last year (0.76 chicks per nest Southwestern Region: Twin Keys attempt, 52% successful nest attempts). Total production for the All keys in the southwestern region were surveyed multiple times colony was estimated at 12 chicks, and this was confirmed in 2007-08 but only one nest was found on Twin Key (Table 1). through colony surveys. This nest did produce young, and two chicks were observed post 21 days hatching. We banded 34 nestlings from 19 nests within 2 colonies (Jimmie and Calusa Keys, Table 3) in the Central region. Chicks were Bay-wide Synthesis banded between Dec 12 and Jan 15. Approximately 29% of the Bay-wide, Roseate Spoonbills nest numbers in 2007-2008 were banded chicks were observed post-fledging before they the lowest on record (341 nests; Table 1), indicating a continued abandoned the natal colony. The banding effort estimate for downward spiral that began with completion of major water production was 0.52 c/n, much lower than the survey estimate. management structures in the early 1980s. Historically, the Northeastern region was the most productive region of the bay Significant nesting in the Central region is a relatively new (Lorenz et al. 2001). Since 1982, this region has been heavily phenomenon, having started in the mid-1980s. As such, little impacted by major water control structures that lie immediately information has been collected on where these birds feed, but upstream from the foraging grounds (Lorenz 2000). This year, the central location suggests that they may opportunistically the success rate at Deer Key was extraordinary and exceeded the exploit the primary resources used by the other regions. 0.84 c/n average since 1984; however, the overall effort was Wading Bird Report 17
  • 18. astonishingly low for a focal colony, and the total number of through 2005, but have not nested there in normal numbers the nests for the Northeastern sub-region was abysmal. The past two nesting seasons, probably due to a predator we have historical focal colony of the Northeast bay, Tern Key, did not not been able to remove. produce a single nest. Nest efforts and success rates at Tern Key have been decreasing for several years, but not since the early 1960s have birds completely abandoned the colony. In all, 135 chicks were banded from 69 nests across Florida Bay. Of these 8% were observed dead either before leaving the nest or outside the colony and 43% were observed alive post-fledging. No birds have been resighted outside of their natal colonies. Comparison to Tampa Bay Nesting Population We began banding spoonbill nestlings at the Alafia Bank, Tampa Bay, in 2003 as part of a pilot study for the banding program. The goals of this program were two-fold: 1) to determine the movements of spoonbills within the state and the region and 2) to get estimates of nesting success to compare to Florida Bay. Reports of spoonbills producing greater than 2.0 c/n were regularly reported throughout Florida Bay as late as the early 1970s. Following the destruction of wetlands in the Keys and water diversion in the northeastern part of Florida Bay, the average dropped below 1.0 c/n. Tampa Bay colonies provided an opportunity to see how productive spoonbills were in another part of the state to assess if this decline was unique to Florida Bay or a more regional response. Answering this question is critical to demonstrating the causal relationships between Everglades management and the observed decline in Florida Bay. In 2008, spoonbills nested in 10 colonies (Clearwater Harbor I- 25, Belleair Beach, Dogleg Key, Coffeepot Bayou, Alafia Bank, Washburn, Washburn Jr., Dot Dash, Roberts Bay, and Lake Somerset) in the greater Tampa Bay area, although two of the colonies occupied in 2007 (Miguel Bay in Terra Ceia Bay and Little Bird Key National Wildlife Refuge in Boca Ciega Bay) were not occupied in 2008 and nesting occurred at two new colonies: Belleair Beach (1 adult and a fledged brood of 3) and Lake Somerset inland in Polk County (2 nests, with unfledged broods of 2 young and 1 young as of July 5). This is the first nesting report for Lake Somerset (Hodgson and Paul in prep.). The largest colony in the region is the Richard T. Paul Alafia Bank At the Alafia Bank, we banded 62 nestlings from 34 nests during Bird Sanctuary in Hillsborough Bay, with 270 pairs (based on a three banding sessions on May 7, 21 and 23 (Table 3). Of the 62 flightline survey conducted on May 1, adjusted by seasonal nestlings banded, we resighted 52 (84%) of them alive as productivity data) in 2008. A total of 172 fledged birds were fledglings through July 9. Only 10 of the total birds banded observed during one survey of the Alafia Bank colony this were not resighted as of Jul 9. Based on our estimation of 1.53 season. fledged c/n (52 resighted nestlings/34 nests), we expect about 413 spoonbills (270 nests @ 1.53 c/n) fledged from the Alafia We conducted banding for the Tampa Bay area only at the Alafia Bank. Based on the estimates from Alafia Bank, and our direct Bank this year. The Little Bird Key (“Washburn Jr.”) colony in counts or flight line estimates of spoonbill nests at the other Terra Ceia Bay, usually the second largest colony regionally, was occupied colonies this year we estimate a total of ≥441 chicks occupied early in the nesting season and spoonbills had fledged from ≥327 total nests (≥1.44 c/n) in 10 colonies in commenced building platforms when the colony was checked on Tampa Bay. Spoonbill nesting was affected by low rainfall and Apr 9. We observed at least 12 pairs, which was much fewer summer drought in the two summers preceding this nesting than in 2007. At a follow-up inspection on May 15 we season, followed by heavy rainfall early this spring, which determined that a raccoon had apparently swum out to the discouraged birds at the beginning of the nesting season and island, which is only about 150 m offshore from a populated caused a slower onset of spoonbill nesting. From late March to area, in the intervals since our earlier visit because we found mid-June water levels fell low through a bad drought, then in raccoon tracks and most of the colony had been abandoned. early July we had heavy rainfall just as the spoonbills were trying The spoonbills had left Washburn Jr. and we found a few to bring off their fledges and, going into the end of the fledging building new platforms at the Nina Griffith Washburn Sanctuary period, the water levels are way up and forage availability is about 2.6 km north. Spoonbills had been nesting at Washburn becoming limited so that fledges that should have already left the Wading Bird Report 18