Sales of residential properties in the Victoria region slowed in January 2023 compared to the previous year. Total sales were down 41.4% from January 2022. Sales of single family homes decreased 33% and condominium sales declined 46.3%. However, the real estate board chair noted signs of optimism from realtors and a mid-month surge in activity. Inventory levels rose 3% from the previous month and 133.7% from January 2022. The benchmark price for single family homes fell 3.5% year-over-year while condo prices increased 3%.
VREB January 2023 Statistics with charts and graphs
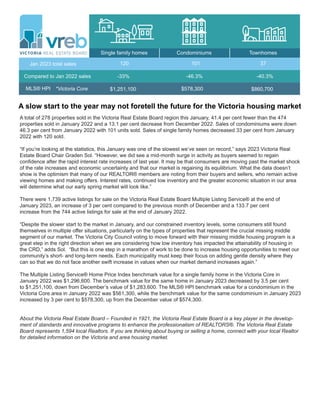
1. A slow start to the year may not foretell the future for the Victoria housing market
A total of 278 properties sold in the Victoria Real Estate Board region this January, 41.4 per cent fewer than the 474
properties sold in January 2022 and a 13.1 per cent decrease from December 2022. Sales of condominiums were down
46.3 per cent from January 2022 with 101 units sold. Sales of single family homes decreased 33 per cent from January
2022 with 120 sold.
“If you’re looking at the statistics, this January was one of the slowest we’ve seen on record,” says 2023 Victoria Real
Estate Board Chair Graden Sol. “However, we did see a mid-month surge in activity as buyers seemed to regain
confidence after the rapid interest rate increases of last year. It may be that consumers are moving past the market shock
of the rate increases and economic uncertainty and that our market is regaining its equilibrium. What the data doesn’t
show is the optimism that many of our REALTOR® members are noting from their buyers and sellers, who remain active
viewing homes and making offers. Interest rates, continued low inventory and the greater economic situation in our area
will determine what our early spring market will look like.”
There were 1,739 active listings for sale on the Victoria Real Estate Board Multiple Listing Service® at the end of
January 2023, an increase of 3 per cent compared to the previous month of December and a 133.7 per cent
increase from the 744 active listings for sale at the end of January 2022.
“Despite the slower start to the market in January, and our constrained inventory levels, some consumers still found
themselves in multiple offer situations, particularly on the types of properties that represent the crucial missing middle
segment of our market. The Victoria City Council voting to move forward with their missing middle housing program is a
great step in the right direction when we are considering how low inventory has impacted the attainability of housing in
the CRD,” adds Sol. “But this is one step in a marathon of work to be done to increase housing opportunities to meet our
community’s short- and long-term needs. Each municipality must keep their focus on adding gentle density where they
can so that we do not face another swift increase in values when our market demand increases again.”
The Multiple Listing Service® Home Price Index benchmark value for a single family home in the Victoria Core in
January 2022 was $1,296,600. The benchmark value for the same home in January 2023 decreased by 3.5 per cent
to $1,251,100, down from December’s value of $1,283,600. The MLS® HPI benchmark value for a condominium in the
Victoria Core area in January 2022 was $561,300, while the benchmark value for the same condominium in January 2023
increased by 3 per cent to $578,300, up from the December value of $574,300.
About the Victoria Real Estate Board – Founded in 1921, the Victoria Real Estate Board is a key player in the develop-
ment of standards and innovative programs to enhance the professionalism of REALTORS®. The Victoria Real Estate
Board represents 1,594 local Realtors. If you are thinking about buying or selling a home, connect with your local Realtor
for detailed information on the Victoria and area housing market.
Single family homes Condominiums Townhomes
Jan 2023 total sales
Compared to Jan 2022 sales
MLS® HPI
120
$1,251,100
101
-33% -46.3%
37
-40.3%
$578,300 $860,700
*Victoria Core
2. Sales by Property Type
Single Family Greater Victoria
Single Family Other Areas
Single Family Total All Areas
Condo Apartment
Row/Townhouse
Manufactured Home
Total Residential
Total Sales
Active Listings
Units Median$
Average$
LY%
LM% LY%
LM% LY%
LM% Units Median$
Average$ Units Median$
Average$
January 2023
116
101
37
5
263
120
278
4
1,739
146
94
41
9
300
156
320
10
1,688
174
188
62
15
444
179
474
5
744
$1,226,580
$606,681
$662,338
$327,000
$1,233,152
$1,423,750
$1,065,000
$530,000
$620,000
$295,000
$1,065,000
$1,172,500
$1,259,045
$549,561
$748,795
$394,111
$1,244,484
$1,031,900
$1,050,000
$510,000
$725,000
$335,500
$1,050,000
$1,050,000
$1,415,759
$683,759
$872,661
$376,653
$1,410,380
$1,223,200
$1,250,000
$603,420
$861,250
$350,000
$1,252,500
$1,300,000
-20.5%
7.4%
-9.8%
-44.4%
-12.3%
-23.1%
-13.1%
-60.0%
3.0%
-33.3%
-46.3%
-40.3%
-66.7%
-40.8%
-33.0%
-41.4%
-20.0%
133.7%
-2.6%
10.4%
-11.5%
-17.0%
-0.9%
38.0%
-13.4%
-11.3%
-24.1%
-13.2%
-12.6%
16.4%
1.4%
3.9%
-14.5%
-12.1%
1.4%
11.7%
-14.8%
-12.2%
-28.0%
-15.7%
-15.0%
-9.8%
December 2022 January 2022
Legend
Units: net number of listings sold
LM%: percentage change since Last Month
LY%: percentage change since This Month Last Year
Average$: average selling price
Median$: median selling price
Total Residential: includes sales of residential property types
Total Sales: includes sales of all property types
Active Listings: total listings of all types on the market at midnight on the last day of the month
This Month Last Month
Produced: 01-Feb-2023
January 2023
Previous Periods Comparison
This Month Last Year
Page 1 of 1
Victoria Real Estate Board Multiple Listing Service ®
January 2023
Statistics Package for Media
Victoria Real Estate Board January 2023 Statistics - page 2
Previous Periods Comparison of Unit Sales, Average Prices and Median Prices
Previous Periods Comparison of MLS® HPI Benchmark Prices and MLS® HPI Index Values
3. 6DOHVWR$FWLYH/LVWLQJV5DWLR
The ratio of counts of total residential sales over total active residential listings for the last 25 months
-DQXDU
Produced: 01-Feb-2023
-DQ
)HE
0DU
$SU
0D
-XQ
-XO
$XJ
6HS
2FW
1RY
'HF
-DQ
)HE
0DU
$SU
0D
-XQ
-XO
$XJ
6HS
2FW
1RY
'HF
-DQ
7KH6DOHVWR$FWLYH/LVWLQJV5DWLR
7KLV FKDUWWUDFNVWKHUDWLRRIWRWDOUHVLGHQWLDOVDOHVRYHUWRWDODFWLYHUHVLGHQWLDOOLVWLQJVDWPRQWKHQGIRU
HDFKRIWKHODVWPRQWKV
7KHDFWLYHOLVWLQJFRXQWDQGWKHVDOHVFRXQWFDQEHYLHZHGDVLQGLFDWRUVRIKRXVLQJVXSSODQG
GHPDQGUHVSHFWLYHO2EVHUYLQJWKHUDWLREHWZHHQWKHPFDQWKXVKHOSLQGLFDWHDEXHUV PDUNHW
ZKHUHWKHUHLVVXVWDLQHGGRZQZDUGSUHVVXUHRQSULFHVDQGDVHOOHUV PDUNHWZKHUHWKHUHLV
VXVWDLQHGXSZDUGSUHVVXUHRQSULFHV
%DVHGRQDUHJUHVVLRQDQDOVLVSHUIRUPHGEWKH(FRQRPLFV'HSDUWPHQWRIWKH%5HDO(VWDWH
$VVRFLDWLRQLQHDFKPDUNHWDUHDRIWKHSURYLQFHWKH6DOHVWR$FWLYH/LVWLQJV5DWLRIRU9LFWRULDFDQEH
LQWHUSUHWHGDVIROORZV
EHORZWKHUHLVGRZQZDUGSUHVVXUHRQSULFHV EXHUV PDUNHW
DERYHWKHUHLVXSZDUGSUHVVXUHRQSULFHV VHOOHUV PDUNHW
Sales to Active Listings Ratio
This chart tracks the ratio of total residential sales over total active residential listings at month-end for each of
the last 25 months.
Based on a regression analysis performed by the economics department at the BC Real Estate Association in
each market area of the province, the Sales to Active Listings Ratio for Victoria can be interpreted as follows:
- below 14%, there is downward pressure on prices (buyers' market)
- above 20%, there is upward pressure on prices (sellers' market)
- in the 14-20% range, there is little pressure on prices either way (balanced market)
Victoria Real Estate Board January 2023 Statistics - page 3
Total new MLS® listings and total MLS® sales for entire district
4. The Victoria Real Estate Board uses the MLS® Home Price Index (MLS® HPI) to report on market
trends. The MLS® HPI uses the concept of a benchmark home, a notional home with common
attributes of typical homes in a defined area.
Through the analysis of over fifteen years of Victoria Real Estate Board MLS® sales data, the MLS®
HPI defined benchmark homes for Victoria in each category (single family homes, townhouses,
condos) and for each neighbourhood. The benchmark starting point was 2005, where each type of
property and neighbourhood was assigned an index value of 100.
*The HPI reporting herein is based on the SOLD date.
Victoria Real Estate Board January 2023 Statistics - page 4
MLS® HPI benchmark and value - Single Family Homes
5. MLS® HPI benchmark and value - Condominium / Apartments
Victoria Real Estate Board January 2023 Statistics - page 5
6. Note: Areas with insufficient sales are not included in the HPI.
Source: Victoria Real Estate Board
January 2023 1 Month Ago 3 Months Ago 6 Months Ago 12 Months Ago 3 Years Ago 5 Years Ago January 2005
Victoria REB – SF-All
Victoria – SF-All
Victoria West – SF-All
Oak Bay – SF-All
Esquimalt – SF-All
View Royal – SF-All
Saanich East – SF-All
Saanich West – SF-All
Sooke – SF-All
Langford – SF-All
Metchosin – SF-All
Colwood – SF-All
Highlands – SF-All
North Saanich – SF-All
Sidney – SF-All
Central Saanich – SF-All
ML Malahat Area –
SF-All
GI Gulf Islands – SF-All
$999,900
$995,200
$993,000
$989,700
$984,700
$983,700
$972,000
$966,700
$963,800
$962,300
$952,900
$952,000
$938,700
$934,800
$933,000
$929,700
$927,600
$924,500
$907,300
$906,200
$903,600
$875,600
$873,600
$865,300
$859,700
$851,700
$843,200
$837,500
$836,200
$825,000
$818,500
$816,600
$796,600
$793,600
$791,000
$772,800
$764,900
$764,700
$752,700
$736,800
$733,700
$725,500
$716,700
$704,900
$703,700
$700,600
$692,200
$670,700
$668,200
$667,600
$665,200
$648,700
$648,500
$600,100
$581,200
$569,900
$566,200
$543,900
$505,400
$475,900
$469,000
$452,400
$436,800
$417,900
$384,500
$370,800
$355,800
$336,900
$330,600
$327,600
$319,700
$303,500
$303,200
$302,700
$294,100
$288,400
$270,400
$1,935,500 $1,934,300
$1,843,500
$1,757,000 $1,727,300
$1,536,700
$1,502,600
$1,464,900
$1,434,800
$1,432,300
$1,423,600
$1,419,000
$1,403,800
$1,401,800 $1,393,200
$1,379,200
$1,369,800
$1,356,700
$1,354,700
$1,336,400
$1,308,700
$1,305,000 $1,294,100
$1,290,600
$1,280,600
$1,273,200
$1,269,300
$1,262,300
$1,250,000
$1,246,300 $1,240,200
$1,230,400
$1,226,200
$1,206,200
$1,193,600
$1,187,600
$1,159,600
$1,157,500
$1,154,600
$1,147,500
$1,136,400
$1,135,600
$1,120,700
$1,117,400
$1,108,800
$1,098,100
$1,094,500
$1,093,500
$1,091,600
$1,085,300
$1,077,800
$1,073,600
$1,068,800
$1,066,700
$1,065,200
$1,057,900
$1,050,300
$1,044,600 $1,042,600
$1,031,600
$1,028,400
$1,025,500
$1,020,900
$1,012,400
$1,007,000
$1,003,500
$1,002,700
Benchmark Price by Timeframe and Property Type
Value or percent change
Value
Percent change
HPI or Benchmark Price
HPI
Benchmark Price
1. Area Group
VREB District Summary
3. Area/Property Type Selection
All
2. Property Type
– Single Family-All (SF-All)
7. Note: Areas with insufficient sales are not included in the HPI.
Source: Victoria Real Estate Board
January 2023 1 Month Ago 3 Months Ago 6 Months Ago 12 Months Ago 3 Years Ago 5 Years Ago January 2005
Victoria REB – SF-All
Victoria – SF-All
Victoria West – SF-All
Oak Bay – SF-All
Esquimalt – SF-All
View Royal – SF-All
Saanich East – SF-All
Saanich West – SF-All
Sooke – SF-All
Langford – SF-All
Metchosin – SF-All
Colwood – SF-All
Highlands – SF-All
North Saanich – SF-All
Sidney – SF-All
Central Saanich – SF-All
ML Malahat Area –
SF-All
GI Gulf Islands – SF-All
366.5
366.3
362.5
360.7
356.3
355.5
354.0
350.5
350.1
347.0
345.8
345.4
345.0
340.6
340.2
340.0
335.2
333.7
332.1
331.5
330.2
328.5
328.2
327.7
327.7
327.2
325.1
324.5
324.4
324.2
324.1
323.8
323.3
322.5
322.5 322.3
321.9
321.1
320.6
318.9 318.3
316.7
316.2
316.1
315.7
315.0
315.0
314.8
314.2
314.0
313.7
313.2
312.7
311.1
310.6
309.7
309.6
308.5
307.6
307.2
306.3
305.4
305.1
305.0
304.7
304.4
303.3
302.1
301.3
299.3
299.1
298.9
298.8
298.2
297.1
296.3
292.8
292.4
292.4
292.3
289.9
289.8
287.8
287.8
280.8
280.7
269.7
269.1
252.0
248.0
242.0
239.7
235.0
231.5
227.2
225.0
224.6
223.9
222.9
222.0
221.2
219.8
217.2
216.8
215.3
215.1
214.0
211.7
211.5
211.3
210.8
208.9
208.8
206.2
205.5
203.1
202.8
201.5
200.0
198.0
196.8
188.6
186.9
186.6
181.1
149.1 100.0
100.0
100.0
100.0
100.0
100.0
100.0
100.0
100.0
100.0
100.0
100.0
100.0
100.0
100.0
100.0
100.0
100.0
HPI by Timeframe and Property Type
Value or percent change
Value
Percent change
HPI or Benchmark Price
HPI
Benchmark Price
1. Area Group
VREB District Summary
3. Area/Property Type Selection
All
2. Property Type
– Single Family-All (SF-All)
8. Note: Areas with insufficient sales are not included in the HPI.
Source: Victoria Real Estate Board
January 2023 1 Month Ago 3 Months Ago 6 Months Ago 12 Months Ago 3 Years Ago 5 Years Ago January 2005
Victoria REB – Con
Victoria – Con
Victoria West – Con
Oak Bay – Con
Esquimalt – Con
View Royal – Con
Saanich East – Con
Saanich West – Con
Sooke – Con
Langford – Con
Colwood – Con
North Saanich – Con
Sidney – Con
Central Saanich – Con
$862,200
$828,100
$825,500
$817,300
$779,900
$777,700
$769,700
$765,700
$747,600
$747,000
$731,900
$716,800
$712,100
$708,300
$706,400
$676,500
$670,000
$649,900
$637,400
$629,400
$628,300
$627,200
$620,100
$618,100
$610,600
$607,100
$604,300
$603,500
$602,900
$596,700
$596,700
$589,900
$588,500 $585,900
$583,700
$582,100
$572,800
$569,900
$568,200
$566,700
$566,500
$566,000
$566,000
$565,500
$563,600
$562,700
$559,700
$558,700
$556,700
$552,900
$551,500
$550,000
$549,900
$549,100
$537,300
$536,400
$533,800
$530,300
$524,200
$523,600
$522,000
$513,800 $512,500
$512,400
$511,500
$507,800
$506,000
$505,200
$501,000
$497,200
$488,800
$488,200
$484,000
$459,100 $452,900
$451,400
$449,900
$445,700
$438,300
$436,200
$435,100
$434,500
$433,800
$426,000
$423,300
$421,000
$388,500
$387,100
$384,200
$368,800
$365,900
$358,400
$357,600 $349,300
$347,000
$328,400
$294,900
$285,500
$262,900
$234,200
$231,100
$199,200
$195,700
$195,500
$169,900
$167,000
$159,100
$152,000
$150,200
$143,700
$131,400
$115,000
Benchmark Price by Timeframe and Property Type
Value or percent change
Value
Percent change
HPI or Benchmark Price
HPI
Benchmark Price
1. Area Group
VREB District Summary
3. Area/Property Type Selection
All
2. Property Type
– Condo Apartment (Con)
9. Note: Areas with insufficient sales are not included in the HPI.
Source: Victoria Real Estate Board
January 2023 1 Month Ago 3 Months Ago 6 Months Ago 12 Months Ago 3 Years Ago 5 Years Ago January 2005
Victoria REB – Con
Victoria – Con
Victoria West – Con
Oak Bay – Con
Esquimalt – Con
View Royal – Con
Saanich East – Con
Saanich West – Con
Sooke – Con
Langford – Con
Colwood – Con
North Saanich – Con
Sidney – Con
Central Saanich – Con
435.9
432.3
424.5
423.7
406.2
400.6
399.2 393.8
391.0 390.0
383.0
382.7
381.3
375.0
373.1
372.7
372.0
370.4
369.8
365.6
365.6
364.8
364.4
357.2
356.6
356.2
353.6
352.9
351.8
351.2
349.0
345.7
345.6
343.4
342.4
340.2
338.1
337.5
336.9
336.4
335.4
333.1
332.9
332.4
331.7
330.2
325.4
325.4
323.5
321.9
320.5
319.6
316.9
312.5
310.5
308.4
306.1
301.9
301.7
301.6
295.7
295.4 294.1
289.5
283.9
280.1
272.8
272.4
269.7
268.2
266.2
263.9
261.6
260.9
256.7
256.6
256.4
253.5
249.4
248.1
247.6
244.9
243.6
235.3
230.7
230.1
229.8
228.6
227.8
225.9
224.2
222.0
218.6
218.1
211.7
211.3
185.8
179.2
100.0
100.0
100.0
100.0
100.0
100.0
100.0
100.0
100.0
100.0
100.0
100.0
100.0
100.0
HPI by Timeframe and Property Type
Value or percent change
Value
Percent change
HPI or Benchmark Price
HPI
Benchmark Price
1. Area Group
VREB District Summary
3. Area/Property Type Selection
All
2. Property Type
– Condo Apartment (Con)
10. Note: Areas with insufficient sales are not included in the HPI.
Source: Victoria Real Estate Board
January 2023 1 Month Ago 3 Months Ago 6 Months Ago 12 Months Ago 3 Years Ago 5 Years Ago January 2005
Victoria REB – Twn
Victoria – Twn
Victoria West – Twn
Esquimalt – Twn
View Royal – Twn
Saanich East – Twn
Saanich West – Twn
Sooke – Twn
Langford – Twn
Colwood – Twn
Sidney – Twn
Central Saanich – Twn
ML Malahat Area – Twn
GI Gulf Islands – Twn
$970,200
$964,100
$938,300
$921,600
$920,300 $918,700
$910,300
$910,200 $899,000
$885,200
$881,200
$877,900
$875,600
$874,100
$864,600
$857,400
$853,200
$847,300
$844,500
$841,600
$841,000
$828,300
$815,200
$813,800
$809,400
$805,800
$804,500
$802,500
$801,400
$794,500
$792,700
$790,700
$790,500
$785,100
$782,300
$781,500
$779,100
$778,200
$777,800
$775,400
$775,000 $768,400
$766,200
$765,000
$762,500
$759,400
$752,600
$750,000
$749,700 $749,300
$742,500
$736,200
$735,700
$729,400
$719,700
$715,100
$711,400
$711,300
$706,200
$705,900
$703,100
$700,900
$700,200 $698,800
$697,400
$696,700
$691,600
$687,500
$680,700
$674,900 $653,600
$649,000
$635,600
$631,500 $608,000
$585,700
$564,700
$560,600
$555,500
$548,300
$545,100
$539,200
$530,600
$525,800
$522,200
$522,000
$511,400
$505,300 $479,600
$477,700
$471,300
$467,500
$462,500
$461,500
$440,600
$440,200
$392,700
$389,400
$321,500
$295,200
$288,500
$258,200
$254,800
$245,700
$244,300
$240,700
$232,300
$221,100
$219,500
$213,400
$212,000
$201,100
Benchmark Price by Timeframe and Property Type
Value or percent change
Value
Percent change
HPI or Benchmark Price
HPI
Benchmark Price
1. Area Group
VREB District Summary
3. Area/Property Type Selection
All
2. Property Type
– Townhouse (Twn)
11. Note: Areas with insufficient sales are not included in the HPI.
Source: Victoria Real Estate Board
January 2023 1 Month Ago 3 Months Ago 6 Months Ago 12 Months Ago 3 Years Ago 5 Years Ago January 2005
Victoria REB – Twn
Victoria – Twn
Victoria West – Twn
Esquimalt – Twn
View Royal – Twn
Saanich East – Twn
Saanich West – Twn
Sooke – Twn
Langford – Twn
Colwood – Twn
Sidney – Twn
Central Saanich – Twn
ML Malahat Area – Twn
GI Gulf Islands – Twn
427.5
414.7
403.3
402.5
398.2
388.1
384.7
382.0
372.8 372.6
365.8
365.1
362.7
358.5
357.3
357.3
351.0
351.0
345.0
344.5
336.8
335.6
331.2
330.4
330.3
330.1
329.8
329.6
327.4
326.6
326.2
326.2
323.6
323.4 319.4
318.1
317.0
316.7
315.4
312.2
311.8 311.2
310.8
309.8
308.5
308.1
306.2
306.2
305.3 304.2
304.1
301.8
301.6
300.7
299.9
296.3
295.7
293.7
292.9
292.1
285.6
283.1
280.4
279.6
275.4
274.1 272.3
271.5
269.7 263.2 260.0
248.3
244.7
239.7
234.4
230.6
229.8
225.3
220.7
219.1
218.0
217.5
217.1
215.3
212.5
208.7
207.8
206.5
203.6
200.7
196.4
195.3
192.1
190.1
189.1
183.9
182.9
176.1 100.0
100.0
100.0
100.0
100.0
100.0
100.0
100.0
100.0
100.0
100.0
100.0
100.0
100.0
HPI by Timeframe and Property Type
Value or percent change
Value
Percent change
HPI or Benchmark Price
HPI
Benchmark Price
1. Area Group
VREB District Summary
3. Area/Property Type Selection
All
2. Property Type
– Townhouse (Twn)
12. Note: Areas with insufficient sales are not included in the HPI.
Source: Victoria Real Estate Board
Victoria REB – SF-All Core – SF-All Westshore – SF-All Peninsula – SF-All
Select Date Range:
All values
Jan
2003
Jan
2005
Jan
2007
Jan
2009
Jan
2011
Jan
2013
Jan
2015
Jan
2017
Jan
2019
Jan
2021
Jan
2023
Benchmark
Price
($)
200,000
400,000
600,000
800,000
1,000,000
1,200,000
1,400,000
Benchmark Price Performance over Time
1. Area Group
VREB Area Summary
3. Area/Property Type Selection
Multiple values
2. Property Type
– Single Family-All (SF-All)
HPI or Benchmark Price
HPI
Benchmark Price
Adding labels
Hold Ctrl (Cmd) and select points on the chart to show multiple date/value labels
13. Note: Areas with insufficient sales are not included in the HPI.
Source: Victoria Real Estate Board
Victoria REB – Con Core – Con Westshore – Con Peninsula – Con
Select Date Range:
All values
Jan
2003
Jan
2005
Jan
2007
Jan
2009
Jan
2011
Jan
2013
Jan
2015
Jan
2017
Jan
2019
Jan
2021
Jan
2023
Benchmark
Price
($)
100,000
200,000
300,000
400,000
500,000
600,000
Benchmark Price Performance over Time
1. Area Group
VREB Area Summary
3. Area/Property Type Selection
All
2. Property Type
– Condo Apartment (Con)
HPI or Benchmark Price
HPI
Benchmark Price
Adding labels
Hold Ctrl (Cmd) and select points on the chart to show multiple date/value labels
14. Note: Areas with insufficient sales are not included in the HPI.
Source: Victoria Real Estate Board
Victoria REB – Twn Core – Twn Westshore – Twn Peninsula – Twn
Select Date Range:
All values
Jan
2003
Jan
2005
Jan
2007
Jan
2009
Jan
2011
Jan
2013
Jan
2015
Jan
2017
Jan
2019
Jan
2021
Jan
2023
Benchmark
Price
($)
200,000
300,000
400,000
500,000
600,000
700,000
800,000
900,000
Benchmark Price Performance over Time
1. Area Group
VREB Area Summary
3. Area/Property Type Selection
Multiple values
2. Property Type
– Townhouse (Twn)
HPI or Benchmark Price
HPI
Benchmark Price
Adding labels
Hold Ctrl (Cmd) and select points on the chart to show multiple date/value labels
15. Note: Areas with insufficient sales are not included in the HPI.
Source: Victoria Real Estate Board
Victoria REB – SF-All Victoria REB – Twn Victoria REB – Con
Select Date Range:
All values
Jan
2003
Jan
2005
Jan
2007
Jan
2009
Jan
2011
Jan
2013
Jan
2015
Jan
2017
Jan
2019
Jan
2021
Jan
2023
Benchmark
Price
($)
200,000
400,000
600,000
800,000
1,000,000
1,200,000
Benchmark Price Performance over Time
1. Area Group
VREB Area Summary
3. Area/Property Type Selection
Multiple values
2. Property Type
Multiple values
HPI or Benchmark Price
HPI
Benchmark Price
Adding labels
Hold Ctrl (Cmd) and select points on the chart to show multiple date/value labels
16. Monthly Sales Summary (Mark I)
Residential Waterfront Properties Integrated Into Their Own Districts
Units Total Volume
January 2023
District
Produced: 01-Feb-2023
Residential
Single Family Detached
l
Greater Victoria
Victoria / Victoria West 12 $13,422,600
Oak Bay 8 $15,235,750
Esquimalt 3 $2,545,000
Saanich East 20 $31,618,250
Saanich West 9 $8,404,800
Central Saanich 7 $8,139,000
North Saanich 5 $6,211,612
Sidney 5 $5,873,000
Colwood 11 $10,808,899
Langford 11 $11,990,318
Metchosin 1 $1,207,000
Sooke 11 $14,587,500
Gulf Islands 13 $12,239,500
Total Greater Victoria 116 $142,283,229
Other Areas
Malahat Area 4 $5,695,000
Total Other Areas 4 $5,695,000
Total Single Family Detached 120 $147,978,229
Condo Apartment
l
Greater Victoria
Victoria / Victoria West 40 $24,131,600
Oak Bay 3 $2,587,015
Esquimalt 6 $2,941,000
View Royal 1 $519,900
Saanich East 13 $8,048,500
Saanich West 6 $2,860,000
Central Saanich 4 $2,128,400
Sidney 9 $7,429,000
Colwood 3 $2,426,000
Langford 16 $8,203,388
Total Greater Victoria 101 $61,274,803
Total Condo Apartment 101 $61,274,803
Page 1 of 3
Victoria Real Estate Board Multiple Listing Service ®
17. Monthly Sales Summary (Mark I)
Residential Waterfront Properties Integrated Into Their Own Districts
Units Total Volume
January 2023
District
Produced: 01-Feb-2023
Row/Townhouse
l
Greater Victoria
Victoria / Victoria West 6 $4,751,900
Esquimalt 2 $1,602,900
View Royal 1 $770,000
Saanich East 3 $2,864,999
Saanich West 2 $1,305,000
Central Saanich 1 $765,000
Sidney 1 $632,000
Colwood 1 $580,000
Langford 6 $4,184,650
Sooke 11 $6,430,055
Gulf Islands 3 $620,000
Total Greater Victoria 37 $24,506,504
Total Row/Townhouse 37 $24,506,504
Manufactured Home
l
Greater Victoria
Central Saanich 1 $295,000
Langford 2 $450,000
Gulf Islands 1 $500,000
Total Greater Victoria 4 $1,245,000
Other Areas
Malahat Area 1 $390,000
Total Other Areas 1 $390,000
Total Manufactured Home 5 $1,635,000
Total Residential 263 $235,394,536
Page 2 of 3
Victoria Real Estate Board Multiple Listing Service ®
18. Monthly Sales Summary (Mark I)
Residential Waterfront Properties Integrated Into Their Own Districts
Units Total Volume
January 2023
District
Produced: 01-Feb-2023
$244,285,611
278
Grand Totals
Other Property
Lots Acreage
l
Greater Victoria
Colwood 1 $675,000
Langford 1 $2,700,000
Gulf Islands 2 $3,061,000
Total Greater Victoria 4 $6,436,000
Total Lots Acreage 4 $6,436,000
11 $2,455,075
Other Commercial Properties
l
Page 3 of 3
Victoria Real Estate Board Multiple Listing Service ®
19. Monthly Sales Summary (Mark II)
Waterfront Properties Segregated Into a 'Waterfront' District
Units Total Volume
January 2023
District
Produced: 01-Feb-2023
Residential
Single Family Detached
l
Greater Victoria
Victoria 12 $13,422,600
Oak Bay 8 $15,235,750
Esquimalt 3 $2,545,000
Saanich East 20 $31,618,250
Saanich West 9 $8,404,800
Central Saanich 6 $5,439,000
North Saanich 5 $6,211,612
Sidney 5 $5,873,000
Colwood 11 $10,808,899
Langford 10 $10,540,318
Metchosin 1 $1,207,000
Sooke 9 $9,147,500
Gulf Islands 9 $6,849,500
Waterfront (all districts) 8 $14,980,000
Total Greater Victoria 116 $142,283,229
Other Areas
Malahat Area 4 $5,695,000
Total Other Areas 4 $5,695,000
Total Single Family Detached 120 $147,978,229
Condo Apartment
l
Greater Victoria
Victoria 33 $18,031,600
Victoria West 4 $3,445,000
Oak Bay 3 $2,587,015
Esquimalt 6 $2,941,000
View Royal 1 $519,900
Saanich East 13 $8,048,500
Saanich West 6 $2,860,000
Central Saanich 3 $1,528,500
Sidney 7 $4,814,000
Colwood 3 $2,426,000
Langford 16 $8,203,388
Waterfront (all districts) 6 $5,869,900
Total Greater Victoria 101 $61,274,803
Total Condo Apartment 101 $61,274,803
Page 1 of 3
Victoria Real Estate Board Multiple Listing Service ®
20. Monthly Sales Summary (Mark II)
Waterfront Properties Segregated Into a 'Waterfront' District
Units Total Volume
January 2023
District
Produced: 01-Feb-2023
Row/Townhouse
l
Greater Victoria
Victoria 4 $3,266,900
Victoria West 2 $1,485,000
Esquimalt 2 $1,602,900
View Royal 1 $770,000
Saanich East 3 $2,864,999
Saanich West 2 $1,305,000
Central Saanich 1 $765,000
Sidney 1 $632,000
Colwood 1 $580,000
Langford 6 $4,184,650
Sooke 11 $6,430,055
Waterfront (all districts) 3 $620,000
Total Greater Victoria 37 $24,506,504
Total Row/Townhouse 37 $24,506,504
Manufactured Home
l
Greater Victoria
Central Saanich 1 $295,000
Langford 2 $450,000
Gulf Islands 1 $500,000
Total Greater Victoria 4 $1,245,000
Other Areas
Malahat Area 1 $390,000
Total Other Areas 1 $390,000
Total Manufactured Home 5 $1,635,000
Total Residential 263 $235,394,536
Page 2 of 3
Victoria Real Estate Board Multiple Listing Service ®
21. Monthly Sales Summary (Mark II)
Waterfront Properties Segregated Into a 'Waterfront' District
Units Total Volume
January 2023
District
Produced: 01-Feb-2023
$244,285,611
278
Grand Totals
Other Property
Lots Acreage
l
Greater Victoria
Colwood 1 $675,000
Langford 1 $2,700,000
Gulf Islands 2 $3,061,000
Total Greater Victoria 4 $6,436,000
Total Lots Acreage 4 $6,436,000
11 $2,455,075
Other Commercial Properties
l
Page 3 of 3
Victoria Real Estate Board Multiple Listing Service ®
22. Sales to Active Listings Ratio
The ratio of counts of total residential sales over total active residential listings for the last 25 months
January 2023
Produced: 01-Feb-2023
10%
20%
30%
40%
50%
60%
70%
80%
90%
100%
110%
120%
Jan
2021
Feb
2021
Mar
2021
Apr
2021
May
2021
Jun
2021
Jul
2021
Aug
2021
Sep
2021
Oct
2021
Nov
2021
Dec
2021
Jan
2022
Feb
2022
Mar
2022
Apr
2022
May
2022
Jun
2022
Jul
2022
Aug
2022
Sep
2022
Oct
2022
Nov
2022
Dec
2022
Jan
2023
The Sales to Active Listings Ratio
This chart tracks the ratio of total residential sales over total active residential listings at month-end for
each of the last 25 months.
The active listing count and the sales count can be viewed as indicators of housing supply and
demand respectively. Observing the ratio between them can thus help indicate a buyers' market,
where there is sustained downward pressure on prices, and a sellers' market, where there is
sustained upward pressure on prices.
Based on a regression analysis performed by the Economics Department of the BC Real Estate
Association in each market area of the province, the Sales to Active Listings Ratio for Victoria can be
interpreted as follows:
- below 14%, there is downward pressure on prices (buyers' market)
- above 20%, there is upward pressure on prices (sellers' market)
- in the 14-20% range, there is little pressure on prices either way (balanced market)
Victoria Real Estate Board Multiple Listing Service ® Page 1 of 1
23. Monthly Comparative Activity By Property Type
Includes All MLS® Property Types
January 2023
Current Month
This Year % Change
Last Year
Year To Date
This Year % Change
Last Year
Produced: 01-Feb-2023
Single Family - Residential
Units Listed 252
Units Sold 88
Sell/List Ratio 35
Sales Dollars $103,999,911
Average Price / Unit $1,181,817
Price Ratio 97
Days To Sell 56
Active Listings at Month End 472
%
%
219
147
67
$204,408,566
$1,390,534
107
16
152
%
%
15
-40
-49
-15
258
211
%
%
%
%
%
%
252
88
35
$103,999,911
$1,181,817
97
56
%
%
219
147
67
$204,408,566
$1,390,534
107
16
%
%
15
-40
-49
-15
258
%
%
%
%
%
Single Family - Residential Waterfront
Units Listed 27
Units Sold 8
Sell/List Ratio 30
Sales Dollars $14,980,000
Average Price / Unit $1,872,500
Price Ratio 90
Days To Sell 85
Active Listings at Month End 84
%
%
15
10
67
$22,463,000
$2,246,300
100
26
36
%
%
80
-20
-33
-17
228
133
%
%
%
%
%
%
27
8
30
$14,980,000
$1,872,500
90
85
%
%
15
10
67
$22,463,000
$2,246,300
100
26
%
%
80
-20
-33
-17
228
%
%
%
%
%
Single Family - Residential Acreage
Units Listed 35
Units Sold 11
Sell/List Ratio 31
Sales Dollars $17,632,000
Average Price / Unit $1,602,909
Price Ratio 92
Days To Sell 54
Active Listings at Month End 91
%
%
17
5
29
$8,852,350
$1,770,470
92
46
35
%
%
106
120
99
-9
19
160
%
%
%
%
%
%
35
11
31
$17,632,000
$1,602,909
92
54
%
%
17
5
29
$8,852,350
$1,770,470
92
46
%
%
106
120
99
-9
19
%
%
%
%
%
Condo Apartment
Units Listed 267
Units Sold 101
Sell/List Ratio 38
Sales Dollars $61,274,803
Average Price / Unit $606,681
Price Ratio 96
Days To Sell 41
Active Listings at Month End 416
%
%
246
188
76
$128,546,638
$683,759
104
19
166
%
%
9
-46
-52
-11
113
151
%
%
%
%
%
%
267
101
38
$61,274,803
$606,681
96
41
%
%
246
188
76
$128,546,638
$683,759
104
19
%
%
9
-46
-52
-11
113
%
%
%
%
%
Page 1 of 8
Victoria Real Estate Board Multiple Listing Service ®
24. Monthly Comparative Activity By Property Type
Includes All MLS® Property Types
January 2023
Current Month
This Year % Change
Last Year
Year To Date
This Year % Change
Last Year
Produced: 01-Feb-2023
Row/Townhouse
Units Listed 79
Units Sold 37
Sell/List Ratio 47
Sales Dollars $24,506,504
Average Price / Unit $662,338
Price Ratio 99
Days To Sell 32
Active Listings at Month End 147
%
%
68
62
91
$54,104,978
$872,661
104
28
41
%
%
16
-40
-55
-24
14
259
%
%
%
%
%
%
79
37
47
$24,506,504
$662,338
99
32
%
%
68
62
91
$54,104,978
$872,661
104
28
%
%
16
-40
-55
-24
14
%
%
%
%
%
Half Duplex (Up and Down)
Units Listed 0
Units Sold 0
Sell/List Ratio
Sales Dollars $0
Average Price / Unit
Price Ratio
Days To Sell
Active Listings at Month End 0
%
%
0
1
$1,784,000
$1,784,000
95
408
1
%
%
-100
-100
-100
%
%
%
%
%
%
0
0
$0
%
%
0
1
$1,784,000
$1,784,000
95
408
%
%
-100
-100
%
%
%
%
%
Half Duplex (Side by Side)
Units Listed 15
Units Sold 9
Sell/List Ratio 60
Sales Dollars $8,005,718
Average Price / Unit $889,524
Price Ratio 100
Days To Sell 44
Active Listings at Month End 31
%
%
14
13
93
$11,804,895
$908,069
106
27
10
%
%
7
-31
-32
-2
59
210
%
%
%
%
%
%
15
9
60
$8,005,718
$889,524
100
44
%
%
14
13
93
$11,804,895
$908,069
106
27
%
%
7
-31
-32
-2
59
%
%
%
%
%
Half Duplex (Front and Back)
Units Listed 3
Units Sold 2
Sell/List Ratio 67
Sales Dollars $1,688,100
Average Price / Unit $844,050
Price Ratio 98
Days To Sell 30
Active Listings at Month End 4
%
%
2
0
$0
1
%
%
50
300
%
%
%
%
%
%
3
2
67
$1,688,100
$844,050
98
30
%
%
2
0
0
$0
%
%
50 %
%
%
%
%
Page 2 of 8
Victoria Real Estate Board Multiple Listing Service ®
25. Monthly Comparative Activity By Property Type
Includes All MLS® Property Types
January 2023
Current Month
This Year % Change
Last Year
Year To Date
This Year % Change
Last Year
Produced: 01-Feb-2023
Recreational
Units Listed 2
Units Sold 1
Sell/List Ratio 50
Sales Dollars $72,500
Average Price / Unit $72,500
Price Ratio 97
Days To Sell 35
Active Listings at Month End 8
%
%
1
1
100
$89,250
$89,250
94
53
6
%
%
100
0
-19
-19
-34
33
%
%
%
%
%
%
2
1
50
$72,500
$72,500
97
35
%
%
1
1
100
$89,250
$89,250
94
53
%
%
100
0
-19
-19
-34
%
%
%
%
%
Manufactured Home
Units Listed 16
Units Sold 5
Sell/List Ratio 31
Sales Dollars $1,635,000
Average Price / Unit $327,000
Price Ratio 93
Days To Sell 83
Active Listings at Month End 41
%
%
15
15
100
$5,649,800
$376,653
100
36
21
%
%
7
-67
-71
-13
132
95
%
%
%
%
%
%
16
5
31
$1,635,000
$327,000
93
83
%
%
15
15
100
$5,649,800
$376,653
100
36
%
%
7
-67
-71
-13
132
%
%
%
%
%
Residential Lots
Units Listed 25
Units Sold 1
Sell/List Ratio 4
Sales Dollars $675,000
Average Price / Unit $675,000
Price Ratio 100
Days To Sell 1
Active Listings at Month End 82
%
%
15
14
93
$9,559,296
$682,807
99
42
27
%
%
67
-93
-93
-1
-98
204
%
%
%
%
%
%
25
1
4
$675,000
$675,000
100
1
%
%
15
14
93
$9,559,296
$682,807
99
42
%
%
67
-93
-93
-1
-98
%
%
%
%
%
Residential Lots - Waterfront
Units Listed 1
Units Sold 0
Sell/List Ratio
Sales Dollars $0
Average Price / Unit
Price Ratio
Days To Sell
Active Listings at Month End 11
%
%
2
0
$0
3
%
%
-50
267
%
%
%
%
%
%
1
0
0
$0
%
%
2
0
0
$0
%
%
-50 %
%
%
%
%
Page 3 of 8
Victoria Real Estate Board Multiple Listing Service ®
26. Monthly Comparative Activity By Property Type
Includes All MLS® Property Types
January 2023
Current Month
This Year % Change
Last Year
Year To Date
This Year % Change
Last Year
Produced: 01-Feb-2023
Residential Acreage
Units Listed 9
Units Sold 2
Sell/List Ratio 22
Sales Dollars $3,011,000
Average Price / Unit $1,505,500
Price Ratio 102
Days To Sell 46
Active Listings at Month End 50
%
%
16
4
25
$2,369,400
$592,350
97
49
34
%
%
-44
-50
27
154
-7
47
%
%
%
%
%
%
9
2
22
$3,011,000
$1,505,500
102
46
%
%
16
4
25
$2,369,400
$592,350
97
49
%
%
-44
-50
27
154
-7
%
%
%
%
%
Residential Acreage - Waterfront
Units Listed 0
Units Sold 1
Sell/List Ratio
Sales Dollars $2,750,000
Average Price / Unit $2,750,000
Price Ratio 92
Days To Sell 57
Active Listings at Month End 18
%
%
1
0
$0
4
%
%
-100
350
%
%
%
%
%
%
0
1
$2,750,000
$2,750,000
92
57
%
%
1
0
0
$0
%
%
-100 %
%
%
%
%
Revenue - Duplex/Triplex
Units Listed 6
Units Sold 1
Sell/List Ratio 17
Sales Dollars $1,600,000
Average Price / Unit $1,600,000
Price Ratio 88
Days To Sell 108
Active Listings at Month End 6
%
%
7
2
29
$3,056,000
$1,528,000
111
7
5
%
%
-14
-50
-48
5
1562
20
%
%
%
%
%
%
6
1
17
$1,600,000
$1,600,000
88
108
%
%
7
2
29
$3,056,000
$1,528,000
111
7
%
%
-14
-50
-48
5
1562
%
%
%
%
%
Revenue - Multi Units
Units Listed 7
Units Sold 0
Sell/List Ratio
Sales Dollars $0
Average Price / Unit
Price Ratio
Days To Sell
Active Listings at Month End 20
%
%
8
3
38
$4,030,000
$1,343,333
102
128
10
%
%
-13
-100
-100
100
%
%
%
%
%
%
7
0
0
$0
%
%
8
3
38
$4,030,000
$1,343,333
102
128
%
%
-13
-100
-100
%
%
%
%
%
Page 4 of 8
Victoria Real Estate Board Multiple Listing Service ®
27. Monthly Comparative Activity By Property Type
Includes All MLS® Property Types
January 2023
Current Month
This Year % Change
Last Year
Year To Date
This Year % Change
Last Year
Produced: 01-Feb-2023
Revenue - Apartment Block
Units Listed 0
Units Sold 0
Sell/List Ratio
Sales Dollars $0
Average Price / Unit
Price Ratio
Days To Sell
Active Listings at Month End 0
%
%
0
0
$0
0
%
%
%
%
%
%
%
%
0
0
$0
%
%
0
0
$0
%
%
%
%
%
%
%
Revenue - Commercial
Units Listed 13
Units Sold 3
Sell/List Ratio 23
Sales Dollars $1,710,000
Average Price / Unit $570,000
Price Ratio 97
Days To Sell 61
Active Listings at Month End 34
%
%
11
4
36
$3,968,512
$992,128
102
39
27
%
%
18
-25
-57
-43
57
26
%
%
%
%
%
%
13
3
23
$1,710,000
$570,000
97
61
%
%
11
4
36
$3,968,512
$992,128
102
39
%
%
18
-25
-57
-43
57
%
%
%
%
%
Revenue - Industrial
Units Listed 3
Units Sold 0
Sell/List Ratio
Sales Dollars $0
Average Price / Unit
Price Ratio
Days To Sell
Active Listings at Month End 14
%
%
5
1
20
$2,975,000
$2,975,000
100
87
15
%
%
-40
-100
-100
-7
%
%
%
%
%
%
3
0
0
$0
%
%
5
1
20
$2,975,000
$2,975,000
100
87
%
%
-40
-100
-100
%
%
%
%
%
Business with Land Building
Units Listed 0
Units Sold 0
Sell/List Ratio
Sales Dollars $0
Average Price / Unit
Price Ratio
Days To Sell
Active Listings at Month End 2
%
%
1
0
$0
4
%
%
-100
-50
%
%
%
%
%
%
0
0
$0
%
%
1
0
0
$0
%
%
-100 %
%
%
%
%
Page 5 of 8
Victoria Real Estate Board Multiple Listing Service ®
28. Monthly Comparative Activity By Property Type
Includes All MLS® Property Types
January 2023
Current Month
This Year % Change
Last Year
Year To Date
This Year % Change
Last Year
Produced: 01-Feb-2023
Business Only
Units Listed 13
Units Sold 4
Sell/List Ratio 31
Sales Dollars $745,000
Average Price / Unit $186,250
Price Ratio 93
Days To Sell 106
Active Listings at Month End 52
%
%
8
1
13
$230,000
$230,000
84
101
38
%
%
63
300
224
-19
5
37
%
%
%
%
%
%
13
4
31
$745,000
$186,250
93
106
%
%
8
1
13
$230,000
$230,000
84
101
%
%
63
300
224
-19
5
%
%
%
%
%
Motel/Hotel
Units Listed 0
Units Sold 0
Sell/List Ratio
Sales Dollars $0
Average Price / Unit
Price Ratio
Days To Sell
Active Listings at Month End 0
%
%
0
0
$0
0
%
%
%
%
%
%
%
%
0
0
$0
%
%
0
0
$0
%
%
%
%
%
%
%
Lease - Office
Units Listed 17
Units Sold 4
Sell/List Ratio 24
Sales Dollars $75
Average Price / Unit $19
Price Ratio 98
Days To Sell 68
Active Listings at Month End 71
%
%
9
1
11
$15
$15
100
44
49
%
%
89
300
418
30
53
45
%
%
%
%
%
%
17
4
24
$75
$19
98
68
%
%
9
1
11
$15
$15
100
44
%
%
89
300
418
30
53
%
%
%
%
%
Lease - Retail
Units Listed 4
Units Sold 0
Sell/List Ratio
Sales Dollars $0
Average Price / Unit
Price Ratio
Days To Sell
Active Listings at Month End 51
%
%
7
1
14
$15
$15
96
50
36
%
%
-43
-100
-100
42
%
%
%
%
%
%
4
0
0
$0
%
%
7
1
14
$15
$15
96
50
%
%
-43
-100
-100
%
%
%
%
%
Page 6 of 8
Victoria Real Estate Board Multiple Listing Service ®
29. Monthly Comparative Activity By Property Type
Includes All MLS® Property Types
January 2023
Current Month
This Year % Change
Last Year
Year To Date
This Year % Change
Last Year
Produced: 01-Feb-2023
Lease - Warehouse
Units Listed 0
Units Sold 0
Sell/List Ratio
Sales Dollars $0
Average Price / Unit
Price Ratio
Days To Sell
Active Listings at Month End 0
%
%
0
0
$0
0
%
%
%
%
%
%
%
%
0
0
$0
%
%
0
0
$0
%
%
%
%
%
%
%
Lease - Industrial
Units Listed 9
Units Sold 0
Sell/List Ratio
Sales Dollars $0
Average Price / Unit
Price Ratio
Days To Sell
Active Listings at Month End 21
%
%
2
0
$0
4
%
%
350
425
%
%
%
%
%
%
9
0
0
$0
%
%
2
0
0
$0
%
%
350 %
%
%
%
%
Lease - Other
Units Listed 1
Units Sold 0
Sell/List Ratio
Sales Dollars $0
Average Price / Unit
Price Ratio
Days To Sell
Active Listings at Month End 3
%
%
0
0
$0
4
%
%
-25
%
%
%
%
%
%
1
0
0
$0
%
%
0
0
$0
%
%
%
%
%
%
%
Commercial Land
Units Listed 1
Units Sold 0
Sell/List Ratio
Sales Dollars $0
Average Price / Unit
Price Ratio
Days To Sell
Active Listings at Month End 10
%
%
3
1
33
$6,175,000
$6,175,000
100
206
15
%
%
-67
-100
-100
-33
%
%
%
%
%
%
1
0
0
$0
%
%
3
1
33
$6,175,000
$6,175,000
100
206
%
%
-67
-100
-100
%
%
%
%
%
Page 7 of 8
Victoria Real Estate Board Multiple Listing Service ®
30. Monthly Comparative Activity By Property Type
Includes All MLS® Property Types
January 2023
Current Month
This Year % Change
Last Year
Year To Date
This Year % Change
Last Year
Produced: 01-Feb-2023
Units Listed 805
Units Sold 278
Sell/List Ratio 35
Sales Dollars $244,285,611
Average Price / Unit $878,725
Price Ratio 96
Days To Sell 49
Active Listings at Month End 1739
%
%
Grand Totals
692
474
68
$470,066,714
$991,702
104
24
744
%
%
16
-41
-48
-11
104
134
%
%
%
%
%
%
805
278
35
$244,285,611
$878,725
96
49
%
%
692
474
68
$470,066,714
$991,702
104
24
%
%
16
-41
-48
-11
104
%
%
%
%
%
Page 8 of 8
Victoria Real Estate Board Multiple Listing Service ®