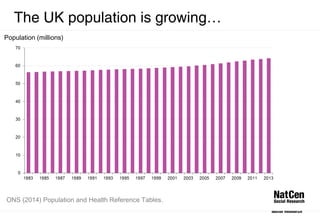
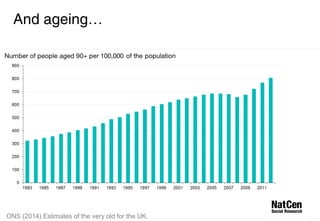
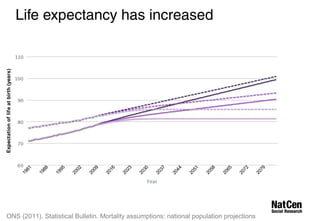
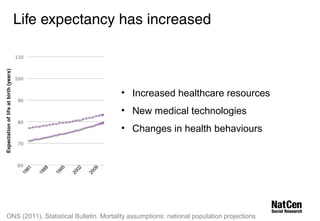
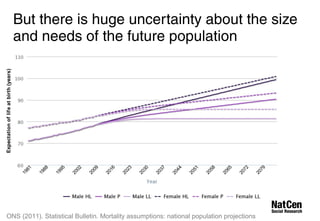
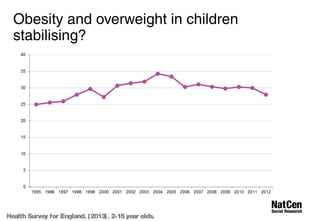
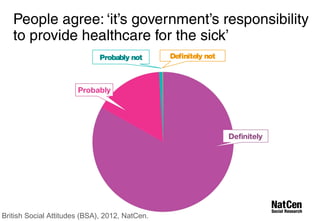
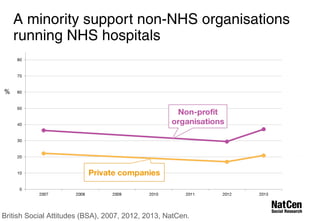
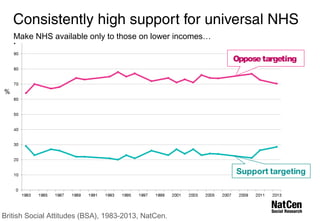
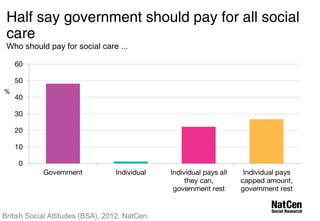
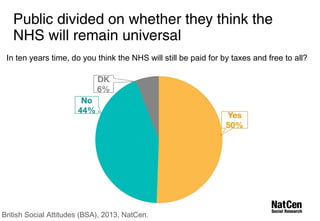
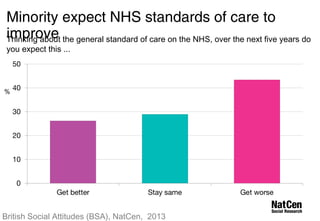
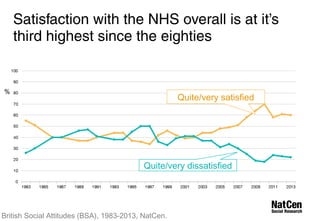
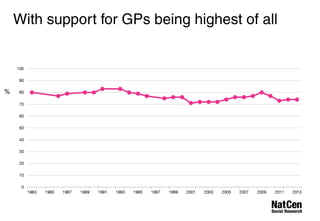
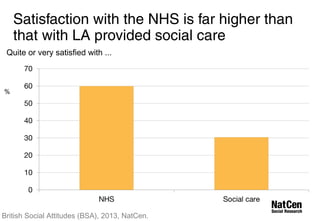
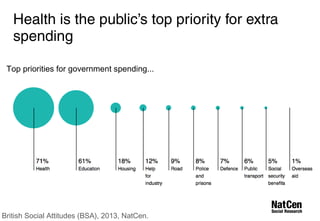
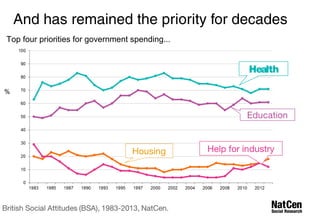
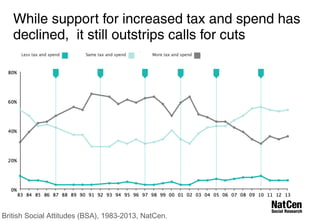
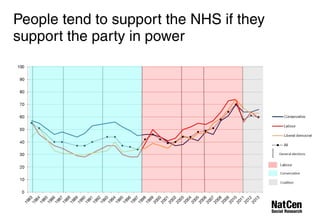
Implications for the NHS: 
trends in public health 
and opinion 
#cpc14
The UK population is growing… 
Population (millions) 
ONS (2014) Population and Health Reference Tables.
And ageing… 
ONS (2014) Estimates of the very old for the UK.
Life expectancy has increased 
ONS (2011). Statistical Bulletin. Mortality assumptions: national population projections
Life expectancy has increased 
• Increased healthcare resources 
• New medical technologies 
• Changes in health behaviours 
ONS (2011). Statistical Bulletin. Mortality assumptions: national population projections
But there is huge uncertainty about the size 
and needs of the future population 
ONS (2011). Statistical Bulletin. Mortality assumptions: national population projections
Health behaviours are changing rapidly.
Rates of having ever smoked, 11-15 year 
olds 
% 
Survey of Smoking, Drinking and Drug Use among School Pupils. (2014). 11-15 year olds.
Now, most 11-15 year olds have never drunk 
alcohol 
% 
Survey of Smoking, Drinking and Drug Use among School Pupils. (2014). 11-15 year olds.
Among 15 year olds - rates of drinking in the 
last week have halved in a decade 
% 
Survey of Smoking, Drinking and Drug Use among School Pupils. (2014). 15 year olds.
Proportion of school pupils who have taken 
drugs 
Survey of Smoking, Drinking and Drug Use among School Pupils. (2014). 11-15 year olds.
Obesity and overweight in children 
stabilising? 
Health Survey for England. (2013). 2-15 year olds.
Implications for the NHS of public health 
trends.
People agree: ‘it’s government’s responsibility 
to provide healthcare for the sick’ 
Probably not Definitely not 
British Social Attitudes (BSA), 2012, NatCen.
A minority support non-NHS organisations 
running NHS hospitals 
% 
British Social Attitudes (BSA), 2007, 2012, 2013, NatCen.
Consistently high support for universal NHS 
pMarkoe vNHisSi aovnailable only to those on lower incomes… 
British Social Attitudes (BSA), 1983-2013, NatCen. 
Oppose targeting 
%
Half say government should pay for all social 
care 
Who should pay for social care ... 
% 
British Social Attitudes (BSA), 2012, NatCen.
Public divided on whether they think the 
NHS will remain universal 
In ten years time, do you think the NHS will still be paid for by taxes and free to all? 
British Social Attitudes (BSA), 2013, NatCen.
Minority expect NHS standards of care to 
improve Thinking about the general standard of care on the NHS, over the next five years do 
you expect this ... 
% 
British Social Attitudes (BSA), NatCen, 2013
Satisfaction with the NHS overall is at it’s 
third highest since the eighties 
Quite/very satisfied 
Quite/very dissatisfied 
% 
British Social Attitudes (BSA), 1983-2013, NatCen.
With support for GPs being highest of all 
%
Satisfaction with the NHS is far higher than 
that with LA provided social care 
Quite or very satisfied with ... 
% 
British Social Attitudes (BSA), 2013, NatCen.
Health is the public’s top priority for extra 
spending 
Top priorities for government spending... 
British Social Attitudes (BSA), 2013, NatCen.
And has remained the priority for decades 
Top four priorities for government spending... 
Health 
%
While support for increased tax and spend has 
declined, it still outstrips calls for cuts 
British Social Attitudes (BSA), 1983-2013, NatCen.
Trends in public opinion: 
the great majority of people in Britain… 
• Highly value the NHS 
• Want it to remain tax-funded 
• Consistently rate it their top spending priority.
Thank you 
For further information 
Sally McManus 
Research Director, Health Policy Research Team 
sally.mcmanus@natcen.ac.uk
Challenges for the NHS

Challenges for the NHS

  • 2.
    Implications for theNHS: trends in public health and opinion #cpc14
  • 3.
    The UK populationis growing… Population (millions) ONS (2014) Population and Health Reference Tables.
  • 4.
    And ageing… ONS(2014) Estimates of the very old for the UK.
  • 5.
    Life expectancy hasincreased ONS (2011). Statistical Bulletin. Mortality assumptions: national population projections
  • 6.
    Life expectancy hasincreased • Increased healthcare resources • New medical technologies • Changes in health behaviours ONS (2011). Statistical Bulletin. Mortality assumptions: national population projections
  • 7.
    But there ishuge uncertainty about the size and needs of the future population ONS (2011). Statistical Bulletin. Mortality assumptions: national population projections
  • 8.
    Health behaviours arechanging rapidly.
  • 9.
    Rates of havingever smoked, 11-15 year olds % Survey of Smoking, Drinking and Drug Use among School Pupils. (2014). 11-15 year olds.
  • 10.
    Now, most 11-15year olds have never drunk alcohol % Survey of Smoking, Drinking and Drug Use among School Pupils. (2014). 11-15 year olds.
  • 11.
    Among 15 yearolds - rates of drinking in the last week have halved in a decade % Survey of Smoking, Drinking and Drug Use among School Pupils. (2014). 15 year olds.
  • 12.
    Proportion of schoolpupils who have taken drugs Survey of Smoking, Drinking and Drug Use among School Pupils. (2014). 11-15 year olds.
  • 13.
    Obesity and overweightin children stabilising? Health Survey for England. (2013). 2-15 year olds.
  • 14.
    Implications for theNHS of public health trends.
  • 15.
    People agree: ‘it’sgovernment’s responsibility to provide healthcare for the sick’ Probably not Definitely not British Social Attitudes (BSA), 2012, NatCen.
  • 16.
    A minority supportnon-NHS organisations running NHS hospitals % British Social Attitudes (BSA), 2007, 2012, 2013, NatCen.
  • 17.
    Consistently high supportfor universal NHS pMarkoe vNHisSi aovnailable only to those on lower incomes… British Social Attitudes (BSA), 1983-2013, NatCen. Oppose targeting %
  • 18.
    Half say governmentshould pay for all social care Who should pay for social care ... % British Social Attitudes (BSA), 2012, NatCen.
  • 19.
    Public divided onwhether they think the NHS will remain universal In ten years time, do you think the NHS will still be paid for by taxes and free to all? British Social Attitudes (BSA), 2013, NatCen.
  • 20.
    Minority expect NHSstandards of care to improve Thinking about the general standard of care on the NHS, over the next five years do you expect this ... % British Social Attitudes (BSA), NatCen, 2013
  • 21.
    Satisfaction with theNHS overall is at it’s third highest since the eighties Quite/very satisfied Quite/very dissatisfied % British Social Attitudes (BSA), 1983-2013, NatCen.
  • 22.
    With support forGPs being highest of all %
  • 23.
    Satisfaction with theNHS is far higher than that with LA provided social care Quite or very satisfied with ... % British Social Attitudes (BSA), 2013, NatCen.
  • 24.
    Health is thepublic’s top priority for extra spending Top priorities for government spending... British Social Attitudes (BSA), 2013, NatCen.
  • 25.
    And has remainedthe priority for decades Top four priorities for government spending... Health %
  • 26.
    While support forincreased tax and spend has declined, it still outstrips calls for cuts British Social Attitudes (BSA), 1983-2013, NatCen.
  • 27.
    Trends in publicopinion: the great majority of people in Britain… • Highly value the NHS • Want it to remain tax-funded • Consistently rate it their top spending priority.
  • 28.
    Thank you Forfurther information Sally McManus Research Director, Health Policy Research Team sally.mcmanus@natcen.ac.uk

Editor's Notes

  • #3 Recent population trends in – in demography, public health, and opinion – have huge ramifications for demand for future NHS services. I’m going to present some evidence – mostly drawn from key national health and opinion surveys– on trends since the early eighties - to provide context for our discussion about the future funding gap for the NHS. I want to highlight that our plans for the NHS need to take account of these trends as well as allow for uncertainty in future projections
  • #4 This is a familiar picture - over the past three decades our population has been growing. Since 1964 the population of the UK has grown by over 10 million people (18.7%).  About half of this growth has occurred since 2001. Over the earlier part of this period population change was driven mainly by variation in the number of births.  Population grew throughout the 1960s up until the early 1970s mainly as a result of the 1960s baby boom; while over the rest of the 1970s growth was subdued, reflecting falling fertility.  The very large birth cohort of 1960s baby boomers beginning to have children saw births, and hence the population, grow again in the 1980s, but births declined again through the 1990s. A time series of UK births and deaths data on a calendar year basis is available in the Population and Health Reference Tables published by ONS. Since 2001 there have been high levels of net inward migration, adding to the population at younger working ages. In part this was driven by the expansion of the European Union in 2004 and 2007.  This period has also seen an increasing number of births, driven by both the immigration of women of childbearing age (15-44) and rising fertility among UK-born women.  More detail on births and fertility is available in the Births in England and Wales, 2012 release published by ONS, the Vital Events Births Reference Tables published by NRS and the Births statistics published by NISRA.
  • #5 And the rate of growth is fastest among older age groups. This chart shows the near tripling in the proportion of the population aged 90 and over since 1983.
  • #6 ONE of the reasons for this population aging is that we’re increasingly living longer. A boy born now is expected – on average – to live about 9 years longer than one born at the start of the eighties. But look at the uncertainty in these projections. Demographers – historically – keep getting these projects not only inaccurate- but way out. Wrong! And always in the same direction. We underestimate deaths.
  • #7 And this has been driven by a wide range of factors, like… But look at the uncertainty in these projections. Demographers – historically – keep getting these projects not only inaccurate- but way out. Wrong! And always in the same direction. We underestimate deaths.
  • #8 BUT – look at the enormous variation there is in future projections! We don’t know whether a boy born in fifty years time may expect to live to be eighty or into his mid-nineties. This is a big problem for planners and for anctipating future need There is a range of uncertainty about projecting population, as it rests on assumptions about future demographic behaviour.  The recent rise in UK fertility could be maintained, perhaps because of the influence of high levels of net migration; life expectancy might stagnate because of increasing obesity levels; net migration may fall back to levels more typical of the UK’s history if economic conditions change or more restrictive policies are introduced.  Population projections have a mixed record.  They do, however, provide a common basis of framework for planning the future across the range of public policy areas. Demographers – historically – keep getting these projects not only inaccurate- but way out. Wrong! And always in the same direction. We underestimate deaths.
  • #9 One reason why demographers tend to get projections wrong – and usually underestimate deaths – is that public health behaviours can change rapidly. Trends in public health are changing rapidly – and not always in the way we suspect In anticipating future NHS need – we need to check back to recent findings from our national health surveys. For example -
  • #10 For example - Smoking – one of our biggest killers – and disablers – Rates have plummeted since the early 1980s - We have the prospect of ushering in a smokeless generation!
  • #11 Most school
  • #12 Smoking – one of our biggest killers – and disablers – We have the prospect of ushering in a smokeless generation!
  • #13 Smoking – one of our biggest killers – and disablers – We have the prospect of ushering in a smokeless generation!
  • #14 Smoking – one of our biggest killers – and disablers – We have the prospect of ushering in a smokeless generation!
  • #15 There are two key take-homes from the trends in public health: - In the long term – we can expect our very old population to continue to grow - In the short to medium term – we must pay the price for past health behaviours. Public health trends are long term – the alcohol related admissions and complications among adults now relate to practices in earlier decades. The government needs to accommodate unpredictable resource demands – we may have an even more older population than we’d previously thought Caution! Demographers tend to get such trends wrong… (Appleby)
  • #20 With nearly half suspecting that that universalism may end in the next decade.
  • #25 Health is the top priority for ‘extar’ spending