Download to read offline


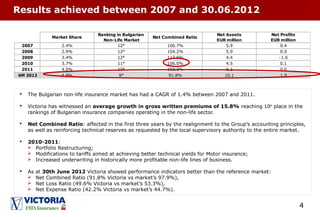
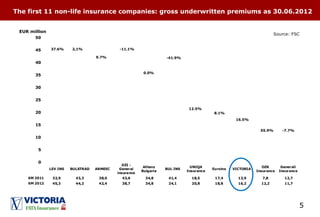
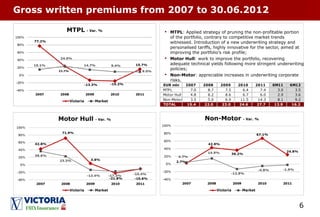
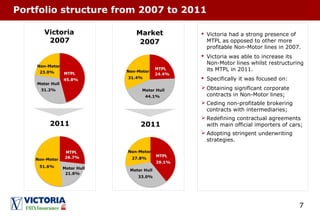
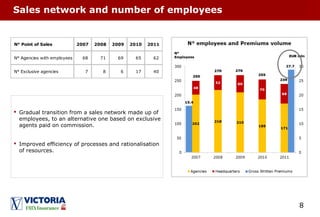
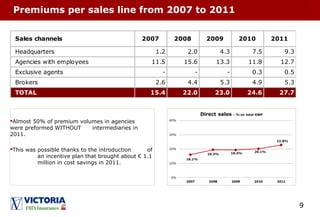
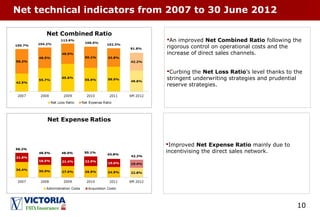
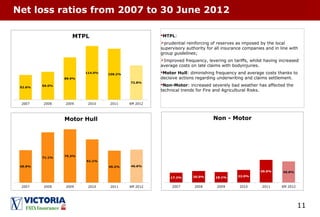
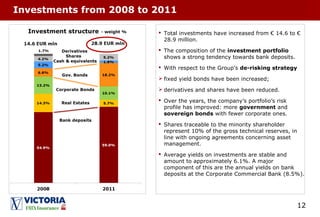
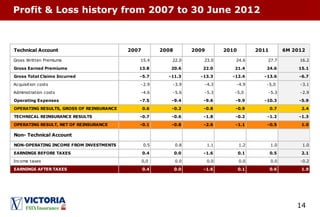


This document summarizes the financial performance of Victoria, a Bulgarian insurance subsidiary, between 2007-2012. Key points include: - Gross written premiums grew 15.8% annually on average, increasing Victoria's market share and ranking. - Net combined, loss, and expense ratios improved after portfolio restructuring in 2010-2011 toward more profitable lines. - Investments grew significantly and shifted toward lower risk assets like bonds per the parent company's strategy. - Net profits fluctuated but were positive in recent years, and forecasts predict over €2 million for full-year 2012.


![[ls머트리얼즈]LS Materials 417200 Algorithm Investment Report](https://cdn.slidesharecdn.com/ss_thumbnails/lsmaterials417200algorithminvestmentreport-260202182715-66072c7b-thumbnail.jpg?width=640&height=640&fit=bounds)


