This document is a research project submitted in partial fulfillment of a diploma in purchasing and supply chain management from the University of Nairobi. It examines the impact of e-procurement on supply chain performance in Kenyan state corporations. The introduction provides background on supply chain management and notes that while e-procurement can improve responsiveness and cut costs, implementation in Kenya has been slow. The research aims to determine the effect of various dimensions of e-procurement, including e-tendering, e-sourcing, e-ordering and e-informing, on supply chain performance. The study is informed by transaction cost theory and the diffusion of innovations theory. It uses a quantitative research design and collects primary data using questionnaires administered to


![73
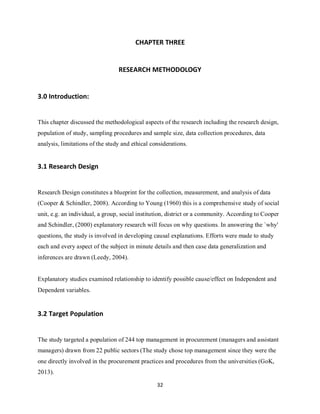
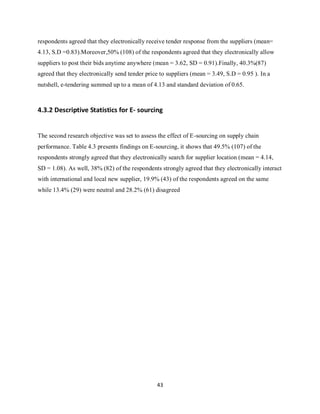
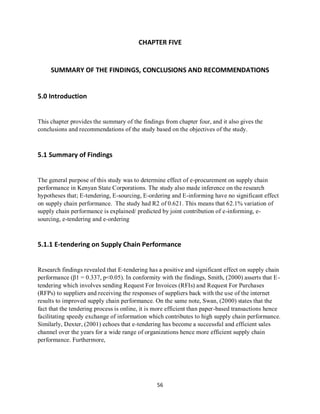
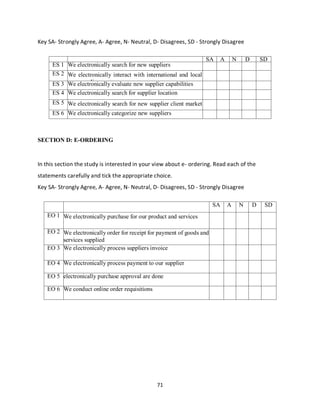
SECTION F: DEMOGRAPHIC INFORMATION
In this section the study would like you to provide some background information about
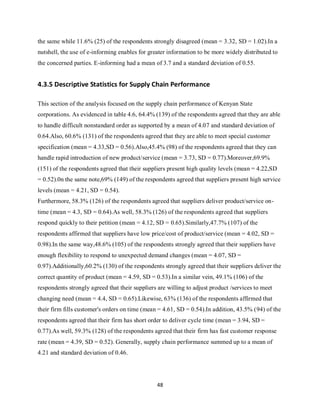
yourself.
Kindly tick (V) appropriately.]
1. What is your gender?
Male [ ]
Female [ ]
2. What is your age bracket?
18-30 years [ ]
31-35 years [ ]
36-40 years [ ]
41-45 years over 46 years [ ]
3. What is your education level?
PHD [ ]
Masters [ ]
Bachelors [ ]
Diploma [ ]
Certificate [ ]
4. How long have you been working in this organization?
Less than 3 years [ ]
Between 4-6 years [ ]
Between 7-9 [ ]
10years and above [ ]
5. Have you ever attended ' any training on information technology related to e-procurement?
Yes [ ]
No [ ]
If yes, how relevant is it in the supply chain performance?
kipkulei](https://image.slidesharecdn.com/44604954-7bbd-4c1b-8672-6b167a2c299e-161119171937/85/Victor-Kipkulei-73-320.jpg)