
Recommended
More Related Content
What's hot
What's hot (20)
Vico Office - 5D BIM
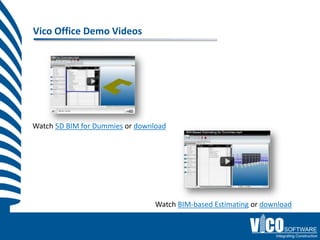
- 1. Vico Office Demo Videos Watch 5D BIM for Dummies or download Watch BIM-based Estimating or download
- 2. Clash, Quantity Cost Constructability Takeoff Planning RFI DEMO Location Flowline Cost Breakdown Planning & Exploring Structure Control 2D Docs 2D Takeoff Integrated Site Layout Cost Control Reporting 3D Model Comp Enterprise
- 3. Integrated Process Overview LBS Rebar Equipment Formwork Labor Concrete Column ‘Type 1’ Cladding; Surface Materials Finish TOIs TOQs Resources Takeoff Items Takeoff Quantities $/Qty $/Qty $/Qty Design Cost Time
- 4. Vico Office - Workflow
- 7. Activate and Manage Model Versions
- 9. Constructability Analysis + Tracking
- 11. 'Construction Caliber' Take Off Quantities (TOQs)
- 13. Cost Planner – Spreadsheet + Formula Editor
- 14. Cost Planning (n-tiered 'Evolutionary') Database power Spreadsheet flexibility
- 15. Evolutionary Estimating $/ $/ Target $ $ / SF $ / SYS $ / Unit Element Activity
- 16. Explore and Compare Versions
- 17. Define Locations to virtually split elements
- 18. Flowline Intro Calendar Locations Tasks
- 19. Flowline Optimization Take these three tasks… 1. Show in Flowline 2. Optimize production rates 3. Compress project duration -10 to 20% without increasing risk Duration B Duration A
- 20. Location Based Management System Task durations calculated with explicit assumptions recorded Highlight planned work locations and wasted opportunities Identify bottle necks, inefficiencies, stops and starts 2010 Building Floor January February Calendar March April 4 11 18 25 1 8 15 22 1 8 15 22 29 5 12 19 3rd B 2nd Waste Locationsst 1 3rd Start & Stops A 2nd Waste 1st
- 21. Flowline Schedule Planning Optimized for continuous labor flow Optimal resources + starts ensure continuous workflow Buffers protect against uncertainty in the field 2010 Building Floor January February March April 4 11 18 25 1 8 15 22 1 8 15 22 29 5 12 19 3rd B 2nd 1st 3rd A 2nd 1st
- 22. Flowline Schedule Planning Optimized for continuous labor flow Optimal resources + starts ensure continuous workflow Buffers protect against uncertainty in the field 2010 Building Floor January February March April 4 11 18 25 1 8 15 22 1 8 15 22 29 5 12 19 3rd B 2nd 1st 3rd A 2nd 1st
- 23. Production Control 3rd B 2nd Late start 45% 1st or Behind 323m2 3rd On-time 23% A 2nd or Behind 53No. Complete 1st Late Prime & Seal Dry Walling Frame Tiling
- 24. Forecasting Weekly Subcontractor Meetings Review Forecasts Adjust to Maintain Planned Schedule Report Date 2010 Building Floor January February March April 4 11 18 25 1 8 15 22 1 8 15 22 29 5 12 19 3rd Delay B 2nd 1st Task: Dry Walling 3rd Location Resource Number 3rd Crew 1 1 A 2nd B 2nd Crew 1 1 Behind 1st Crew 1 1 3rd Crew 1 1 1st A 2nd Crew 1 1 Late 1st Crew 1 1
- 25. Forecasting Weekly Subcontractor Meetings Review Forecasts Adjust to Maintain Planned Schedule Report Date 2010 Building Floor January February March April 4 11 18 25 1 8 15 22 1 8 15 22 29 5 12 19 3rd B 2nd 1st Task: Dry Walling 3rd Location Resource Number 3rd Crew 1 1 2 A 2nd B 2nd Crew 1 1 2 1st Crew 1 1 2 3rd Crew 1 1 2 1st A 2nd Crew 1 1 2 1st Crew 1 1
- 26. Custom Reports
- 27. Create + distribute reports for submission
Editor's Notes
- After the bid is wonComplete the model for use in project control and managementUpdate the estimate with more accurate subs pricesCompare against your bid ‘budget’
- SLIDE: 13 5D: Schedule (CONCEPT SLIDE): (Tim)
- SLIDE: 13 5D: Schedule (CONCEPT SLIDE): (Tim)
- SLIDE: 13 5D: Schedule (CONCEPT SLIDE): (Tim)
- SLIDE: 15 5D: Schedule (DETAIL SLIDE MSM MODEL): (Clay)MSM Model Example (Toggle Over) The result is that on the fly we are able to provide the team with specific SCHEDULE data that can be manipulated at a working team meeting to help inform critical project decisions. No need to wait for a monthly or weekly reportNo live document – a truly live 5 dimensional model that allows all parties the ability to:
- SLIDE: 15 5D: Schedule (DETAIL SLIDE MSM MODEL): (Clay)MSM Model Example (Toggle Over) The result is that on the fly we are able to provide the team with specific SCHEDULE data that can be manipulated at a working team meeting to help inform critical project decisions. No need to wait for a monthly or weekly reportNo live document – a truly live 5 dimensional model that allows all parties the ability to: