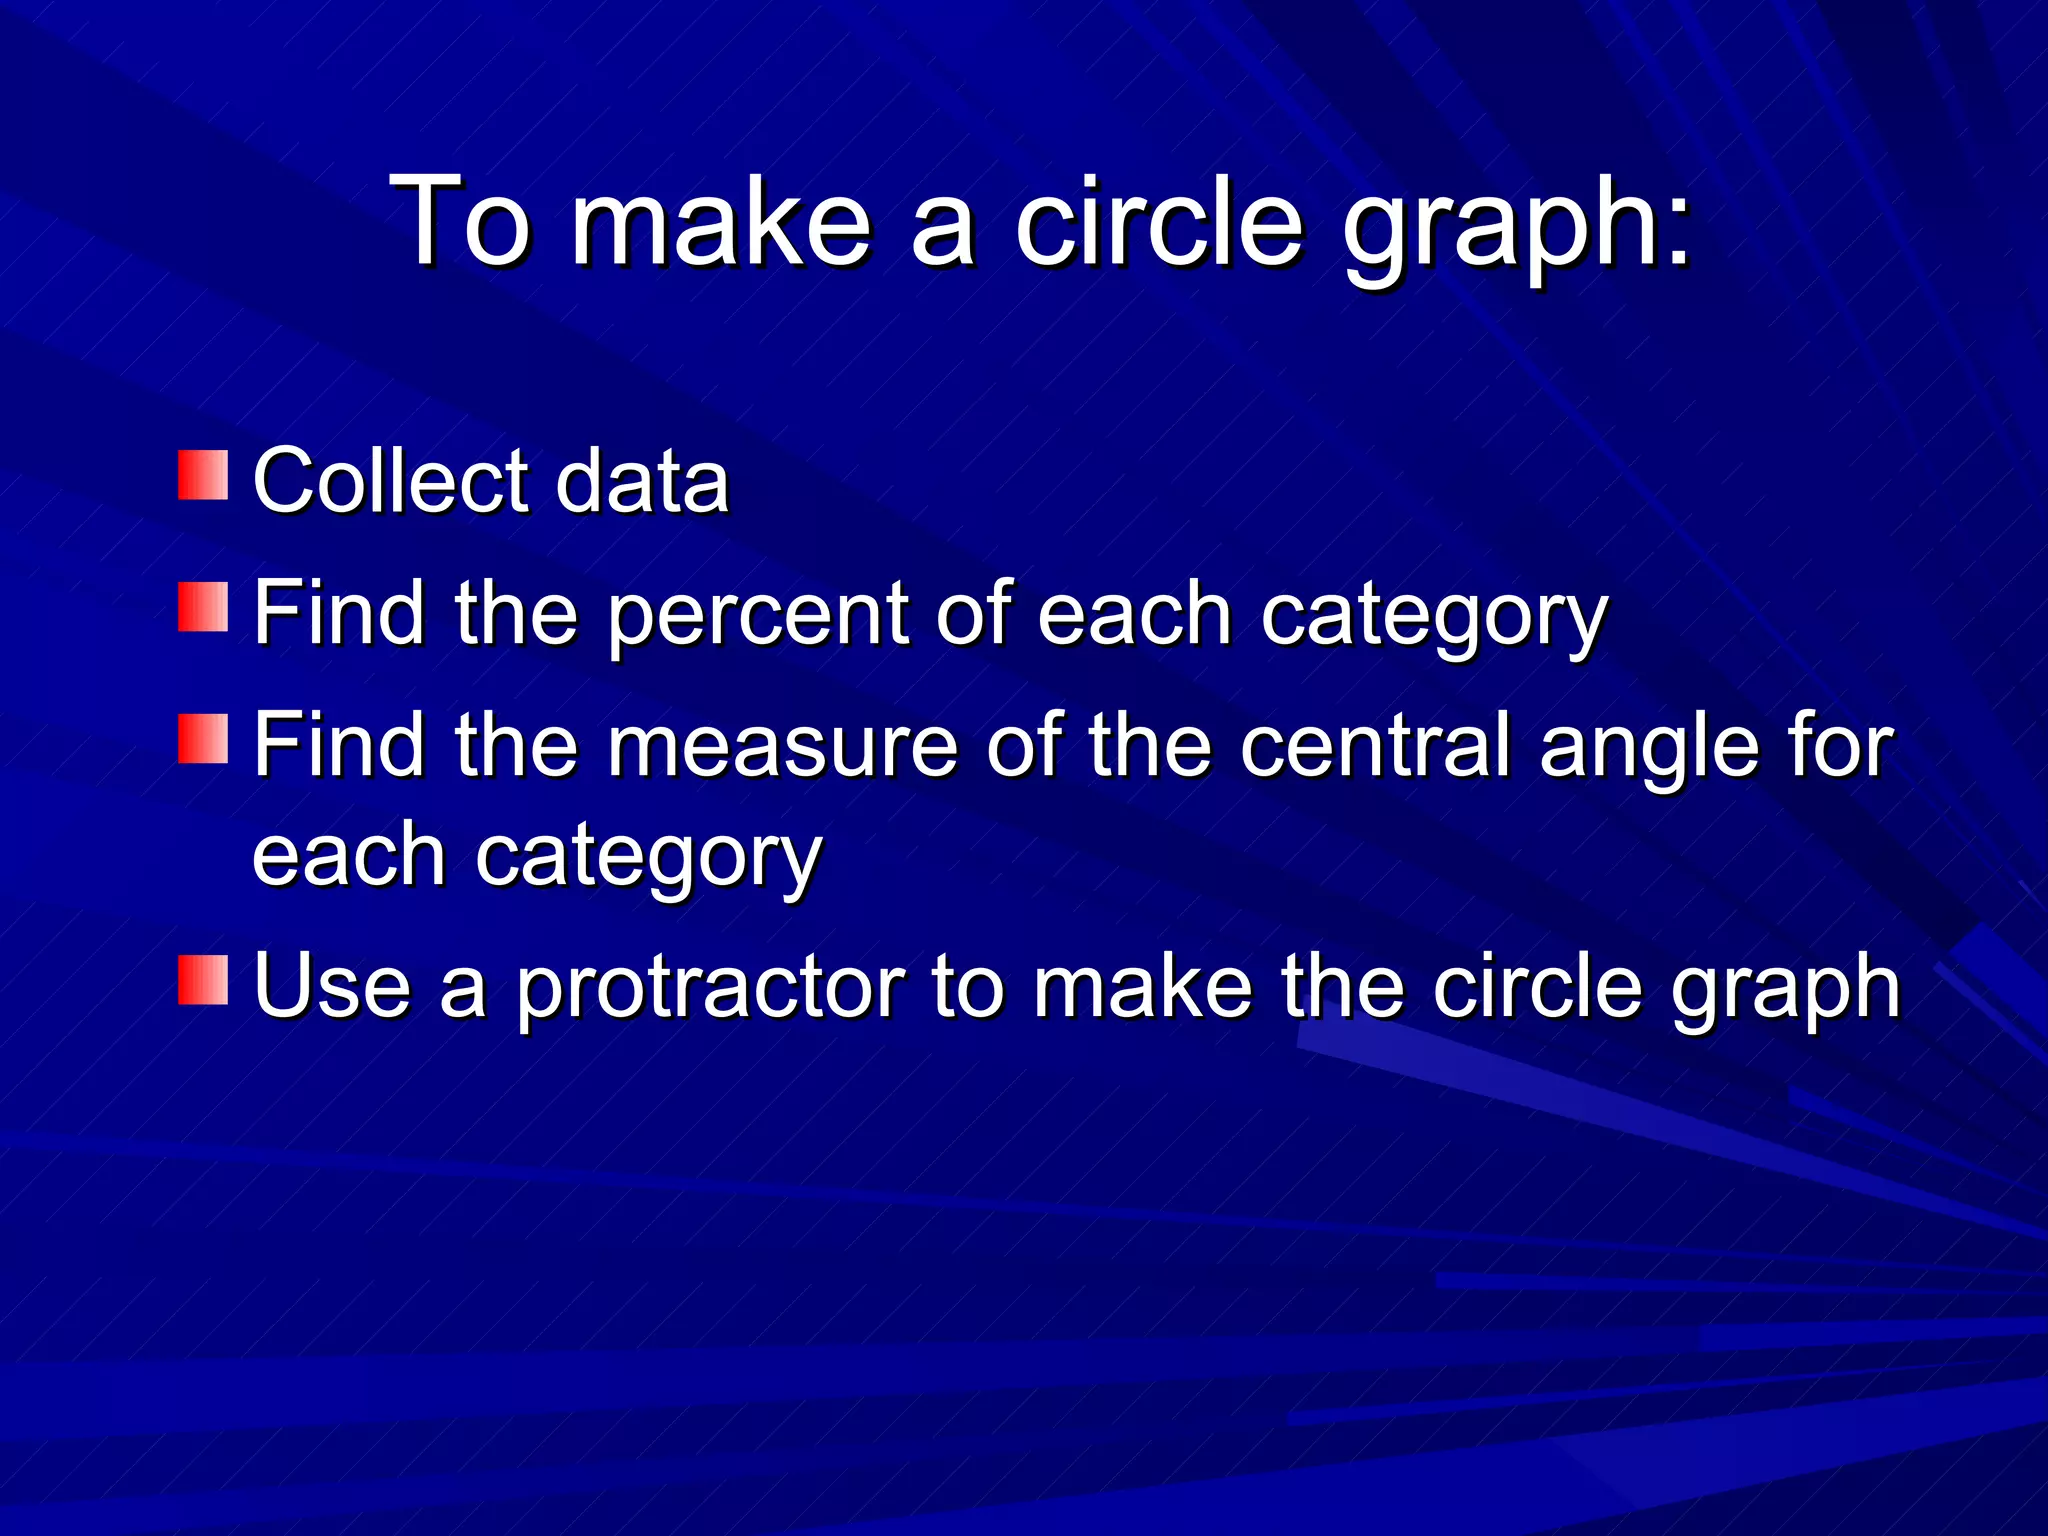
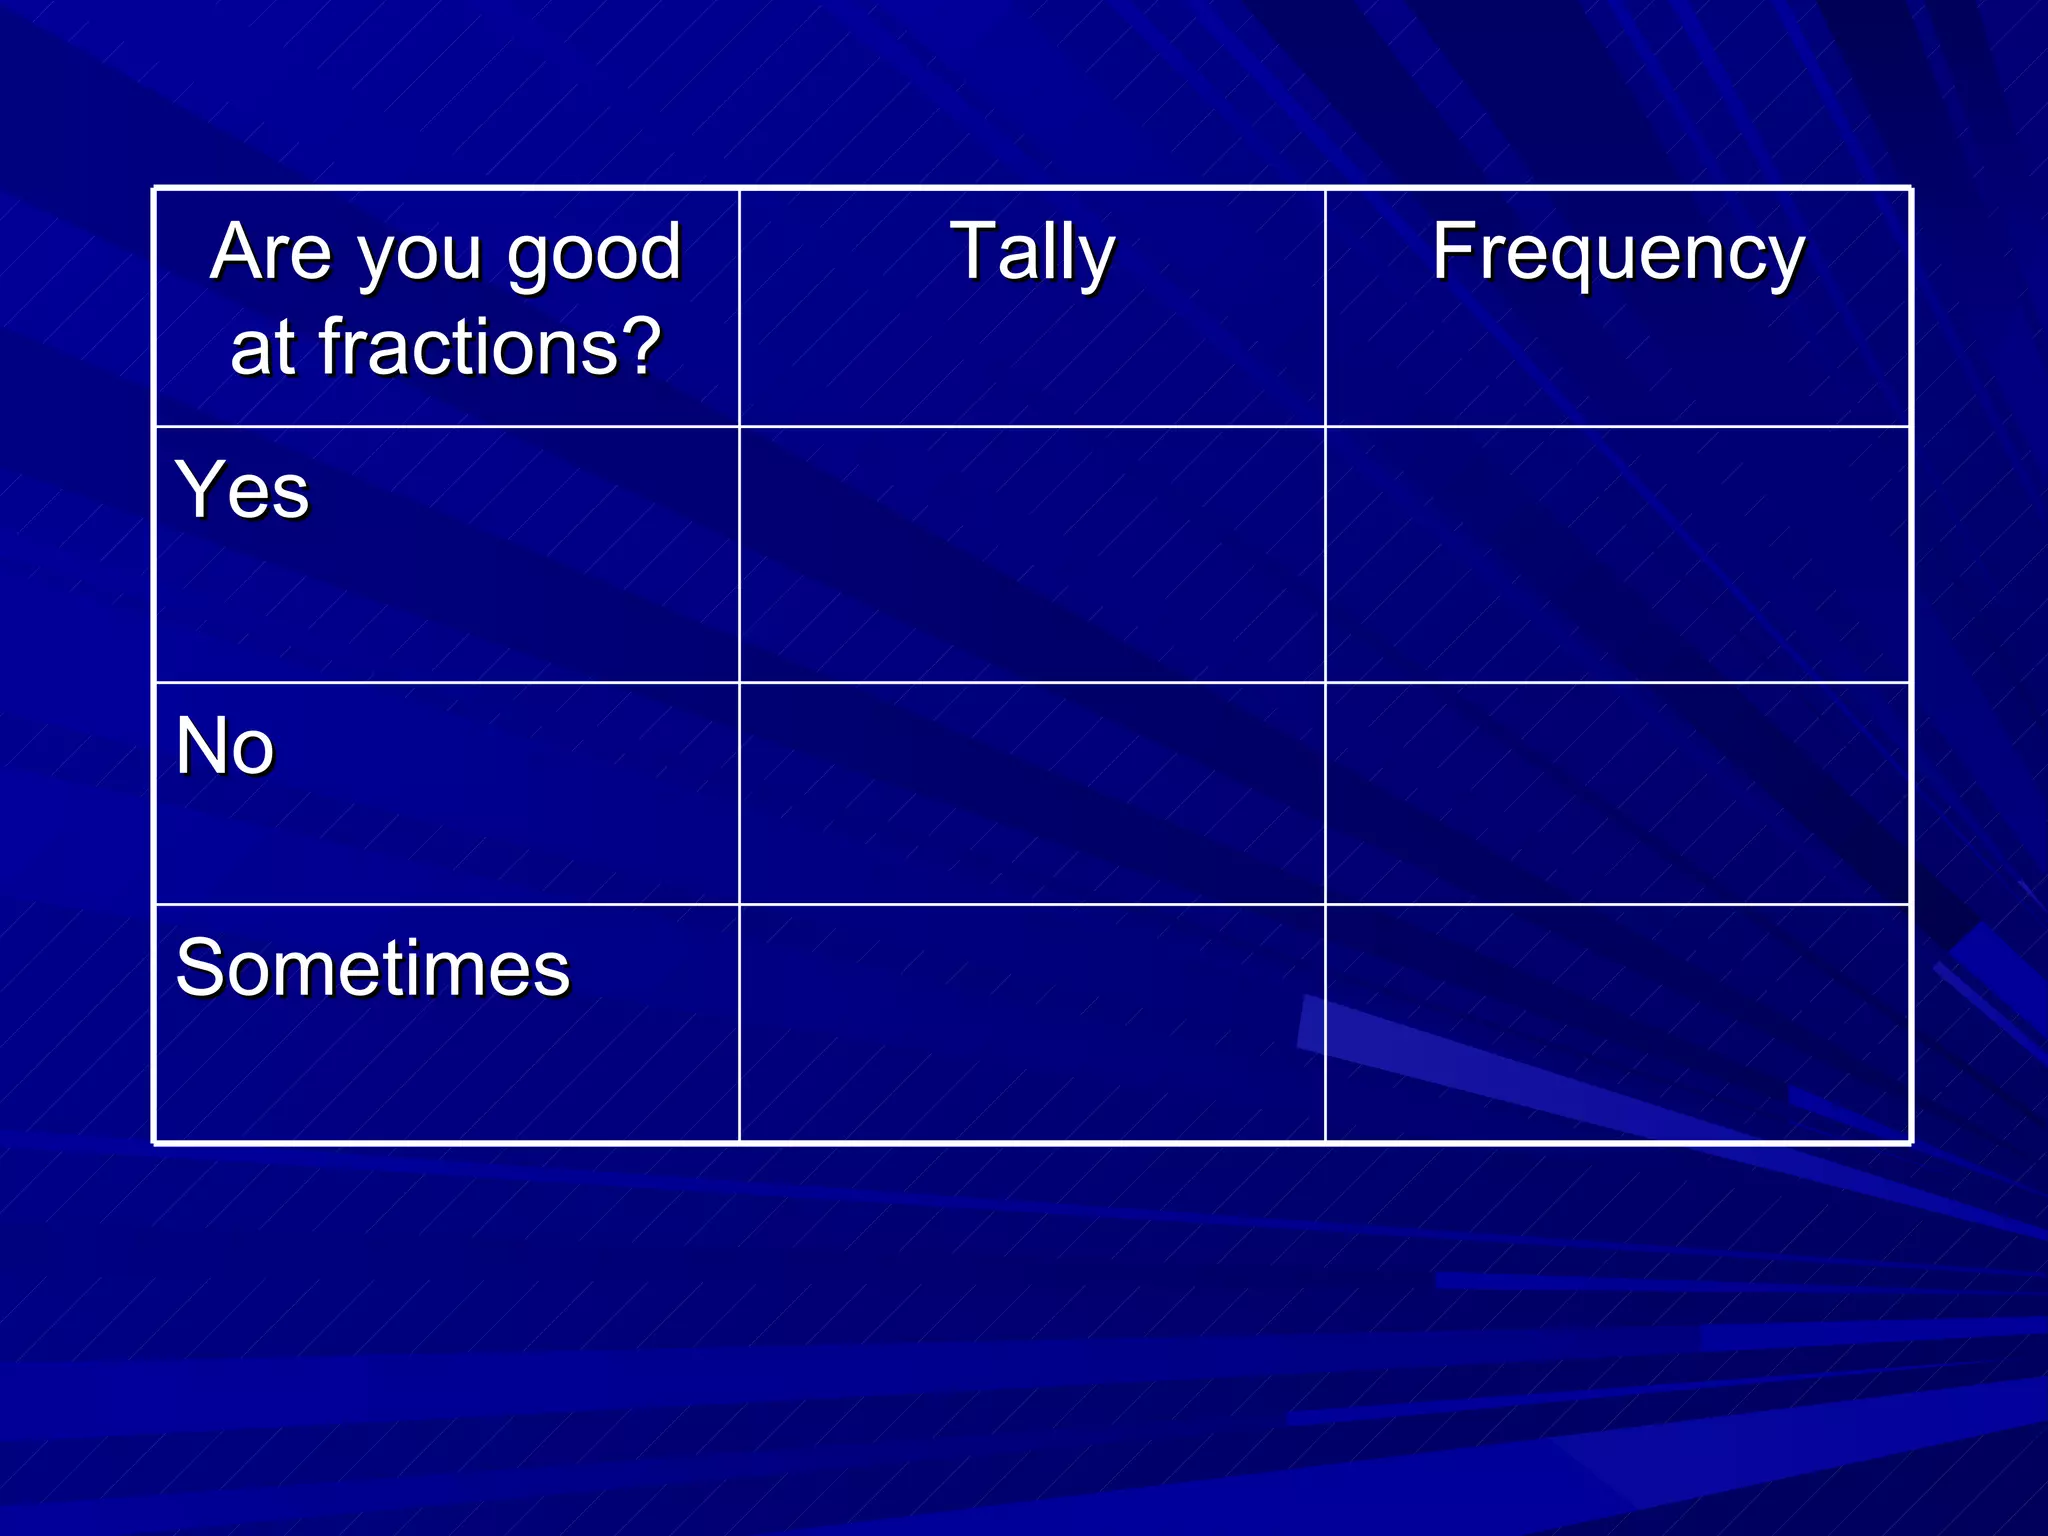
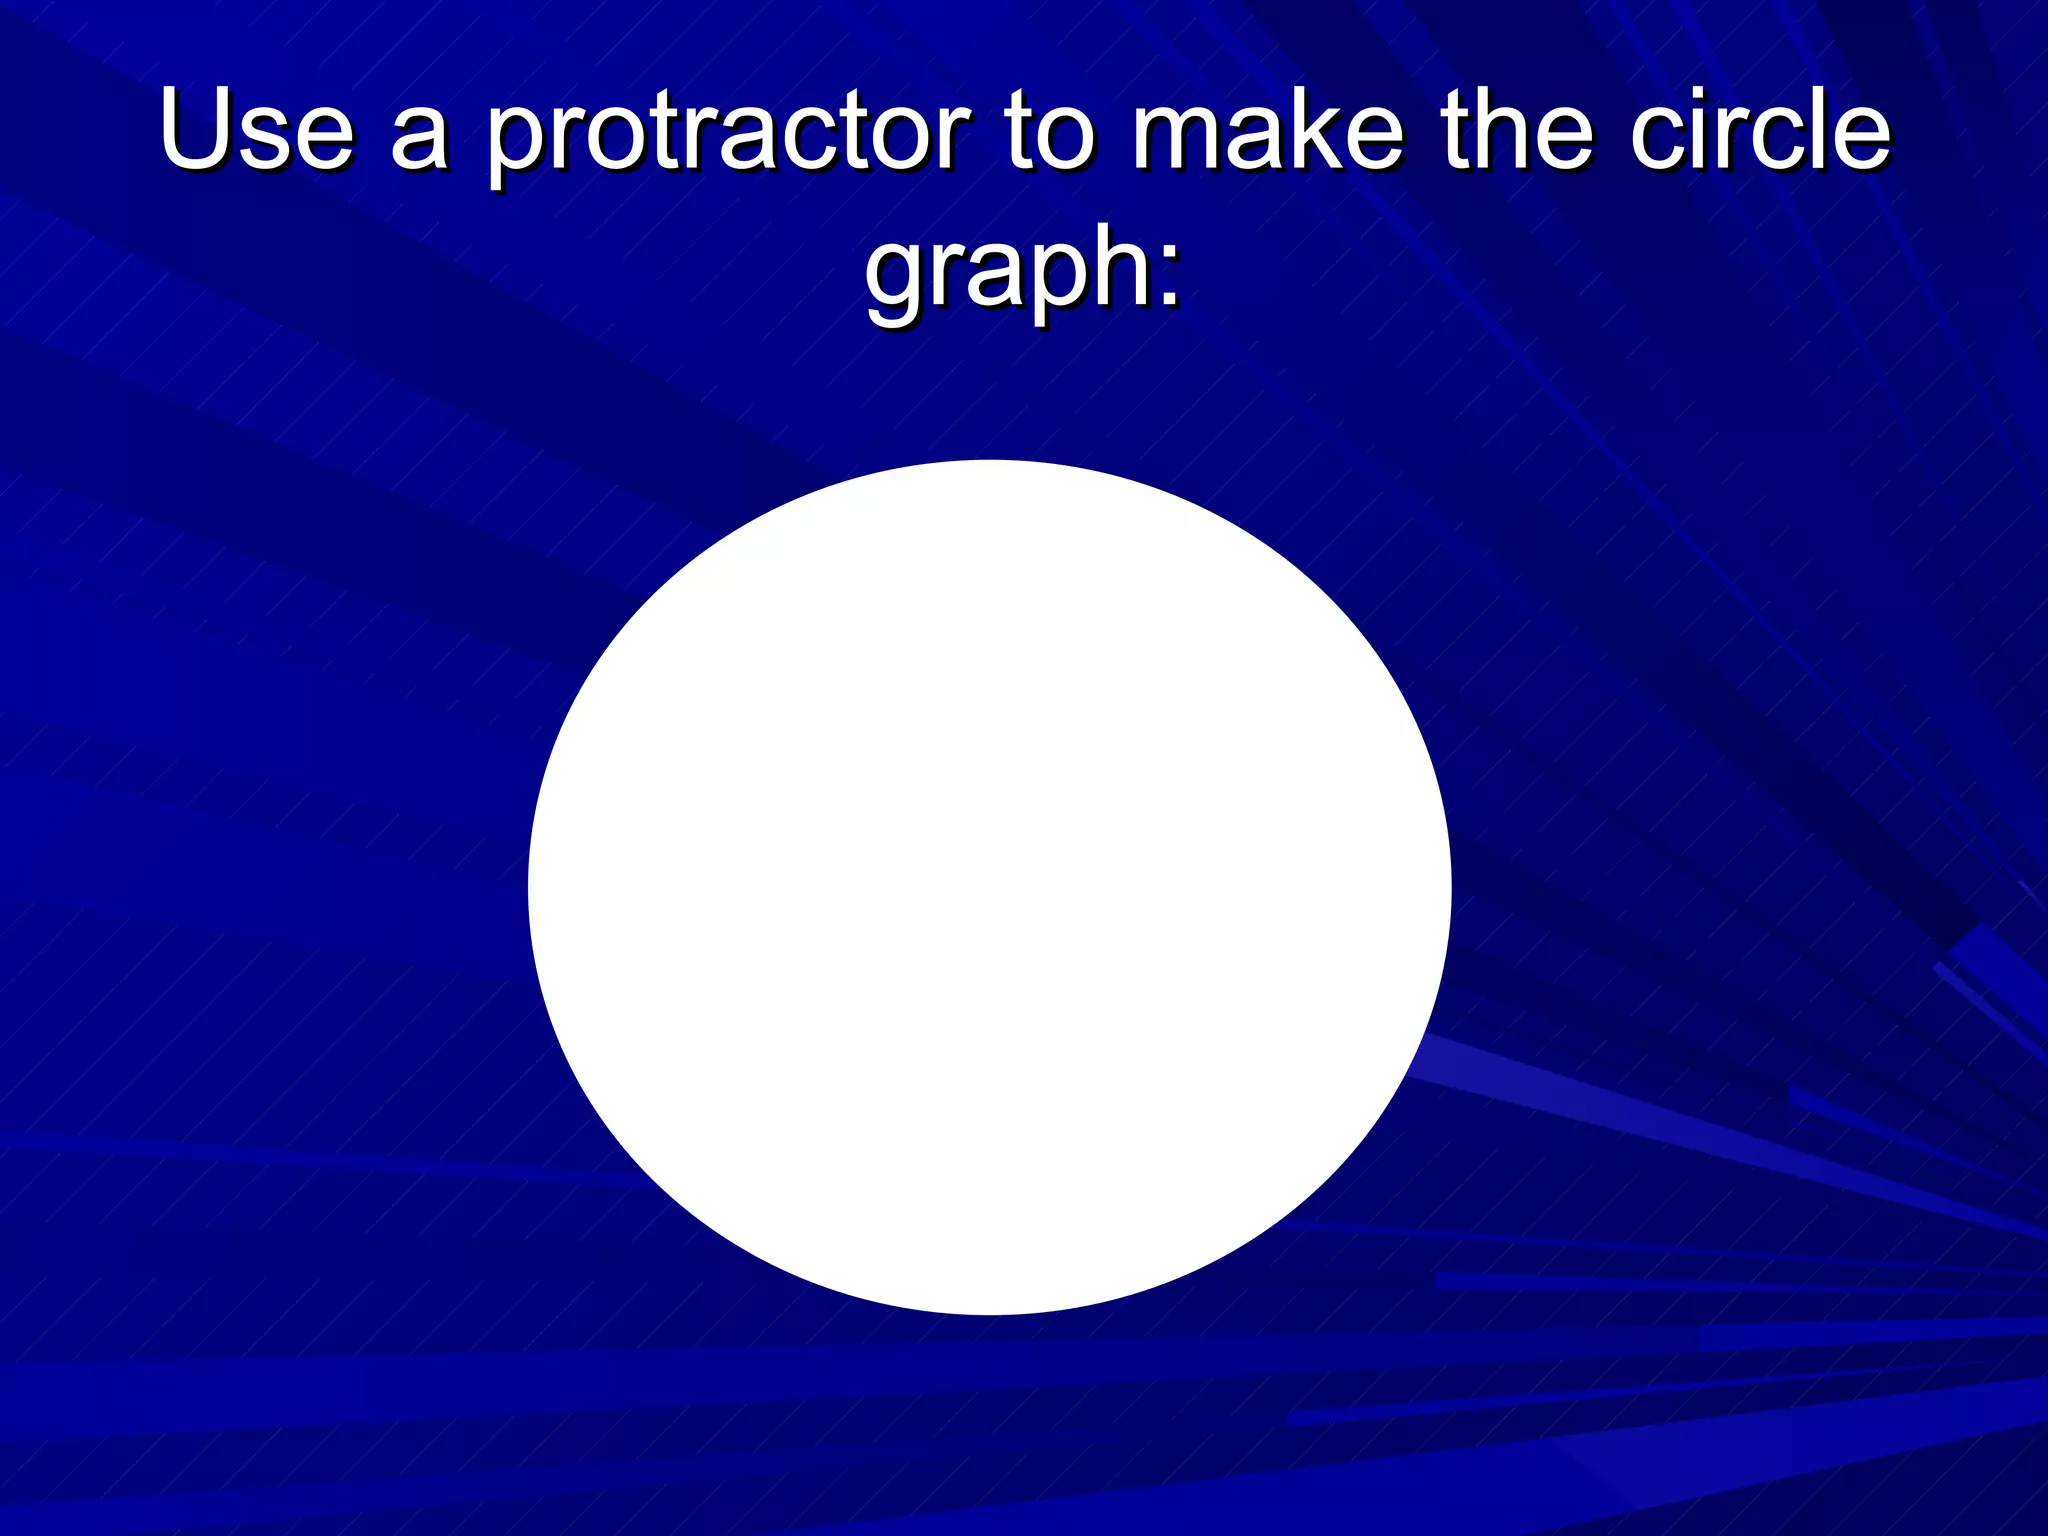
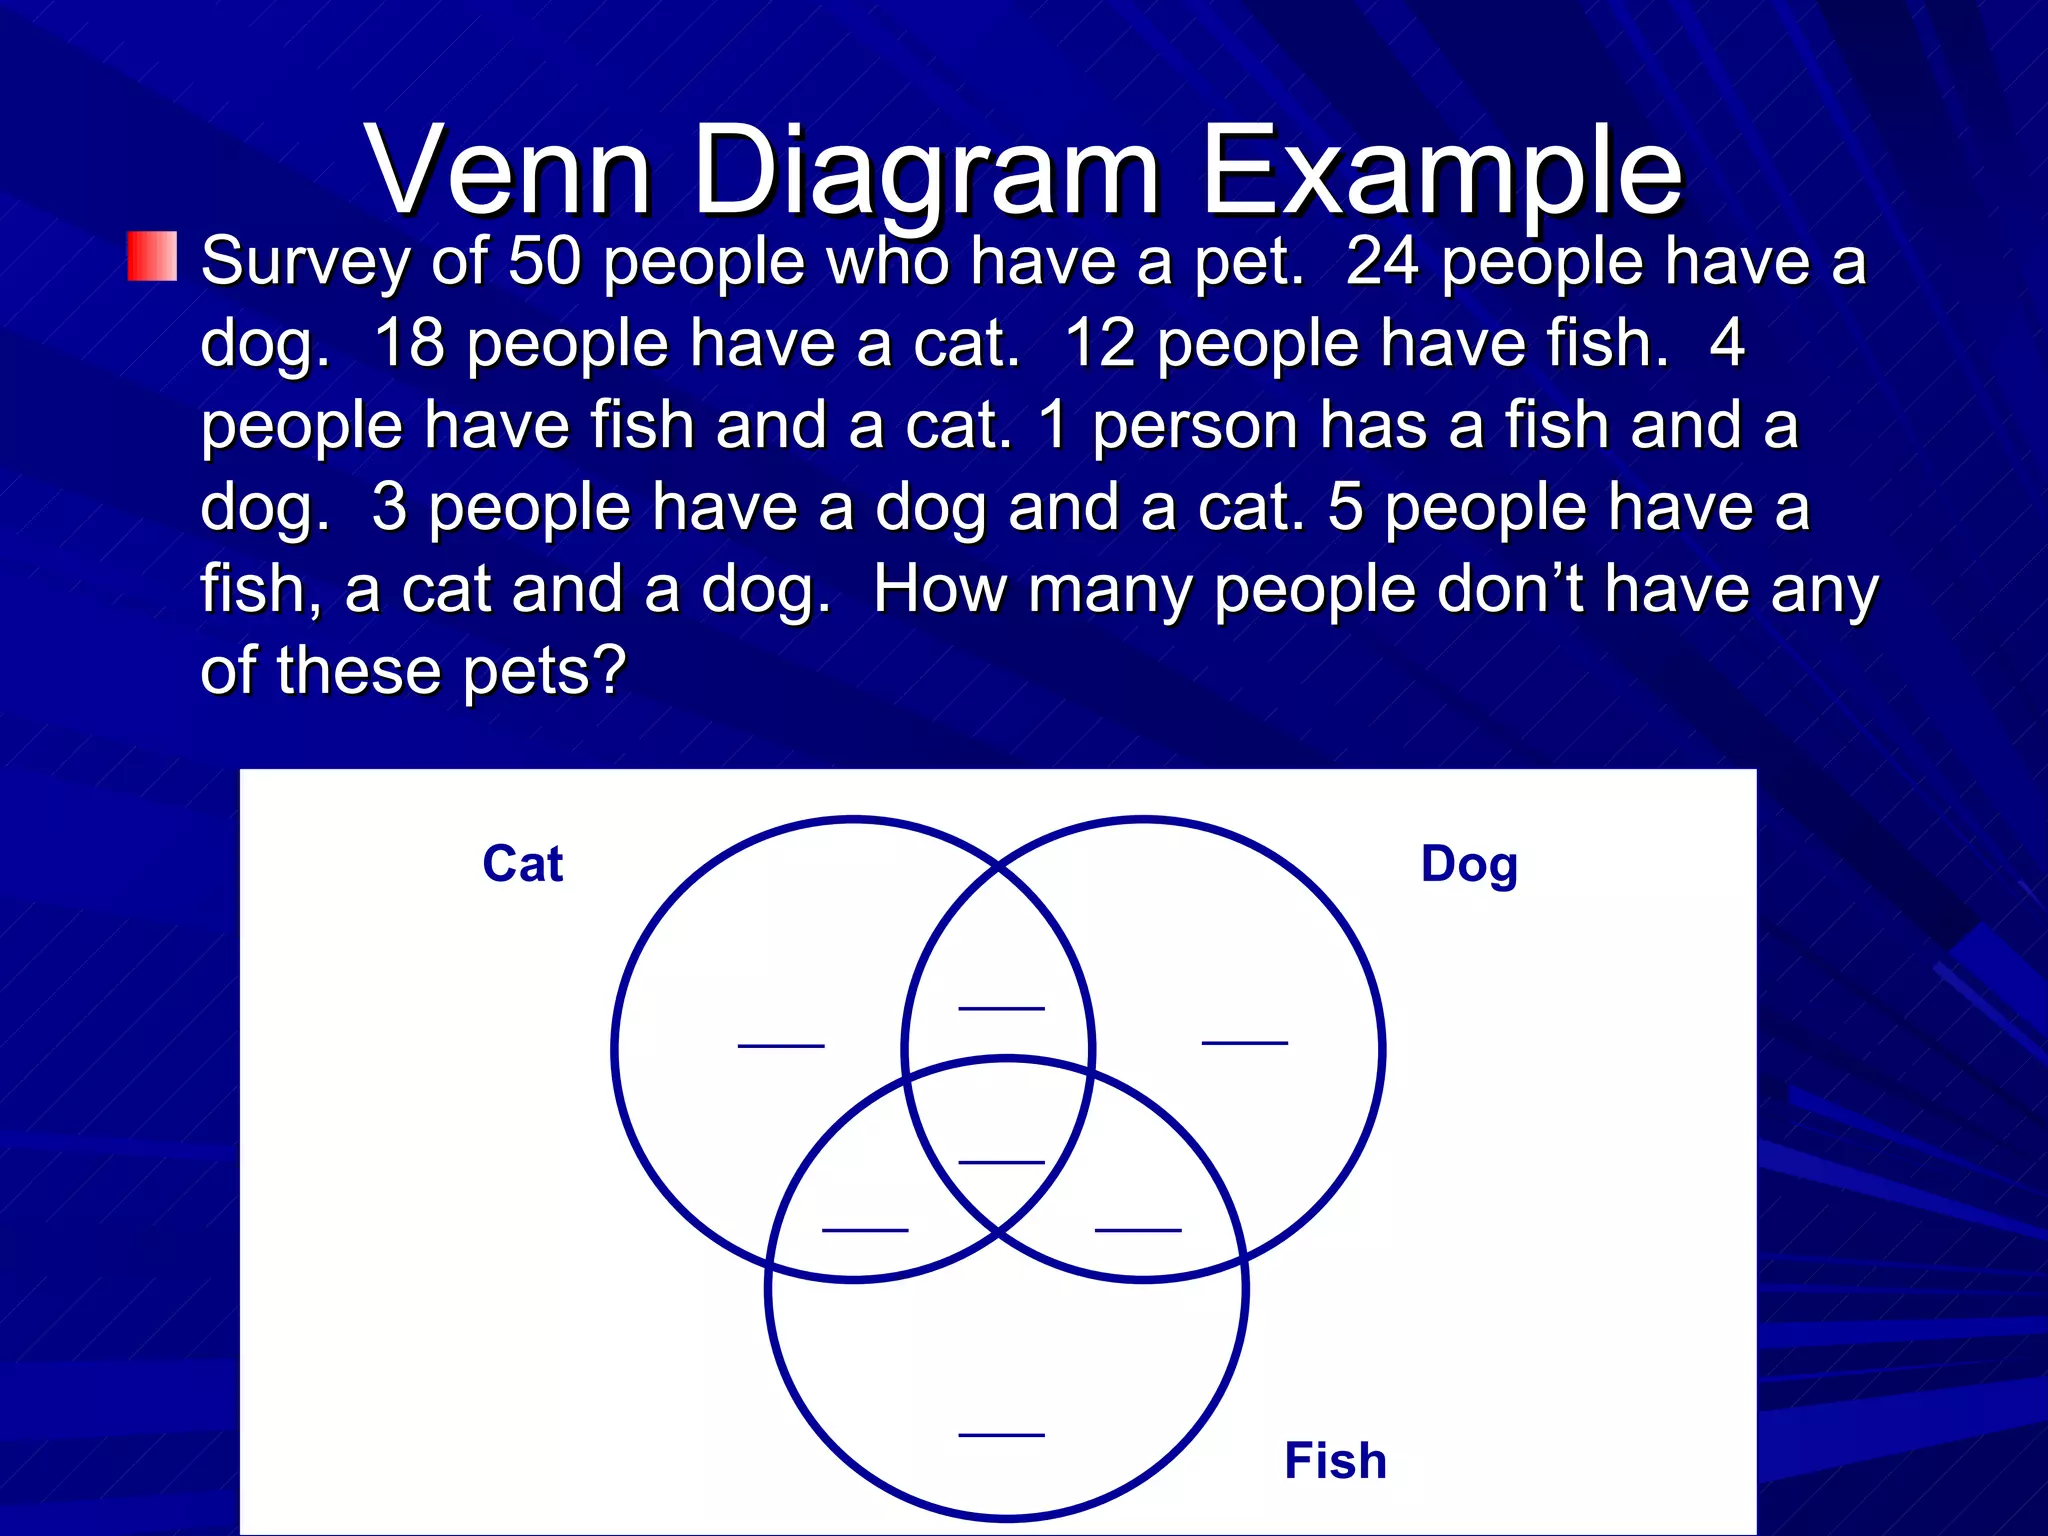
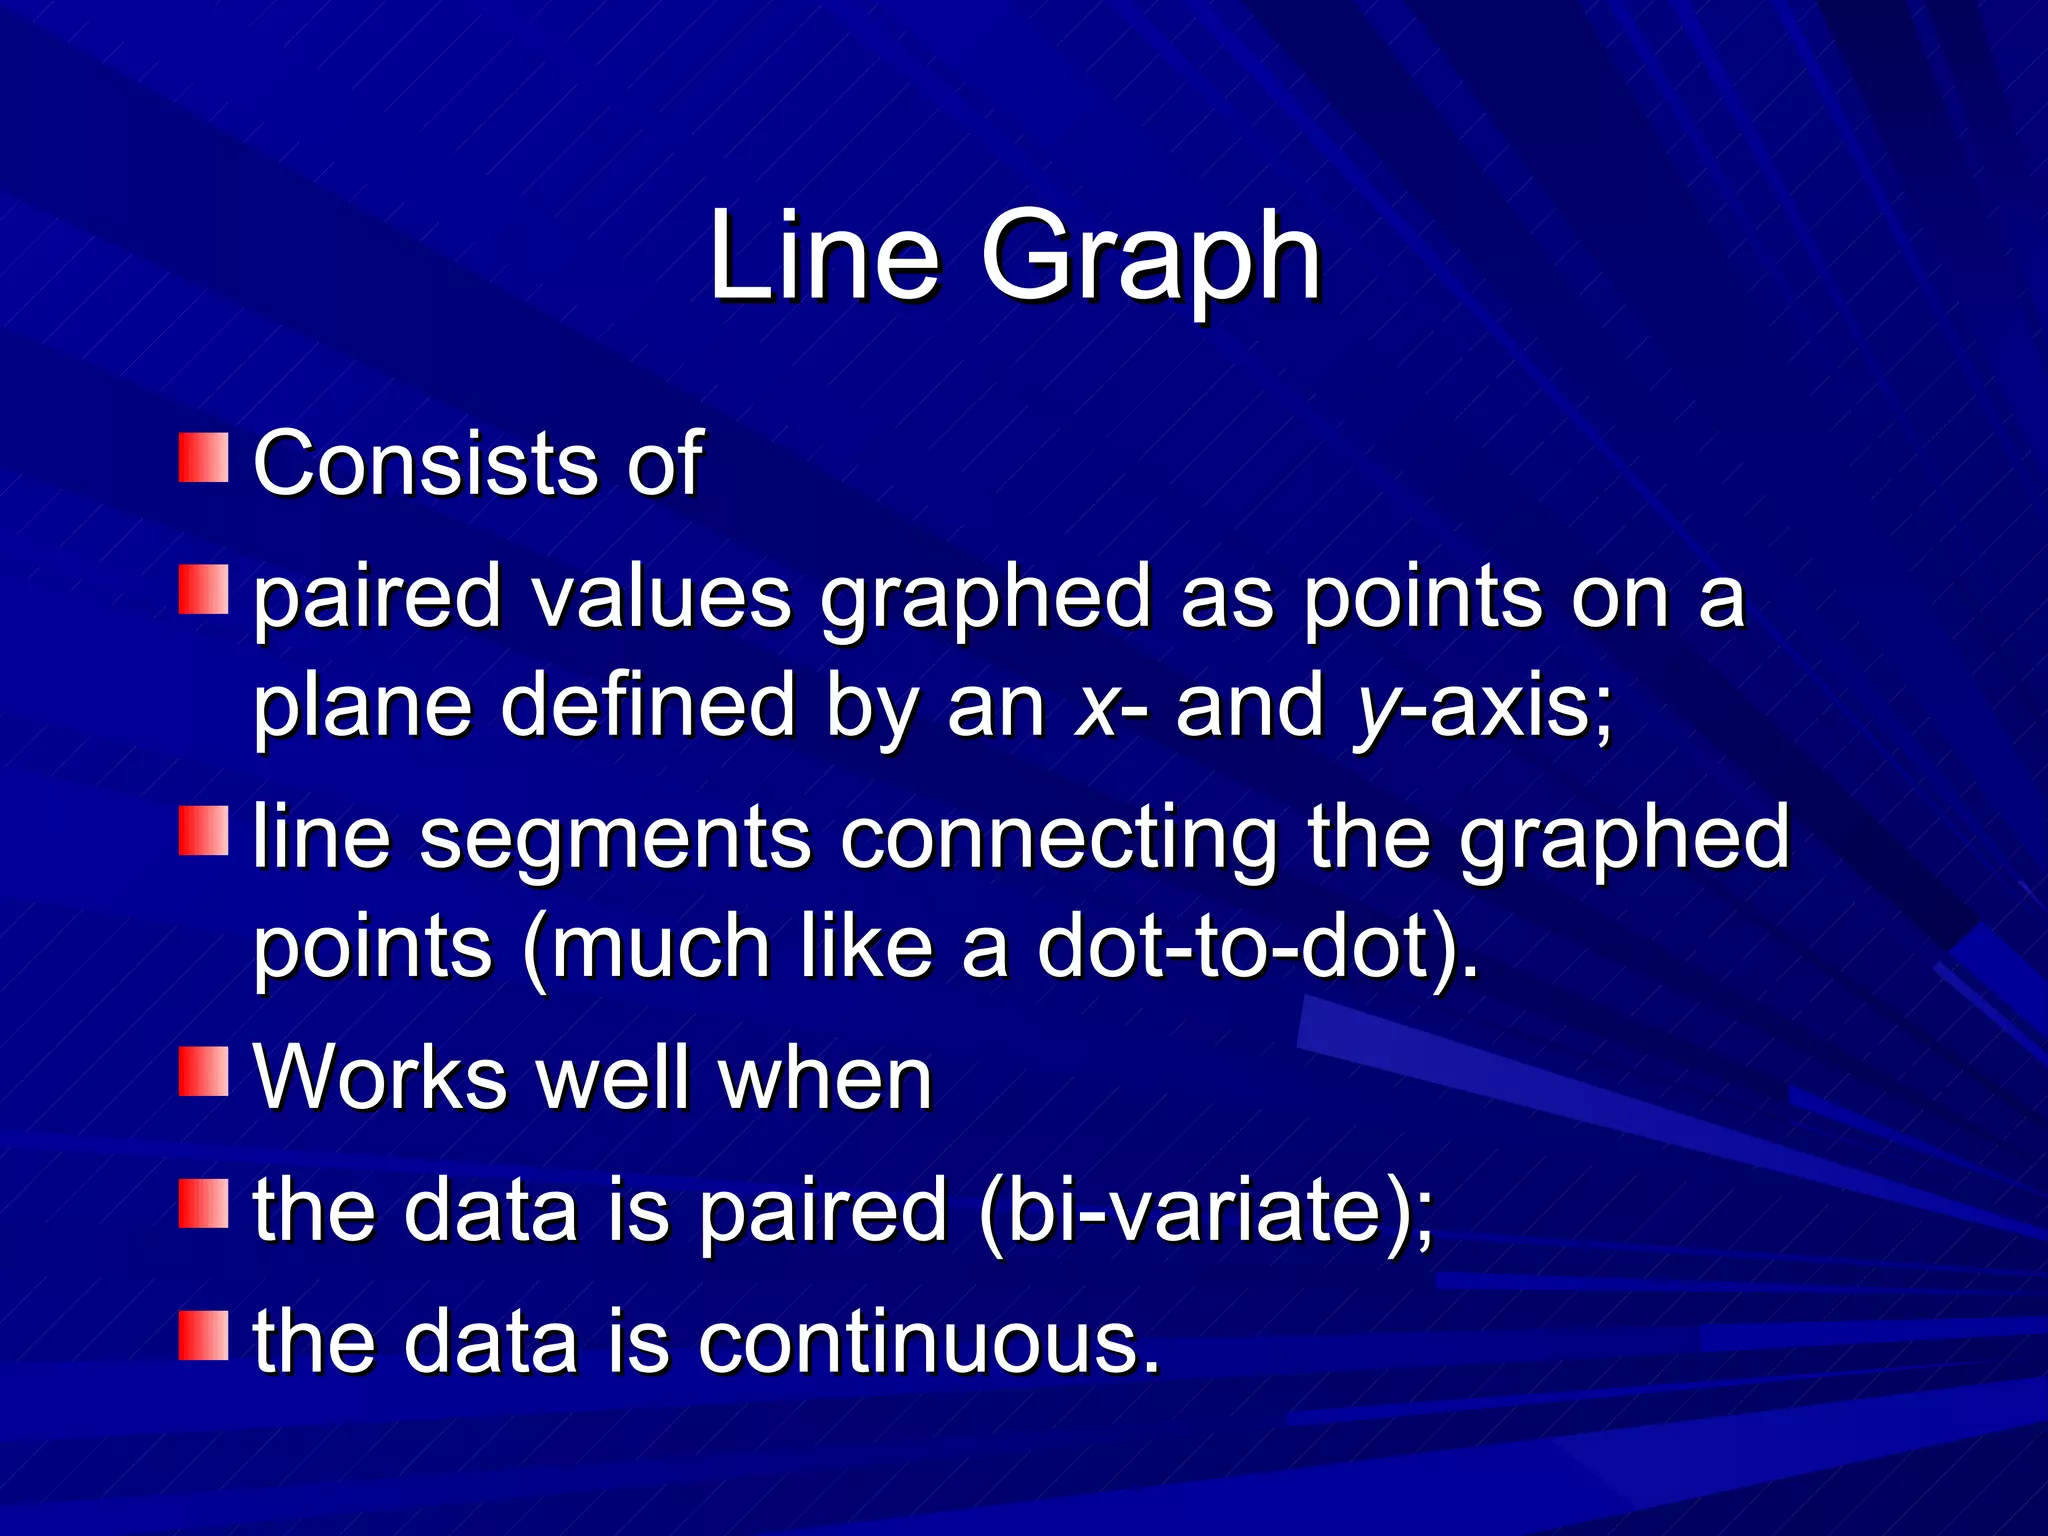
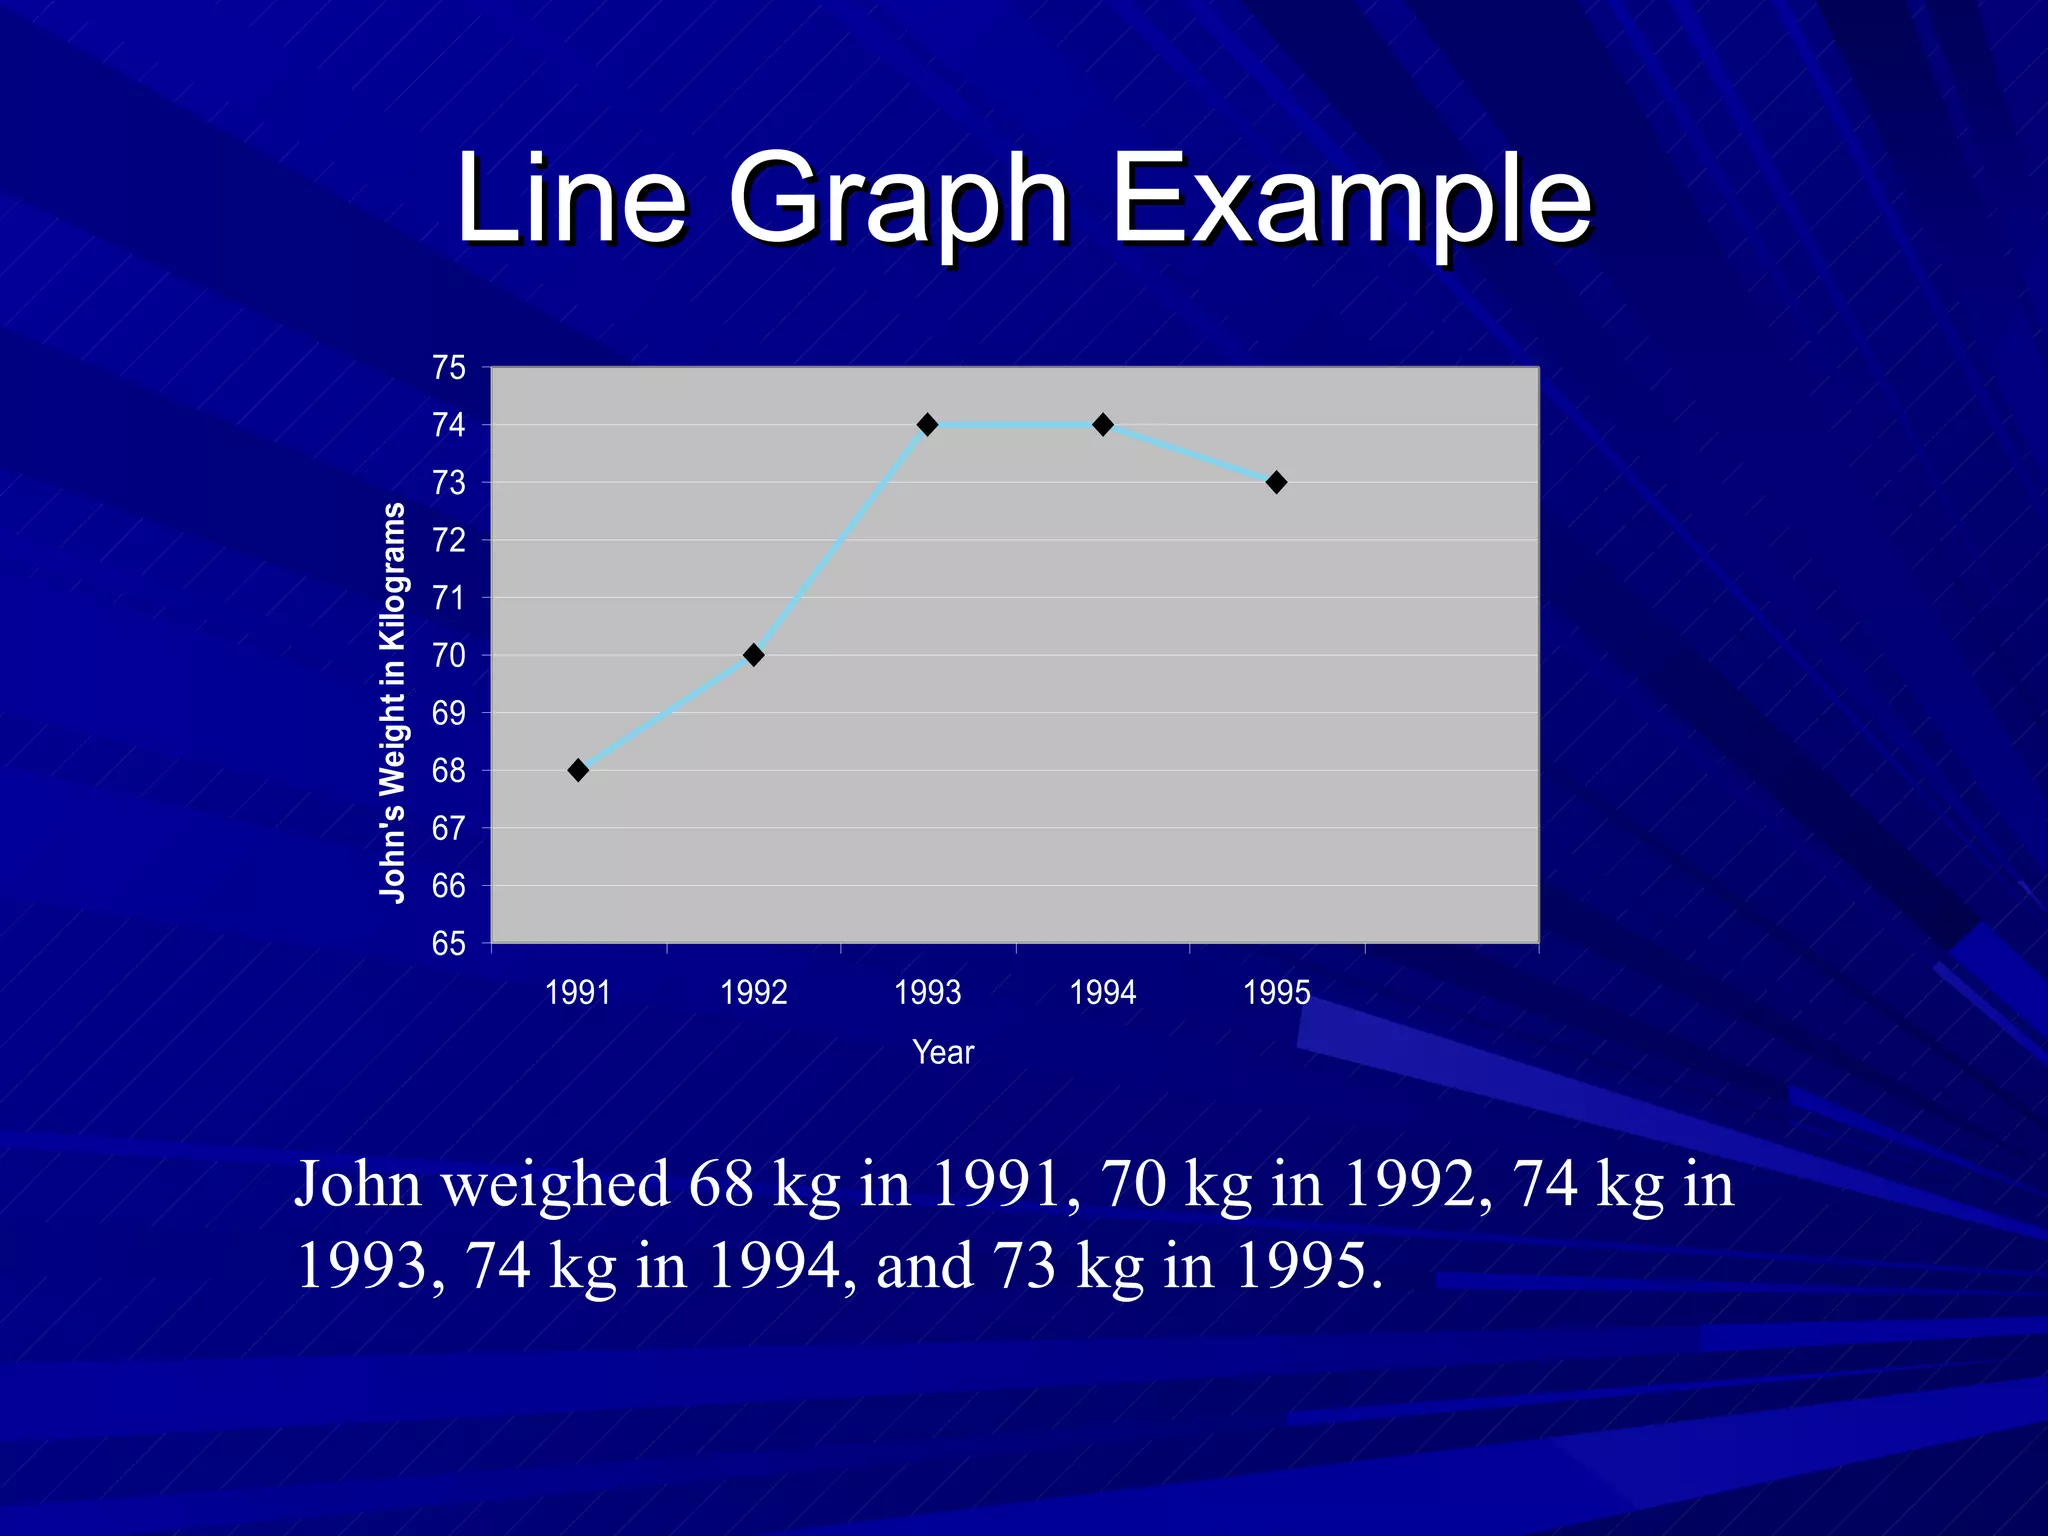
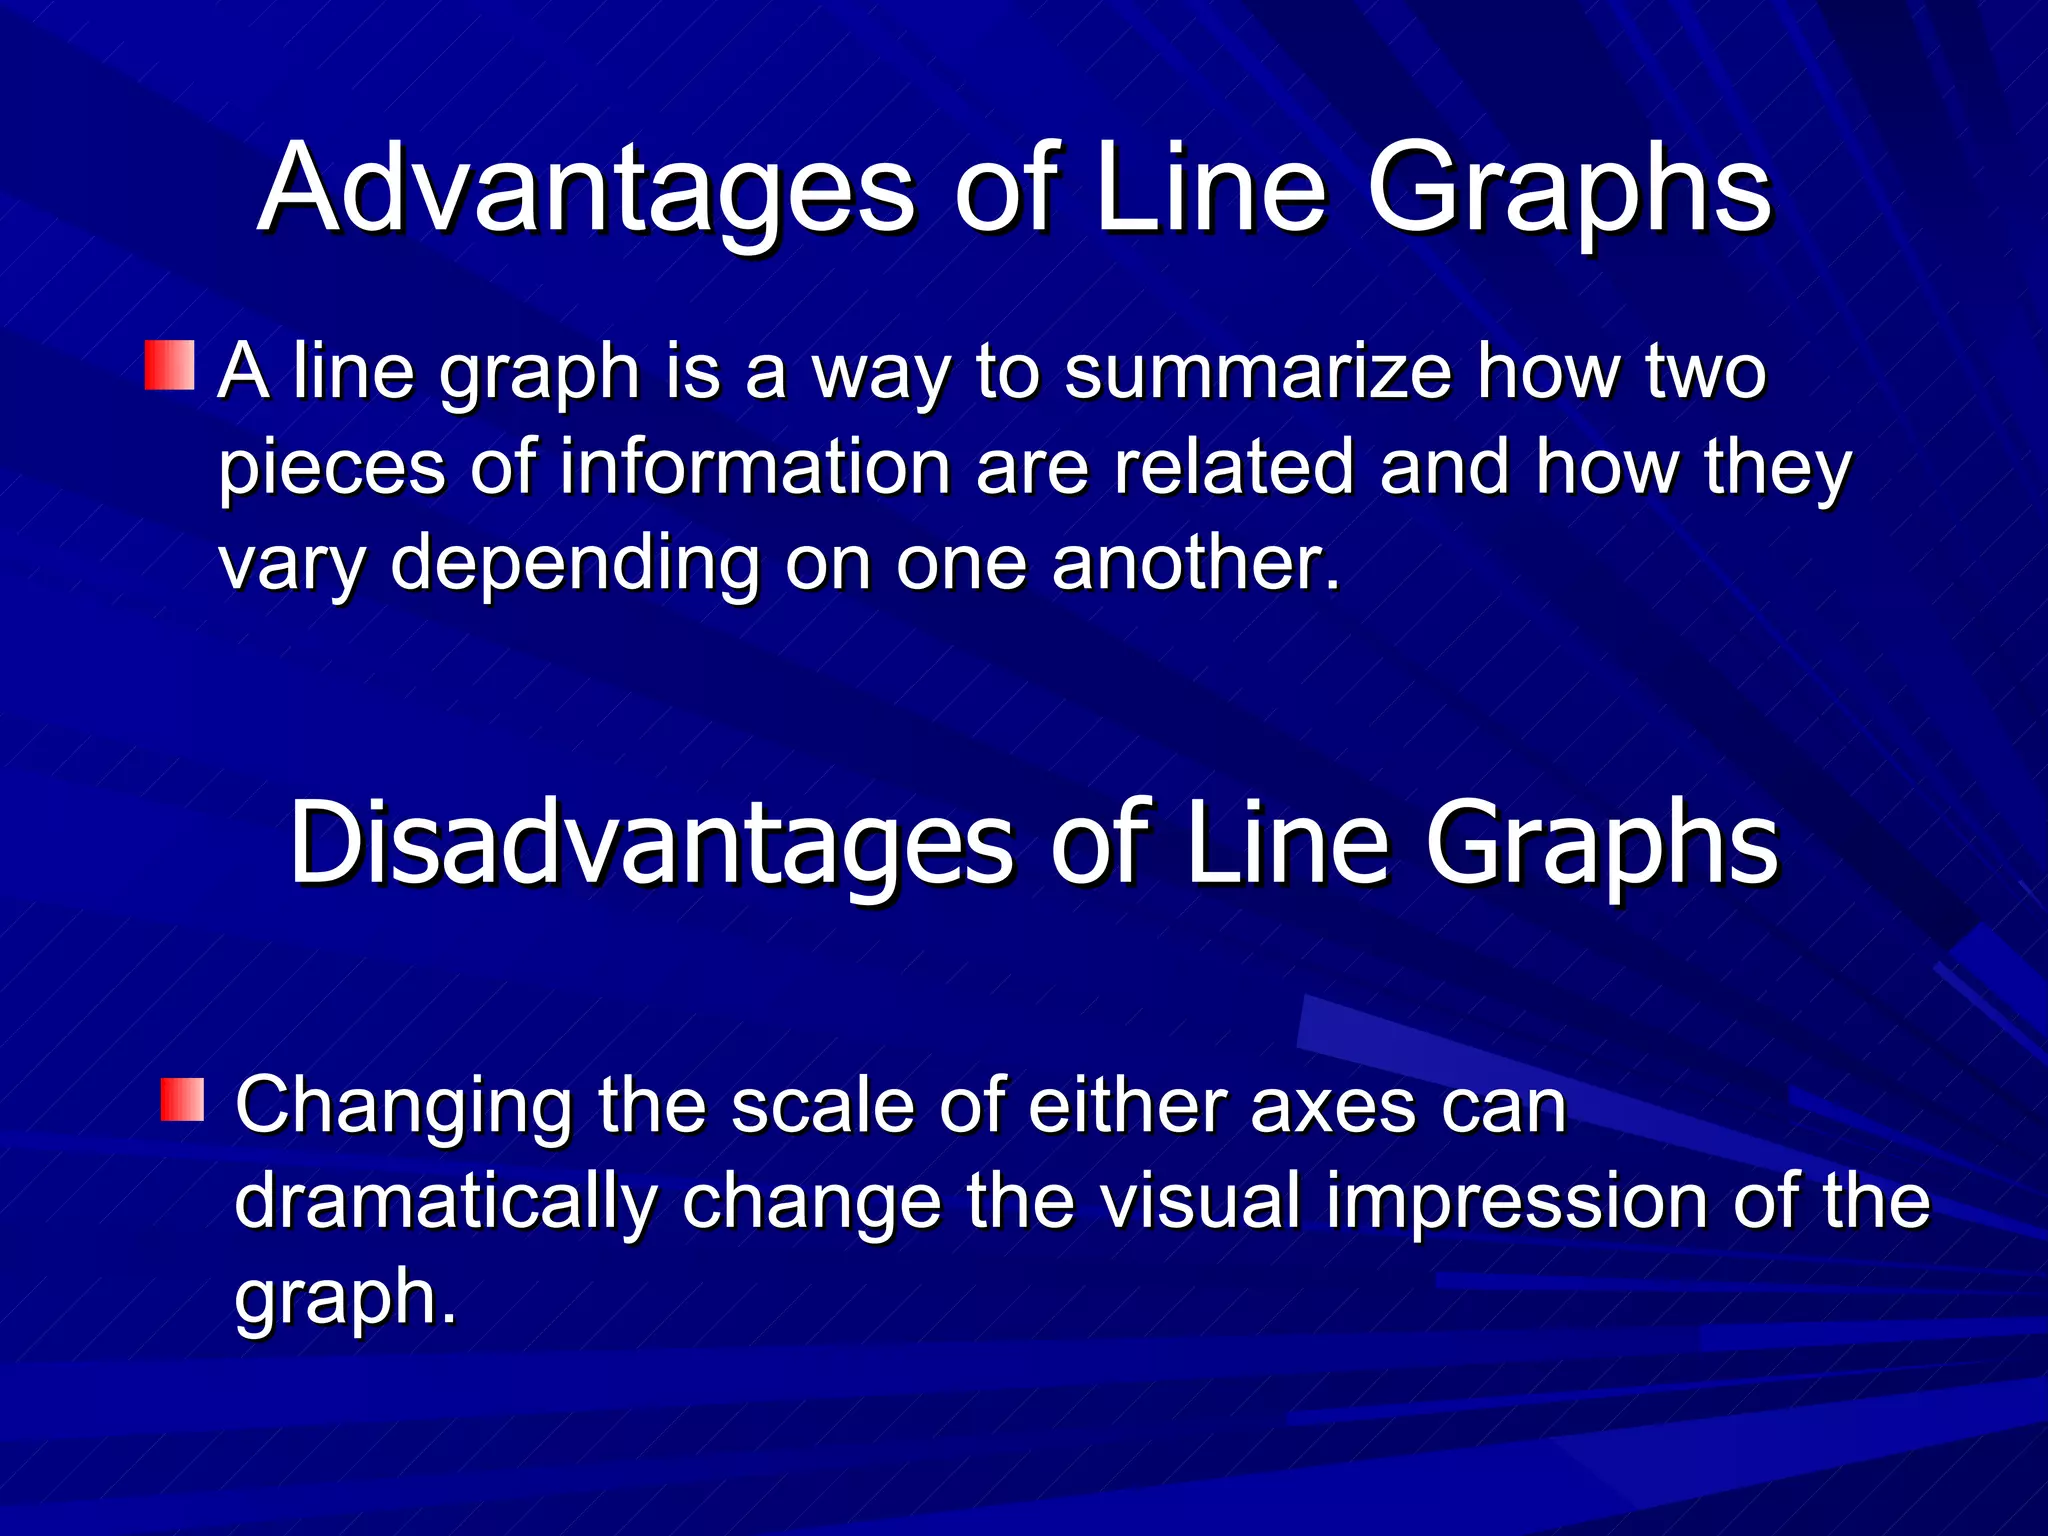
This document provides information and examples of three types of graphs: circle graphs, Venn diagrams, and line graphs. It explains how to construct circle graphs by collecting data, finding percentages, and using a protractor. A Venn diagram example shows pets owned by 50 people. A line graph example tracks one person's weight over 5 years. Advantages and disadvantages of line graphs are also outlined.


![Vibe Coding vs. Spec-Driven Development [Free Meetup]](https://cdn.slidesharecdn.com/ss_thumbnails/vibecodingvsspecdrivendevelopment-251209105622-43f455e7-thumbnail.jpg?width=640&height=640&fit=bounds)


