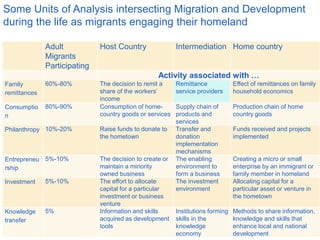
Using data to better understand worker remittances, Manuel Orozco discusses several key points:
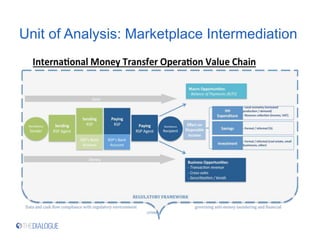
1) Conceptual frameworks that guide data collection on remittances should consider multiple units of analysis, including actors, dynamics, economic activities, and norms/rules.
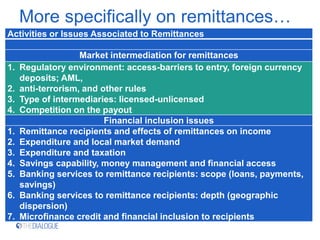
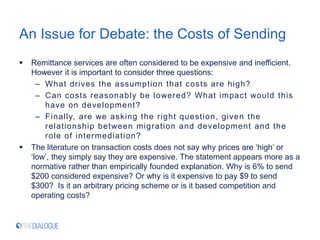
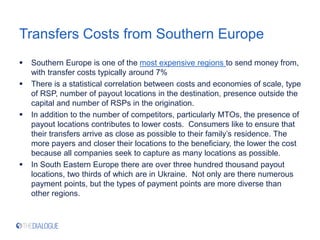
2) Remittance transaction costs are shaped by both supply factors like regulations, competition, and operating costs, as well as demand factors like destination country characteristics.
3) Simply focusing on lowering remittance costs may not be the right policy question - a broader view of the relationship between migration and development is needed.
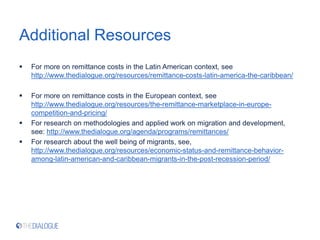
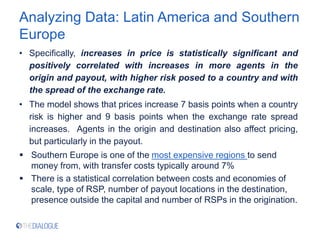
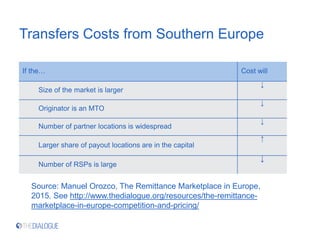
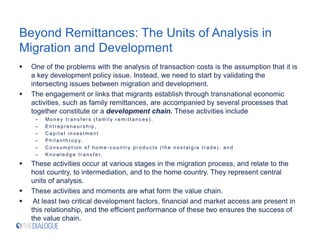
![Units of analysis that guide data
collection
Data, or the systematization of facts through
methods that make knowledge measurable depends
on a conceptual framework, measuring methods,
analytical tools and policy guidance;
Conceptualization is not arbitrary but respond to five
units of analysis, namely:
Actors (primary, intervening, secondary),
Dynamics (mobility, engagement, return),
Economic [social, political] activities (remitting,
investing, consuming, giving, sharing);
Norms and rules and spaces of operation](https://image.slidesharecdn.com/orozco-240220113013-6643d66b/85/Using-Data-to-Better-Understand-Worker-Remittances-3-320.jpg)

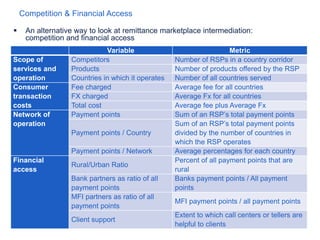


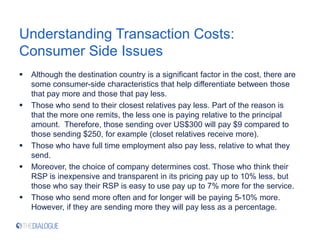
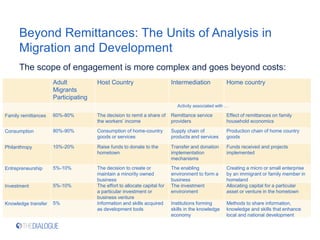
![Competition in Latin America &
Caribbean
2016 2012 2009 2006
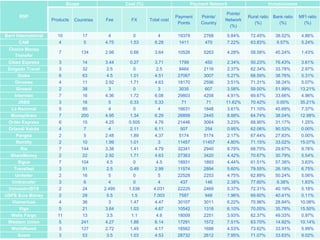
Number of RSPs 31 37 31 40
Number of Products
offed
4 3 2 2
Countries Operating 52 31 4
Fee 3.7% 4.4% 4.1% 4.7%
FX 1.2% 1.3% 1.3% 2.4%
Total cost
5.1% 5.7% 5.4% 7.1%
Payment points 15,602 5,809 4,860 4,047
Points Network 5% 7% 19%
PP per country 2,509 2,208 1,570
Rural ratio 68% 74% 58%
Bank ratio 38% 54% 78% 72%
MFI ratio 8% 21% 27% 16%
Consumer Support [1-4] 3 3 3 3](https://image.slidesharecdn.com/orozco-240220113013-6643d66b/85/Using-Data-to-Better-Understand-Worker-Remittances-30-320.jpg)