
More Related Content
Similar to userguide_v22
Similar to userguide_v22 (20)
More from tutorialsruby
More from tutorialsruby (20)
Recently uploaded
Recently uploaded (20)
userguide_v22
- 1. User’s Guide The ESA/ESO/NASA Photoshop FITS Liberator v.2.2
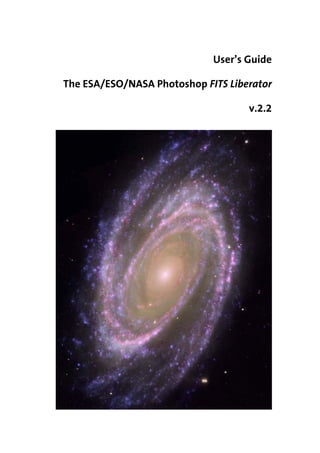
- 2. Colophon This User’s Guide was written by Robert Hurt and Lars Lindberg Christensen. The team behind the ESA/ESO/NASA Photoshop FITS Liberator: Project Lead: Lars Lindberg Christensen (lars@eso.org) Development Lead: Lars Holm Nielsen Core Functionality: Kaspar K. Nielsen Engine and GUI: Teis Johansen Scientific, technical support: Robert Hurt Testing: Robert Hurt, Davide de Martin Acknowledgements FITS is an abbreviation for Flexible Image Transport System. FITS has been a standard since 1982 and is recognised by the International Astronomical Union. The ESA/ESO/NASA Photoshop FITS Liberator uses NASA’s CFITSIO library, TinyXML and T-Rex. Adobe® and Photoshop® are either registered trademarks or trademarks of Adobe Systems Incorporated in the United States and/or other countries. We kindly ask users to acknowledge the use of this plug-in in publicly accessible products (web, articles, books etc.) with the following statement: This image was created with the help of the ESA/ESO/NASA Photoshop FITS Liberator. Cover: Messier 81 is a spiral-shaped system of stars, dust, and gas clouds, the galaxy's arms wind all the way down into the nucleus. The galaxy is located 11.6 million light-years away. This image combines data from the Hubble Space Telescope, the Spitzer Space Telescope and the Galaxy Evolution Explorer (GALEX) missions. Credit: NASA, ESA and A. Zezas (Harvard-Smithsonian Centre for Astrophysics); GALEX data: NASA, JPL- Caltech, GALEX Team, J. Huchra et al. (Harvard-Smithsonian Centre for Astrophysics); Spitzer data: NASA/JPL/Caltech/Harvard-Smithsonian Centre for Astrophysics. This image was created with the help of the ESA/ESO/NASA Photoshop FITS Liberator.
- 3. The ESA/ESO/NASA Photoshop FITS Liberator User’s Guide 3 Table of Contents 1 Introduction to the FITS Liberator ..........................................................................................4 2 Installing the FITS Liberator .....................................................................................................7 2.1 FITS Liberator v.2.2 System Requirements .................................................................8 2.2 Windows Installation ......................................................................................................8 2.2.1 Installing with the Setup Program ..........................................................................8 2.2.2 Manual installation .....................................................................................................8 2.3 Mac OS X Installation ......................................................................................................9 2.4 Uninstall information ......................................................................................................9 3 FITS Liberator Basics ................................................................................................................ 10 3.1 The FITS Liberator Interface ......................................................................................... 11 3.2 The FITS Liberator Workflow ....................................................................................... 12 3.3 Handling High Dynamic Range Images ................................................................... 12 3.3.1 A Quick Example of Stretch Functions ................................................................ 13 3.3.2 More about Stretch Functions ............................................................................... 13 3.3.3 Scaling Images for Better Stretches ..................................................................... 14 3.4 Entering Metadata ........................................................................................................ 15 3.5 Other Utilities ................................................................................................................. 16 3.5.1 Predefined Photoshop Action ................................................................................ 17 3.5.2 FITS Concatenator Script ......................................................................................... 17 3.5.3 Metadata Panels ....................................................................................................... 17 4 Cookbook Examples ............................................................................................................... 20 4.1 Step-by-step Image Import ......................................................................................... 20 4.2 Making a Colour Composite Image ........................................................................... 20 5 Reference Guide ...................................................................................................................... 22 5.1 Tabs ................................................................................................................................... 25 5.2 Processing Tab: Tools.................................................................................................... 25 5.3 Processing Tab: Preview Window.............................................................................. 26 5.4 Processing Tab: Histogram Window......................................................................... 26 5.5 Processing Tab: Image Data ........................................................................................ 26 5.6 Processing Tab: Image Statistics................................................................................ 27 5.7 Processing Tab: Scaling and Stretch (Advanced) ................................................... 27 5.8 Processing Tab: Channels ............................................................................................ 29 5.9 Processing Tab: Undefined Values ............................................................................ 29 5.10 Processing Tab: Other Settings .................................................................................. 30 A. More about Metadata ................................................................................................................ 31 B. Behind the scenes ........................................................................................................................ 34
- 4. The ESA/ESO/NASA Photoshop FITS Liberator User’s Guide 4 1 Introduction to the FITS Liberator The star-forming region NGC 3603 - seen here in the latest Hubble Space Telescope image - contains one of the most impressive massive young star clusters in the Milky Way. Bathed in gas and dust, the cluster formed in a huge rush of star formation thought to have occurred around a million years ago. The hot blue stars at the core are responsible for carving out a huge cavity in the gas seen to the right of the star cluster in NGC 3603’s centre. Credit: NASA, ESA and the Hubble Heritage (STScI/AURA)-ESA/Hubble Collaboration
- 5. The ESA/ESO/NASA Photoshop FITS Liberator User’s Guide 5 T he release of version 2 of the popular ESA/ESO/NASA Photoshop FITS Liberator image processing software has meant that it is even easier and faster to create colour images using raw observations from a range of telescopes, including the NASA/ESA Hubble Space Telescope, NASA’s Spitzer Space Telescope, ESO’s Very Large Telescope and ESA’s XMM-Newton Telescope. Version 1 of the ESA/ESO/NASA Photoshop FITS Liberator was completed in July 2004 by imaging scientists at the European Space Agency, the European Southern Observatory and NASA. FITS stands for Flexible Image Transport System. This single file format archives nearly all images of stars, nebulae and galaxies produced by major telescopes around the world. Before July 2004 this file format was primarily accessible to scientists working with highly specialised image processing tools. More than 60,000 laypeople, educators and amateur astronomers have started using the Liberator since the release of v.1 in July 2004. The FITS Liberator has also become the industry standard for professional imaging scientists at the European Space Agency, the European Southern Observatory and NASA. Stunning images such as the iconic Hubble image Pillars of Creation (Figure 1) can be created in a matter of minutes using version 2 of the FITS Liberator. Version 2 has several notable improvements: o FITS images with up to 4 billion greyscale levels can be processed (32-bit support). o FITS images with up to 500 million pixels or more can be processed (100 times larger than standard images from a digital camera). o An improved user interface and a re-designed order of operations simplify the overall process – for example, the plug-in now remembers previous settings. o New options for advanced Scaling and Stretching to fine tune images for optimal results. o A whole section dedicated to inputting metadata, i.e. information about the image and what it shows. Metadata will be an important tool for future efforts to make archives of ‘pretty pictures’ more accessible. o User access to a text version of the original FITS header. Updates in version 2.2 of the FITS Liberator include: o Universal Binary for Mac allows native CS3 operation on Intel-based systems. o Flip image checkbox allows image orientation to be selected on import. o Root functions (x1/2, x1/3, x1/4, x1/5) now operate symmetrically about x=0. o Version 1.1 of the Astronomy Visualization Metadata (AVM) standard is now fully supported. For more information see http://www.virtualastronomy.org o The import of coordinate metadata from the FITS header has been improved.
- 6. The ESA/ESO/NASA Photoshop FITS Liberator User’s Guide 6 Figure 1 Version 2 of the FITS Liberator makes it even easier to create stunning images. The iconic Hubble image Pillars of Creation, seen here, can be created in a matter of minutes. The three-colour dataset used to create this image can be downloaded from: http://www.spacetelescope.org/projects/fits_liberator/eagledata.html. The advantages of using FITS Liberator over professional image processing tools are indicated in the right- hand image: 1. Added detail in the shadows. 2. Increased gamut (colour space, more nuances). 3. Slightly better noise characteristics. 4. Easier access to advanced cosmetic cleaning tools as demonstrated by the removal of ghosts.
- 7. The ESA/ESO/NASA Photoshop FITS Liberator User’s Guide 7 2 Installing the FITS Liberator Figure 2 The Seven Sisters, also known as the Pleiades star cluster, seem to float on a bed of feathers in a new infrared image from NASA's Spitzer Space Telescope. Clouds of dust sweep around the stars, swaddling them in a gauzy veil. Credit: NASA Spitzer Space Telescope/Robert Hurt
- 8. The ESA/ESO/NASA Photoshop FITS Liberator User’s Guide 8 2.1 FITS Liberator v.2.2 System Requirements Minimum requirements: o Windows PC or Mac (OS X 10.4+); o Screen resolution of 1024 x 768 pixels or better; o Photoshop 7.0 (or later) or Photoshop Elements 2.0 (or later); o Mac: Photoshop CS 3. Limitations by Photoshop version, Photoshop Elements and CS, known issues: o Photoshop CS2, CS3 (32-bit colour depth); o Photoshop CS (16-bit); o Photoshop Elements 3 to Elements 6 (16-bit); o Photoshop 7.0 (only 15-bit colour, and only partial functionality for more than 8-bit colour); o Photoshop Elements 2 (only 8-bit colour) (Elements 1.0 NOT supported); o On Mac only Photoshop CS3 is supported. 2.2 Windows Installation The FITS Liberator can be installed on Windows either by using a setup program or manually. In both cases, a local administrator must install the plug-in. By default, all users on Windows XP machines are local administrators. 2.2.1 Installing with the Setup Program The recommended way of installing the FITS Liberator on Windows is to use the setup program. This will install all the necessary files and optionally register FITS files with Photoshop. 2.2.2 Manual installation To install manually, download the manual installation package and extract the files to a directory. Next, move the files into the correct locations in the file system. Note that if you are using a version other than CS3 or a localised version of Photoshop the folder names will differ. File Location and example FitsLiberator.8bi {Program Files}{Photoshop}Plug-InsFile Formats e.g.: C:Program FilesAdobeAdobe Photoshop CS3Plug-InsFile Formats and {Program Files}{Bridge}Plug-Ins e.g.: C:Program FilesAdobeAdobe Bridge CS3Plug-Ins cfitsio.dll {Program Files}{Photoshop} e.g.: C:Program FilesAdobeAdobe Photoshop CS3 FITS Concatenator.jsx, {Program Files}{Photoshop}PresetsScripts xmlsax.inc, e.g.: xmlw3cdom.inc C:Program FilesAdobeAdobe Photoshop CS3PresetsScripts Colour_composite.atn {Program Files}{Photoshop}PresetsPhotoshop Actions e.g.: C:Program FilesAdobeAdobe Photoshop CS3PresetsPhotoshop Actions userguide.pdf {Program Files}Photoshop FITS Liberator e.g.: C:Program FilesPhotoshop FITS Liberator AVM-1-Creator.txt, {Program Files}Common FilesAdobeXMPCustom File Info Panels
- 9. The ESA/ESO/NASA Photoshop FITS Liberator User’s Guide 9 AVM-2-Content.txt, e.g.: AVM-3-Observation.txt, C:Program FilesCommon FilesAdobeXMPCustom File Info Panels AVM-4-Coordinates.txt, AVM-5-Publisher.txt, AVM-6-FITS Liberator.txt If there is an additional plug-ins folder, the FitsLiberator.8bi file can be placed in that folder instead. 2.3 Mac OS X Installation The installation of FITS Liberator on a Mac system is a simple drag-and-drop operation: 1. Drag the plug-in file (Fits Liberator.plugin) from the disk image to the local Adobe Photoshop plug-in folder. This folder is probably /Applications/Adobe Photoshop CS3/Plug-Ins, or similar for other versions of Photoshop. Be aware that the folder name may differ on localised versions of Adobe Photoshop. If there is an additional plug-ins folder, the Fits Liberator file can be placed in that folder instead. 2. Double-click the Extras.mpkg file to install the File Info… panels and FITS Concatenator script. You may have to select your preferred Photoshop installation folder depending on the version you are running. 3. Eject and discard the disk image. File Location and example FITS Liberator.plugin /Applications/{Photoshop}/Plug-Ins/File Formats e.g.: /Applications/Adobe Photoshop CS3/Plug-Ins/File Formats FITS Concatenator.jsx, /Applications/{Photoshop}/Presets/Scripts xmlsax.inc, e.g.: xmlw3cdom.inc /Applications/Adobe/Adobe Photoshop CS3/Presets/Scripts Colour_composite.atn /Applications/{Photoshop}/Presets/Photoshop Actions e.g.: /Applications/Adobe/Adobe Photoshop CS3/Presets/Photoshop Actions AVM-1-Creator.txt, /Library/Application Support/Adobe/XMP/Custom File Info Panels AVM-2-Content.txt, AVM-3-Observation.txt, AVM-4-Coordinates.txt, AVM-5-Publisher.txt, AVM-6-FITS Liberator.txt IMPORTANT INFORMATION FOR VERSION 1 USERS: Uninstall version 1 of the ESA/ESO/NASA Photoshop FITS Liberator before installing version 2. This is essential. Do this by deleting the file named FitsFormat in the Adobe Photoshop CS2 folder. This folder is probably named /Applications/Adobe Photoshop CS2, or similar for other versions of Photoshop. 2.4 Uninstall information On Windows go to Control Panels -> Add or Remove Programs -> Remove Photoshop FITS Liberator 2.2. A manual de-installation can be done by removing the files in the list under 2.2.2 above. On Mac remove the files in the list in 2.3 above.
- 10. The ESA/ESO/NASA Photoshop FITS Liberator User’s Guide 10 3 FITS Liberator Basics Figure 3 This image is a composite made with the FITS Liberator from black and white images taken with the Palomar Observatory's 48-inch (1.2-metre) Samuel Oschin Telescope as a part of the second National Geographic Palomar Observatory Sky Survey (POSS II). The images were recorded on two glass photographic plates - one sensitive to red light and the other to blue light and later digitised. In order to produce the colour image seen here, a total of 66 different frames were processed, 33 for each colour band, coming from 8 different plates taken between 1988 and 1997. The original file is 17,067x13,508 pixels with a resolution of about 1 arc-seconds per pixel. The image shows an area of sky extending over 4.7° x 3.8° (for comparison, the full moon is about 0.5° in diameter). Credit: Davide De Martin (http://www.skyfactory.org/) & Digitized Sky Survey 2.
- 11. The ESA/ESO/NASA Photoshop FITS Liberator User’s Guide 11 3.1 The FITS Liberator Interface The FITS Liberator acts as an import filter for Photoshop, presenting the user with an interactive interface for adjusting the import settings. It can be thought of as a “Camera RAW” plug-in for astronomical data as the general philosophy is the same: raw data from digital detectors, in cameras or telescopes, need some special processing before they can be used in Photoshop. The FITS Liberator has three sections accessed by the three tabs along the top of its window. The Processing tab contains all of the image import settings. The Metadata tab allows users to enter descriptive information that will be embedded into the image. The FITS Header tab allows users to view the contents of the header of the image. Figure 4 The Liberator’s Graphical User Interface. A more detailed overview can be seen in Figure 10. Credit: ESA. ESO & NASA. The Processing tab in the Liberator interface (Figure 4) holds all the settings the user needs to adjust for image import. The interface is laid out in seven main areas: Preview Window (1): This shows what the image will look like given the current import settings. It is possible to zoom and pan to focus on specific areas of interest in a large image. Histogram Window (2): This shows the displayed brightness distribution of pixels in the image. This can be helpful in identifying Background and Peak levels. The histogram updates as the user changes the Stretch functions. Black and White levels can be set by sliders under the window or from the text entry boxes below. Tools (3): These tools allow the user to manipulate the Preview and Histogram windows interactively. The eyedropper tools set levels by sampling the image.
- 12. The ESA/ESO/NASA Photoshop FITS Liberator User’s Guide 12 Image Statistics (4): Various numerical statistics about the whole image are displayed in these boxes. The upper area gives the values underneath the cursor in the preview window. Scaling and Stretch (5): These settings allow the user to adjust the image by applying a variety of mathematical functions to the FITS data before it is displayed. This is necessary to bring out faint details in images with a high dynamic range. Image Import Settings (6): Here the user selects the desired format of the imported image. This includes the bit-depth (number of bits of greyscale information in each pixel) and transparency settings for pixels tagged as “blank” in the FITS data. Preference Settings (7): The user may set these toggles to customise various aspects of the interface including clipping warnings and numeric display settings. It is also possible to adjust whether an image is flipped for the import and if the import settings should be “frozen” for subsequent images. 3.2 The FITS Liberator Workflow The basic sequence of steps for importing an image is (numbers refer to Fig. 4): 1. Examine the image as rendered in the Preview window (1). 2. Adjust the Black and White level sliders (under the Histogram (2)) to show the full range of the image. 3. If the image is too dark, click Auto Scaling and apply a Stretch function (5) to expand the dynamic range. Note that increasing the Scaled peak Level afterwards will increase the Stretch level (for Stretch functions such as ArcSinh and Log) 4. If desired, go to the Metadata tab and enter contextual information about the image. 5. Click OK to import when satisfied with the image preview and metadata entry. A complete overview of all the Liberator controls can be found in Chapter 5. 3.3 Handling High Dynamic Range Images Often astronomical images have a very high dynamic range, or many greyscale levels. This means that the brightest areas of interest — for instance the core of a galaxy — may be many thousands (or even millions) of times brighter than the faintest structures in the image — for instance a faint nebula at the edge of the image. However, on a computer screen, one only can see 256 levels of brightness (8-bit greyscale). If the original high dynamic range image is imported directly into Photoshop using simple linear scaling, either the detail in the fainter structures is lost in the black background, or the brightest objects over-saturate (or burn in). Photoshop can partially compensate for this by applying Levels or Curves transformations after the FITS image has been imported. However, an image that has been reduced to 8 bits can only be adjusted a little bit before it begins to “posterize”, showing discrete steps in brightness that obscure low-level features. Even extreme Curve adjustments cannot bring out the faintest detail in some of these images. The answer is to apply Scaling and Stretch (5) before importing, as described below.
- 13. The ESA/ESO/NASA Photoshop FITS Liberator User’s Guide 13 Figure 5 Astronomical images contain many more greyscale levels than can be viewed on a computer monitor or printed. In the image to the left a “normal” or linear representation of the image is shown. To the right the effect of a non-linear Stretch, a Logarithmic Stretch, is shown. By using a non-linear Stretch it is possible to enhance some greyscale levels in the image more than others and so to make faint details visible without saturating the brighter parts of the image. 3.3.1 A Quick Example of Stretch Functions While there are a lot of potentially confusing elements in the Scaling and Stretch (5) section, the process can actually be quite quick and easy. To begin, select a FITS file that has a lot of dynamic range (galaxies are often good for this) and open it in the FITS Liberator. Now try the following: o Use the sliders in the Histogram (2) to adjust the levels to show the full range of the image. Enabling the White and Black clipping checkboxes on the right (7) can help to make sure that nothing of interest is lost. o Click the Auto Scaling button (5). The histogram settings have now been copied over to the Background and Peak levels. The Scaled peak level has been set to a default of 10. o Choose x^(1/2) from the Stretch functions pop-up. Notice how much brighter the faint features have become. o Try out the other Root functions: x^(1/3), x^(1/4), x^(1/5). Notice how each successive one brings the faint features up even more — probably too much! o Now choose ArcSinh(x) from the Stretch functions pop-up. The image will get a bit darker. o Increase the Scaled peak level to 100, then 1000, and finally 10,000. Notice that again the faint features are brought up more at each step. These basic steps cover most of the practical information one needs to know about using Stretch functions and adjusting them to the needs of a specific image. The details, however, must be covered as well. 3.3.2 More about Stretch Functions The FITS Liberator can easily handle high dynamic range images by allowing the user to apply a Stretch function to the data before it is rendered as an image. The settings in the Scaling and Stretch section (5) offer all the flexibility needed to render all the details in any image quickly. The user has a choice of a variety of mathematical functions in the Stretch function pop-up menu. The inverse hyperbolic sine (ArcSinh) and Root Functions (x1/2 [square root], x1/3, x1/4, etc.) are the most commonly used, but others including the logarithm (Log) and compound functions are available as well. The chosen function will be applied to the FITS data before it is converted to greyscale. In some ways this mimics
- 14. The ESA/ESO/NASA Photoshop FITS Liberator User’s Guide 14 the perceptual ability of the human eye, which can accommodate to perceive dramatically different levels of brightness simultaneously. Note that ArcSinh is generally preferred over Log. The two have very similar effects on the image, but ArcSinh is well behaved and symmetric around zero. Log, however, “blows up” at zero and can be harder to use effectively. Each Stretch function affects the rendering of a high dynamic range differently. The user may find that different functions are preferred for different images. Since the effects are difficult to predict, it is best to experiment with different functions on several images and to observe the results. The Linear Stretch function applies no transformation at all to the dynamic range of the image. 3.3.3 Scaling Images for Better Stretches The Stretch functions work best when an image is properly scaled. All of them benefit when the “black” part of the image is numerically equal to zero, and some functions produce different effects if the overall scaling of the image is changed. The three numeric settings in the Scaling and Stretch (5) section allow the user to modify the values of the source FITS data as needed. o Background level: numeric value of the noise level in the original image. o Peak level: numeric value of the brightest sources of interest. o Scaled peak level: target value for the brightest sources before applying the Stretch function. Setting the background level is critical for all of the Stretch functions. While some FITS images may already have been processed so their Background levels equal zero, others commonly have offsets. If not removed, these offsets can make it impossible to recover faint details. The FITS Liberator will subtract the value of the Background level from the data before applying the Stretch function. For Root functions, the Background level is the only setting that affects the results. ArcSinh and the related Log function, however, depend on the overall scaling of the data as well. These two families of Stretch functions, Root and ArcSinh, compress the dynamic range in different ways. To increase the dynamic range compression for the two cases: o Roots: Choose higher order Root Stretch functions from the pop-up menu. o ArcSinh/Log: Increase the value of Scaled peak level. To set the image scaling for the ArcSinh function, the Peak level should be set to the numeric value of the brightest areas of interest in the image. The Scaled peak level can be adjusted to different values to fine tune the overall appearance. In general, use larger Scaled peak values to bring out fainter details. To scale an image quickly, set the Black and White level sliders in the Histogram (2) to the desired levels and click Auto Scaling in the Scaling and Stretch (5) section to copy those settings over to the Background and Peak levels. The Scaled peak level defaults to 10, which has a very mild stretch effect. Increasing this number to higher values (100, 1000, etc.) will yield stronger effects. The image below (Figure 6) demonstrates the effect of different Stretch functions and different values of the Scaled peak level.
- 15. The ESA/ESO/NASA Photoshop FITS Liberator User’s Guide 15 Figure 6 The range of available FITS Liberator Stretch functions are shown here. The top two rows show all the Stretch functions, in approximate order of their effect. Image Scaling is constant for all of these, with the White level of the galaxy nucleus set to 10. The bottom row shows the effect of changing the Peak Scaling while using Log(x), ( functionally equivalent to ArcSinh(x) in this example). Note that this single function allows a faint structure to be enhanced smoothly.. The Root functions are not affected by Scaling, but the compound functions, which use Log or ArcSinh terms, do depend on it. 3.4 Entering Metadata Metadata can be defined as information about the data. Metadata allows an image to be identified, catalogued and used in flexible ways by giving the user access to a database of information about the file. Version 2 of the FITS Liberator allows a user to tag images with a full set of metadata that are saved within the image file itself. Image metadata includes information about what is in the image and where it can be found. The metadata can be read by anyone who later opens the image in Photoshop or another metadata-aware program. The FITS Liberator v.2.2 supports version 1.1 of the Astronomy Visualization Metadata (AVM) standard. This standard is being developed by the Virtual Astronomy Multimedia Project (VAMP), an international standards collaboration. Areas covered by the AVM include the image source, descriptive information about the image, details of the observation, and spatial coordinates. The FITS Liberator also automatically embeds metadata describing the import settings used for an image (this is not a part of the AVM standard, but an extension useful to users wanting to know later how an image was originally generated). The Metadata tab in the FITS Liberator interface (Figure 7) allows users to enter metadata during the image import process. The user either fills in the metadata fields
- 16. The ESA/ESO/NASA Photoshop FITS Liberator User’s Guide 16 directly or by choosing from a dropdown list. Some fields retain the values from the last opened image, and others are read directly from keywords in the FITS header. Figure 7 An example of the type of information that is typically entered in the FITS Liberator metadata fields. To include metadata during the import process, the user should switch to the Metadata tab after the image import settings are chosen. There are several sections: o CONTENT: describes the subject matter of the image. o OBSERVATION: includes specifics of the observation including wavelength and coordinates. o PUBLISHER: information relevant to participants in the VAMP archive. o CREATOR: the facility or person responsible for creating the final image. o FITS Liberator: a record of the import settings used. All of the fields filled out in the Metadata tab will be written to the image when it is imported into Photoshop after clicking OK. It is also possible to add/modify/delete metadata for an image within Photoshop itself. This is discussed in more detail in the advanced section below. For a complete guide to the AVM 1.1 standard consult the documentation at: http://www.virtualastronomy.org 3.5 Other Utilities The FITS Liberator distribution includes a number of other useful tools for working with astronomical images in Photoshop.
- 17. The ESA/ESO/NASA Photoshop FITS Liberator User’s Guide 17 3.5.1 Predefined Photoshop Action An example of a Photoshop Action (Colour_composte.atn) is installed automatically or supplied on the FITS Liberator download page: http://www.spacetelescope.org/projects/fits_liberator/download_v22.html and can be used to speed up the process. This Photoshop Action file can be accessed from the Actions palette. It contains three pre-defined sequences for colouring a layer in Photoshop red, green, or blue. If the three Actions are run on three different layers the result will be a full colour composite of these three images. Once the layers have been coloured using this Action, the settings may be adjusted directly without having to rerun them. For instance, changing the Hue value in the Hue/Saturation layer will change the colour of the layer. 3.5.2 FITS Concatenator Script This script will take all of the open images and combine them into a single Photoshop document with each image on a separate layer. This is a convenient way to build a colour composite from multiple images. Use FITS Liberator to read in every desired channel for a colour composite then run this script to consolidate them. If the FITS files are aligned, the final image will be aligned as well. Otherwise it will be necessary to use Photoshop’s various tools to scale, rotate and move layers to align them to one another. If the individual images have been tagged with metadata, the script will correctly combine these into the final image. Note that this script will operate on every open window when it is run. Make sure that anything that does not belong in the final composite is closed before running this script! The FITS Concatenator should appear in the File>Scripts… menu. If it is not present, make sure the associate files are correctly installed (see section 2). 3.5.3 Metadata Panels The FITS Liberator also includes six custom panels for Photoshop’s File>File Info… dialog. These panels allow all of the AVM 1.1 metadata tags to be viewed and edited. They will appear as the six “Astro” choices in the panel list on the left. For a complete discussion of the AVM 1.1 standard and full descriptions of each tag, consult the documentation available at: http://www.virtualastronomy.org These metadata panels also enable Adobe Bridge to view embedded metadata in saved image files. Only a subset of the fields may be edited in the current CS3 version of Bridge. Metadata fields that take multiple values must be changed in Photoshop. If these panels do not appear in the File>File Info… dialog, check to make sure they were correctly installed (see section 2).
- 18. The ESA/ESO/NASA Photoshop FITS Liberator User’s Guide 18 Figure 8 One of the metadata panels included for the Photoshop File Info… dialog. The panels operate like the other Photoshop File Info… panels. Some special features are outlined below. o Fields that accept multiple values (marked by an asterisk “*”) use the semicolon “;” to separate values. o Fields that are restricted to specific values are accessed through pop-up menus. o Dates should be entered using whatever localised format is appropriate for your system (e.g. DD/MM/YYYY for the US). o Some fields will store recent values that can be quickly entered using the small pop-up menu at the right of the text entry box. Deleting Metadata If it is necessary to delete all metadata: o Click on the Advanced panel at the bottom of the list on the left. o Select all of the fields that appear on the right. o Click the Delete button. Setting up a Template It can be useful to set up templates for sets of fields that are entered frequently. o Start with a blank image; it may be helpful to delete all metadata as outlined above. o Enter the values in every field you want to be part of the template. o Choose the Save Metadata Template… option from the pop-out menu at the upper right of the window. o Choose a descriptive name and save.
- 19. The ESA/ESO/NASA Photoshop FITS Liberator User’s Guide 19 Saved metadata templates may be applied to images using either Photoshop or Bridge. In Photoshop the template is appended to the existing metadata (overwriting fields that already have an entry). The Metadata palette in Bridge offers the option of appending or replacing (fields not in the template are deleted).
- 20. The ESA/ESO/NASA Photoshop FITS Liberator User’s Guide 20 4 Cookbook Examples 4.1 Step-by-step Image Import Below is a simple step-by-step example showing how to import a FITS file into Photoshop using a specific FITS file from the examples on the FITS Liberator web page. The numbers refer to Figure 10: 1. Go to the example datasets on the FITS Liberator web page: http://www.spacetelescope.org/projects/fits_liberator/datasets.html 2. Download a dataset. 3. Open the images one by one in FITS Liberator. 4. Set the Black and White levels using the sliders (15, 16) to give a good contrast without either too much black or too many oversaturated areas. 5. Click on the background (darkest part of the image) with the Background level selector (8). 6. Click Auto Scaling (52). 7. Try different Stretch functions (46) to enhance the fainter parts of the image. 8. Try out different values of Scaled peak level (49) to change the scaling of the image. There is no need to change the Background level (47) and the Peak level (48) as well as these will also just change the amount of scaling (as the Scaled peak level). 9. Click OK. 4.2 Making a Colour Composite Image The basic principles for making colour composites are: 1. After the “Liberation” above, copy the layers together in Photoshop. 2. Colourise the layers. 3. Use adjustment layers to finalise the image. A colour composite image is created by assembling two or more greyscale images of the same object taken in different colours, or wavelengths, of light. These may be from the visible part of the spectrum or beyond. An example of a Photoshop Action (Colour_composte.atn) is installed automatically or supplied on the FITS Liberator download page: http://www.spacetelescope.org/projects/fits_liberator/download_v22.html and can be used to speed up the process. It operates on three (aligned) greyscale exposures of the same object in Photoshop. To install the Action manually: o Save the file in the local Actions directory, e.g. /Applications/Adobe Photoshop CS3/Presets/Photoshop Actions). To load the Action: o Go to the Action Window (Window -> Action). o Select Load Actions -> Colour_composite.atn (the small arrow in the upper right corner). o A series of new commands will appear in the local Actions palette. To use the Action: o Open the three images using the FITS Liberator and copy the three files into three layers of the same file.
- 21. The ESA/ESO/NASA Photoshop FITS Liberator User’s Guide 21 o Select the layer that should appear as blue in the final image and play the "Blue Layer" part of the Action. Answer "Don't Merge", if that question appears. o Repeat for the red and green layers. For more information on creating colour composites consult the tutorial at: http://www.spacetelescope.org/projects/fits_liberator/stepbystep.html
- 22. The ESA/ESO/NASA Photoshop FITS Liberator User’s Guide 22 5 Reference Guide Figure 9 The Horsehead Nebula made from Digitized Sky Survey 2. Davide De Martin (http://www.skyfactory.org/) & Digitized Sky Survey 2
- 23. The ESA/ESO/NASA Photoshop FITS Liberator User’s Guide 23 I n this section, we provide more in-depth information about the many different options that FITS Liberator v.2 provides. To give the full overview we will first list all the components in the Graphical User Interface. Figure 10 FITS Liberator screen shot with all tools and functions marked. These are described below. Note that the Image Statistics can be shown for either the Scaled version of the image (as here) or for the Stretched version of the image. The numbers 36-40 are therefore absent. Tabs 1. Processing tab Preview image and import settings 2. Metadata tab Metadata input 3. FITS header tab FITS Header information Tools 4. Move tool Move tool (v) 5. Zoom tool Zoom tool (z) 6. Black level selector Black level selector tool (s) 7. White level selector White level selector tool (w) 8. Background level selector Background selector tool (b) 9. Peak level selector Peak level selector tool (p) Preview Window 10. Preview window 8-bit representation of the image 11. Minus button Decrease zoom factor 12. Plus button Increase zoom factor 13. Zoom pop up Choose a zoom factor Histogram Window 14. Histogram window Shows the distribution of greyscale levels in the image 15. Black level slider Drag to change the black level 16. White level slider Drag to change the white level 17. Black level text field Black level 18. White level text field White level 19. Black level button up Increase the black level 20. Black level button down Decrease the black level 21. White level button up Increase the white level 22. White level button down Decrease the black level
- 24. The ESA/ESO/NASA Photoshop FITS Liberator User’s Guide 24 Image Data 23. Image/Plane selector Change image and/or plane 24. X coordinate X-coordinate 25. Y coordinate Y-coordinate 26. Input value Input value 27. Stretched value Stretched value 28. Scaled value Scaled value 29. Width Image width 30. Height Image height Image Statistics 31. Minimum Input Minimum of Input Image 32. Maximum Input Maximum of Input Image 33. Mean Input Mean of Input Image 34. Median Input Median of Input Image 35. Standard Deviation Input Standard deviation of Input Image 36. Minimum Stretched Minimum of Stretched Image 37. Maximum Stretched Maximum of Stretched Image 38. Mean Stretched Mean of Stretched Image 39. Median Stretched Median of Stretched Image 40. Standard Deviation Stretched Standard deviation of Stretched Image 41. Minimum Scaled Minimum of Scaled Image 42. Maximum Scaled Maximum of Scaled Image 43. Mean Scaled Mean of Scaled Image 44. Median Scaled Median of Scaled Image 45. Standard Deviation Scaled Standard deviation of Scaled Image Scaling and Stretch (Advanced) 46. Stretch function pop up Select Stretch function 47. Background level text field Set Background level 48. Peak level text field Set Peak level 49. Scaled peak level text field Set Scaled peak level 50. Set Background level button Inserts Black level as Background level 51. Set Peak level button Inserts White level as Peak level 52. Auto Scaling button Insert Black level from Input Image as Background level, insert White level from Input Image as Peak level, Set Scaled peak level to 10 Channels 53. Channels 8-bit radio button Import as 8-bit image 54. Channels 16-bit radio button Import as 16-bit image 55. Channels 32-bit radio button Import as 32-bit image Undefined Values 56. Undefined Black radio button Import undefined values as black 57. Undefined Transparent radio button Import undefined values as transparent Other Settings 58. OK button Import image into Photoshop 59. Cancel button Unload plug-in 60. Reset button Reset settings 61. Preview checkbox Enabled/disable preview 62. Flip Image Set vertical orientation of image 63. Freeze settings checkbox Keep current settings 64. Undefined (red) checkbox Show/hide undefined pixels 65. White clipping (green) checkbox Show/hide white clipped pixels 66. Black clipping (blue) checkbox Show/hide black clipped pixels 67. Scaled radio button Show Scaled values 68. Stretched radio button Show Stretched values The FITS Liberator Graphical User Interface (shown above) controls all elements of the import by means of three panels accessed by the tabs along the top row (1-3) and a selection of buttons and options along the right side. The first Processing tab (1) contains all of the controls for adjusting the input FITS image. The second, the Metadata tab (2) accesses the image and creation tags that are useful for documenting the image and interfacing with services like the Virtual Observatory. The FITS header tab (3) shows the content of the header for the input image. The OK button (58) and the Cancel button (59) accept or abort the input, and the Reset button (60) clears any user settings and returns the image to the default best-guess settings. The esc key can also be used to cancel the plug-in.
- 25. The ESA/ESO/NASA Photoshop FITS Liberator User’s Guide 25 Text entered into the text fields is accepted when either the Enter or Tab keys are pressed. The Enter key maintains focus on the current field while Tab advances to the next one. Note that the Enter key is not equivalent to clicking the OK button since it is used for data entry. Copy/paste commands are recognised within the text fields. 5.1 Tabs There are three tabs (1-3) along the top of the Liberator interface: 1. The Processing tab where the image processing is handled. 2. The Metadata tab where Metadata can be entered. 3. The FITS header tab where a text version of the FITS header is listed. The elements of the Processing tab (1) will be covered in the next sections (5.2 onwards). The Metadata tab (2) is discussed in more detail in sections 3.4 and Appendix A (below). The FITS Header tab (3), selected along the top of the FITS Liberator interface, allows the user to view the raw FITS header. This can contain useful, if cryptically encoded, information about the original data. Text from this window can be selected and copied to the clipboard. More information about FITS headers and keywords may be found at: http://fits.gsfc.nasa.gov/ 5.2 Processing Tab: Tools The available tools are found on the left side of the interface on the Processing tab in three groups: the Move and Zoom tools (4,5), Black and White level selectors (6,7), Background and Peak level selectors (8,9). The top hand-shaped Move tool (4) is for panning in the Histogram and Preview windows. When selected the user can simply click and drag in either window to move items into view. The Move tool may also be temporarily activated by holding down the space bar. The Zoom tool (5) allows interactive zooming within the Preview (10) and Histogram windows (14). Clicking in either window will zoom in a step around the area clicked. Holding down the alt/option key will zoom out. The user may also drag out a rectangular region to zoom exactly into that portion. The Black and White levels and Background/Peak level eyedroppers (6-9) are similar in use, but apply to different portions of the interface. They allow their corresponding parameters to be set interactively by clicking within the Preview window. The upper two (6,7) set the Black and White levels (17,18) under the Histogram window; they use a single-pixel sample. The lower two (8, 9), distinguished by the “B” & “P” labels, set the Background/Peak levels (47,48) in the Scaling and Stretching pane. Keyboard shortcuts may be used to activate the Tools: o v for Move tool; o z for Zoom tool; o w for White level selector; o s for Black level selector;
- 26. The ESA/ESO/NASA Photoshop FITS Liberator User’s Guide 26 o b for Background level selector ; o p for Peak level selector. 5.3 Processing Tab: Preview Window The large Preview window (10) in the upper left part of the Processing tab displays a greyscale preview of the imported image that reflects the current Black and White levels and Stretching settings and shows how the image would look if imported. Any update to the display settings will trigger an immediate redraw, which may take some time on slower systems or for larger images. Underneath the window are readouts and controls for setting the Zoom level (11-13). A specific Zoom level may be selected from the pop-up menu (13), or the +/- buttons (11,12) can be used to increment/decrement the zoom value. 5.4 Processing Tab: Histogram Window The display window on the lower left of the FITS Liberator window (14) shows the current histogram of the image that is displayed in the Preview window. This is similar to the histograms generated within Photoshop, except that the histogram here changes depending on whether the image is the Input Image, the Scaled Image or the Stretched Image. Changes to the Scaling and Stretching settings (see below) will cause the histogram to be regenerated, reflecting any changes to the brightness distribution. The Histogram window may be zoomed in or out using the Zoom tool (5) and moved using the Move Tool (4). The Black and White levels are set underneath the histogram with the small black/white triangles (15,16). These controls function in much the same way as the Levels dialog box in Photoshop. The black/white sliders may be dragged within the window, or numeric values may be typed into the text fields. Tab or Enter will cause the number to be accepted. The up/down arrows (19-22) by each field adjust the level in increments of 1/10th of a displayed column to allow for finer adjustments than dragging allows. The up/down arrows on the keyboard will work the same way if the text field is highlighted. 5.5 Processing Tab: Image Data Image/Plane selector (23): The pop-up menu selector (which defaults to “Image 1, Plane 1”) allows the user to select the desired sub-image within a complex data file. While FITS files contain a single image, some datasets allow multiple images to be included in a single file. These can include multiple concatenated images strung together (identified by the Image number), or 3D data cubes (identified by the Plane number). Multiple images are sometimes combined when they form a series taken of a single source, possibly at different positions or using different filters. Data cubes usually use the third axis to include multiple values of a third parameter, such as steps in wavelength for spectral line imaging. The FITS Liberator can read in one image at a time by selecting the desired image from the pop-up menu. If multiple images need to be read in using identical settings (as is often the case with a data cube), the user may select the Freeze settings checkbox (63) as the first one is read in to retain all Black and White levels and Background/Peak/ Stretch settings (see Other Settings below).
- 27. The ESA/ESO/NASA Photoshop FITS Liberator User’s Guide 27 The information area underneath the Image/Plane selector (23) is used as the cursor moves over the Preview window. The left column shows the absolute X and Y coordinate (24,25) of the cursor in the original image relative to the upper left corner. The right-hand column gives the data value at that position for both the Input Image (26) and the Scaled Image (28) (the data after the Background level and a Scaling factor have been applied) respectively or the Stretched Image (27) (after a Stretch function has been applied), depending on the setting of the radio button for Show Image information for on the far right side of the interface (67,68). Further down there is the Width and Height of the image (in pixels (29,30)). 5.6 Processing Tab: Image Statistics The Image Statistics information area (31-45) provides overall statistics for the whole image. As with the Image Data area these values are presented for both the original Input Image and either the Scaled or Stretched Images. The statistics provided include the minimum and maximum data values (31/41, 32/42) as well as the mean (or average) (33/43), median (34, 44), and standard deviation (35, 45). 5.7 Processing Tab: Scaling and Stretch (Advanced) The Scaling and Stretch functions (46-49) in FITS Liberator apply a mathematical Stretch to the raw data values to bring out faint details in the image without having to over- saturate the brightest areas of interest. Such Stretches are needed in datasets with a high dynamic range. The Stretch function pop-up (46) provides a list of mathematical functions that can be applied to the raw data before it is translated to levels of grey for display. These come in four basic groupings: o Linear – no stretch; o Logarithmic – ArcSinh(x) and Log(x); o Roots – x^(1/2), x^(1/3), x^(1/4), x^(1/5); o Compound functions – combinations of the above. Of the Logarithmic functions, the inverse hyperbolic sine, or ArcSinh(x), is preferred for its anti-symmetric behaviour around x=0 (ArcSinh(-x) = -ArcSinh(x)). The scaling of the data has a strong effect on the result of these functions. Log(x) is included for historic reasons, though due to the fact that Log(0) is undefined it is implemented internally as Log(1+x) which behaves very similarly to ArcSinh(x) for x • 0. The Root functions are more commonly known as square root (x^[1/2]), cube root (x^[1/3]), etc. The FITS Liberator implements each of them to be anti-symmetric around x=0, even though mathematically roots should return undefined (or imaginary) results. Here they are merely used as tools for dynamic range compression. The Root functions are unaffected by image scaling. The compound functions provide a variety of subtle differences in how dynamic range is compressed at different levels in the image. Image scaling strongly affects the results of these functions. Each function provides a slightly different bias to the bright and dark features, and often experimentation is the only way to determine which function is best for a given file. Note that the Histogram window will update with each change in Stretch function
- 28. The ESA/ESO/NASA Photoshop FITS Liberator User’s Guide 28 to show how it affects the distribution of light and dark pixels. This can be helpful in finding correct background levels and choosing a good Stretch. All of the Stretch functions in the Liberator work best when the Background level of the data (i.e. the value of the darkest parts of the image) is close to zero. In many astronomical datasets this is not the case due to the way the data were collected or processed. One can examine the data values of the background in an image by passing the cursor over the darkest regions and study the input value readout in the Image Data section. If these values are not clustered around zero, the user should provide an offset to zero them out (explained below). Some of the Stretch functions provide very different results depending on the Peak level of the data (the largest data values of interest). These functions include ArcSinh(x) or any Log(x) function. If the Peak level is much smaller than 1, the result will be very similar to an unstretched, or Linear, function. If the entire image is scaled upwards (by multiplying by a constant) these Stretch functions will enhance the fainter parts of the image relative to the brightest peaks. This enhancement increases as the Scaled peak level (49) is scaled to larger numbers (100, 1000, etc.). The FITS Liberator can zero the background properly and adjust the value of the peak. These are set using the values in the Background level (47), Peak level (48), and Scaled peak level (49) text boxes. Before a Stretch function is applied to an image, its data will be rescaled using the formula: Scaled Image = Scaled peak level * (Input Image – Background level) / (Peak level – Background level)1 The Background level (47) should be set to equal the numeric value of the pixels in the image that should be rendered as black. These numbers can be determined, for example, by running the cursor over the darkest parts of the image in the Preview window and looking at the Input values under image data (26). The Peak level (48) should be set to equal the numeric value of the brightest areas of interest in the image. Note that this may not be the absolute brightest object in the image! Often the important part of an image is a nebula or galaxy that is much fainter than the brightest stars. In this case, the Peak level should be set to the very brightest level of the nebula or galaxy. The Scaled peak level (49) is a free parameter that the user can adjust to obtain the best visual result after the Background level (47) and Peak level (48) have been set appropriately. Note that this will only affect the results of a Log() or ArcSinh() Stretch function. Useful values tend to be in the range of 10 to 10,000, with the larger values bringing up more of the faint detail. Values as small as 0.1 are nearly indistinguishable from a simple Linear function and will not enhance faint structure at all. The FITS Liberator allows the Background level (47) and Peak level (48) to be set in four different ways: 1. Auto Scaling button (52): Clicking this button will use the existing settings for the Black and White level indicators below the Histogram window and set the Scaled peak level to 10. This is often a good first guess. 2. Background level and Peak level from reading the Black and White level buttons under the Histogram window (17, 18): The buttons to the right (50, 1 Note that this equation is slightly simplified as the parameter Scaled Background level mentioned in Appendix B has been set explicitly to zero in FITS Liberator v.2.
- 29. The ESA/ESO/NASA Photoshop FITS Liberator User’s Guide 29 51) allow the user to individually set the Background/Peak levels based on the respective Black and White level settings. Unlike the Auto Scaling button, only one of the values is updated at a time, and the Scaled peak level (49) keeps its current value. Note that the histogram range (14) will be adjusted when the Scaling takes place (as the Background level and the Peak level change), i.e. the histogram now shows the pixel value distribution of the Scaled Image and not the original Input Image. 3. Background/ Peak level selectors (8, 9): The bottom two eyedropper tools in the toolbox will directly sample Background/Peak levels from within the image. They take the median value of a 10x10 box around the click location. 4. Text field entry (47, 48): Values can be typed directly into the text fields. Hitting either the Tab or Enter keys is necessary for the change to take effect. Scientific notation of the form “1.25e5” may be used if desired. NOTE: The Background level must logically be smaller than the Peak level. Any attempt to violate this using any input method will be ignored. Note also that the initial values for Peak level and Scaled peak level are set to the best guess for the White level; this means that the default result for the Scaled data will be equal to the Input value (i.e. no Scaling). To experiment with these adjustments, open an image with high dynamic range (for example a galaxy or nebula image). Use one of these methods to set the Background level to the value of the background noise in the image and the Peak level to the brightest area of interest. Now choose either the Log(x) or ArcSinh(x) Stretch function. To see how Scaled peak level (49) affects the Stretch, experiment by entering different numbers in this field. Start with values around 0.1 and switch back to Linear for comparison; they should look very similar. Switch back to the other function and start increasing the Scaled peak level by factors of 10: 1, 10, 100, 1000. Notice how the larger values enhance the fainter structures better. Figure 6 illustrates the effects of the different Stretch functions and Peak level on a single image. 5.8 Processing Tab: Channels The Channel radio buttons (53-55) determine the bit depth read into Photoshop. Photoshop 7 and CS can both handle 8-bit or 16-bit channels, while CS2 and CS3 can handle 32-bit channels. The default for this is 16-bit channels, which gives a lot of flexibility in subsequent adjustments in Photoshop without risk of posterizing (this is most likely when using large gamma or Curves adjustments to bring up faint features). It is possible to use 8- bit as well, but this is suggested only for extremely large images, since it will reduce the file size by a factor of two. Photoshop does support 32-bit channels, but treats such images differently. This mode is intended for HDRI (High Dynamic Range Imaging) that captures the full luminance in a photographic scene. While this is similar to the challenges faced in rendering high dynamic range astronomical images, few of the standard tools are supported, making it difficult to create good image composites in this mode. 5.9 Processing Tab: Undefined Values Undefined data values arise in an image if there is no data for that region. Some FITS files mark empty pixels as “blank” using a special data value. The FITS Liberator uses the Undefined Values Radio buttons (56, 57) determine how these pixels are rendered into
- 30. The ESA/ESO/NASA Photoshop FITS Liberator User’s Guide 30 Photoshop. If Black (56) is selected, then they simply appear as black pixels. If Undefined Transparent (57) is selected, the image is read in as a Photoshop layer with transparent areas wherever the image is undefined. 5.10 Processing Tab: Other Settings The far right column (58-68) of the FITS Liberator provides a number of useful settings. In addition to the OK button (58) and the Cancel button (59), the user can use the Reset button (60) to return to the best initial guesses for the parameters. The Preview checkbox (61) enables the Preview window (10) on the left (it may be useful to turn this off to improve performance on large files). The Flip Image checkbox (62) determines how a FITS image will be rendered. The FITS format is very flexible in how image data can be recorded as data; it may be entered row-by-row from either the bottom or top. Standard image viewing formats always display from the top down. Therefore it is often necessary to vertically flip an image so it displays properly in Photoshop (this usually means how it is seen on the sky). The FITS Liberator will attempt to determine the proper setting for this checkbox from the header, but if the image appears mirror-imaged, the user can flip it the other way manually by checking or unchecking this setting. The Freeze settings checkbox (63) will force the Liberator to use all of the current image settings (Black and White levels, Background level, Peak level, Scaled peak level, and Stretch function) the next time any FITS file is opened. The new file may be different or the same one. This is useful when a series of images need to be opened with identical settings so they can be directly compared. Note that the Liberator also retains these settings for the individual images when they are opened again, even if Freeze settings is switched off. The Mark Pixels checkboxes in Preview settings (64-66) allow the user to see where data may be lost in the Preview window. The checkboxes allow three options to be toggled on and off. Red (64) is used to mark Undefined pixels, whether from missing data or from the application of certain Stretch functions. Green (65) indicates areas where highlights are clipped because they exceed the White level setting. Blue (66) shows where the pixel values fall below the Black level setting. These pixel previews can be helpful in seeing whether the Black and White levels are set too close together. The radio buttons under Show Image information (67, 68) allow the user to switch between readouts of Scaled or Stretched data. This setting affects the Image Data and Image Statistics readouts.
- 31. The ESA/ESO/NASA Photoshop FITS Liberator User’s Guide 31 A. More about Metadata The Virtual Astronomy Multimedia Project (VAMP) will enable access to, and vastly increase the use of, astronomy image resources. VAMP will enable innovative future exploitation of all kinds of outreach media by systematically linking resource archives worldwide. To this end, VAMP has developed an international standards system for Astronomy Visualization Metadata (AVM) that is currently at version 1.1. Such a standard will allow a much more coordinated and widespread utilisation of the products. The inclusion of metadata tags for astronomical colour images are included in the FITS Liberator v.2 as the forerunner of a more general use in all future outreach products. The FITS Liberator is a primary tool for embedding AVM tags within images, either at the FITS import stage or later using the File Info... dialog panels. Images tagged with this metadata have the potential to be used in a wide variety of innovative applications now under development. A brief summary of each of the tags, their format, and an example of a typical value is given in the following table. For extensive documentation on VAMP and the AVM 1.1 tags, visit the website: http://www.virtualastronomy.org
- 32. The ESA/ESO/NASA Photoshop FITS Liberator User’s Guide 32 AVM Tag Name Format Example Creator Metadata Creator string Spitzer Science Center CreatorURL URL http://www.spitzer.caltech.edu Contact.Name string, list R. Hurt Contact.Email string, list example@ipac.caltech.edu Contact.Telephone string, list 555-555-5555 Contact.Address string 1200 E. California Blvd. Contact.City string Pasadena Contact.StateProvince string California Contact.PostalCode string 91125 Contact.Country string USA Rights string Public Domain Content Metadata Title string NGC 1566 Headline string The spiral galaxy NGC 1566, located in the constellation of Dorado, is rendered in infrared light. Description string This beautiful spiral galaxy NGC 1566, located approximately 60 million light-years away in the constellation of Dorado was captured by the Spitzer Infrared Nearby Galaxies Survey (SINGS) Legacy Project using the telescope's Infrared Array Camera. Subject.Category string-CV, list C.5.1.1;C.5.3.2.2 Subject.Name string, list NGC 1566 Distance string, list(2) 1250;- Distance.Notes string Approximate value provided by PI ReferenceURL URL http://gallery.spitzer.caltech.edu/Imagegallery/imag e.php?image_name=sig05-013 Credit string NASA/JPL-Caltech Date date 2007-08-12 ID string sig05-013 Type string-CV Observation Image.ProductQuality string-CV Good Observation Metadata Facility string, list(s) Spitzer;Spitzer;Spitzer;Spitzer Instrument string, list(s) IRAC;IRAC;IRAC;IRAC Spectral.ColorAssignment string-CV, Blue;Green;Red;Red list(s) Spectral.Band string-CV, Infrared;Infrared;Infrared;Infrared list(s) Spectral.Bandpass string, list(s) Near-Infrared;Near-Infrared;Near-Infrared;Near- Infrared Spectral.CentralWavelength float, list(s) 3600;4500;5800;8000 Spectral.Notes string Blue indicates emission at 3.6 microns, green corresponds to 4.5 microns, and red to 5.8 and 8.0 microns. Temporal.StartTime date, list(s) 2002-12-21-0900; 2002-12-21-0900; 2002-12-21- 0900; 2002-12-21-0900 Temporal.IntegrationTime float, list(s) 10;10;10;10 DatasetID string, list(s) a1;a2;a3;a4
- 33. The ESA/ESO/NASA Photoshop FITS Liberator User’s Guide 33 Coordinate Metadata Spatial.CoordinateFrame string-CV ICRS Spatial.Equinox string 2000 Spatial.ReferenceValue float, list(2) 65.0696476555;54.9319798442 Spatial.ReferenceDimension float, list(2) 974;974 Spatial.ReferencePixel float, list(2) 616.293197632;346.155345917 Spatial.Scale float, list(2) -0.000208670950176;0.000208670950176 Spatial.Rotation float -124.2050324 Spatial.CoordsystemProjection string-CV TAN Spatial.Quality string-CV Full Spatial.Notes string FOV: 12.19 x 12.19 arcminutes; Ref coordinate: 4h20m16.72s -54d55m55.13s; derived from astrometry.net file sig05-013.fits Spatial.FITSheader string CRVAL1 = 6.3856 CRVAL2 = 64.1784 RADESYS = 'ICRS ' EQUINOX = 2000. CTYPE1 = 'RA---TAN-SIP' CTYPE2 = 'DEC--TAN-SIP' CRPIX1 = 214. CRPIX2 = 138. 2 Spatial.CDMatrix float, list(4) Publisher Metadata Publisher string Spitzer Space Telescope PublisherID string vamp://spitzer ResourceID string sig05-013_jpg_sm ResourceURL URL http://ipac.jpl.nasa.gov/media_images/sig05- 013_medium.jpg RelatedResources list vamp://spitzer/sig05-011; vamp://spitzer/sig05-012 MetadataDate date 2007-11-17 MetadataVersion string 1.1 File Metadata File.Type string-CV JPEG File.Dimension float, list(2) 974;974 File.Size float, list(2) 180 File.BitDepth float 16
- 34. The ESA/ESO/NASA Photoshop FITS Liberator User’s Guide 34 B. Behind the scenes In the usual sequence of processing an image, the image typically moves through four distinct stages: 1. Input Image: The reduced, cleaned image from the astronomical processing. 2. Scaled Image2: The Input Image scaled up or down so as to let the pixel values fall in the range where the Stretch function works best. If the Input Image contains, for instance, pixel values in the range [5:50,000], the Scaled Image might be chosen to contain pixel values from [0:10] (for instance by applying Auto Scaling) to fit with a Logarithmic Stretch function better. 3. Stretched Image: The Scaled Image transformed by a Stretch function, for instance a Logarithmic Stretch. 4. Output Image: The image that arrives in Photoshop for further processing. This is qualitatively the same as the Stretched Image, but is scaled to the desired bit depth in Photoshop (e.g. 16-bit: [0, 65535]) Comparative Histograms for an example with the four Image types are shown in Figure 11 below, illustrating the evolution of the image through the processing sequence. Note that the FITS Liberator defines Logarithm as Log = Log_10(Scaled_Image + 1) for consistent behaviour around the background or zero level. 2 Defined as Scaled_Image = ScaledBackgroundLevel + (ScaledPeakLevel – ScaledBackgroundLevel) * (Input_Image – BackgroundLevel) / (PeakLevel – BackgroundLevel)
- 35. The ESA/ESO/NASA Photoshop FITS Liberator User’s Guide 35 Figure 11: Example histograms for the four different images created during a typical workflow process: a) Input Image, b) Scaled Image, c) Stretched Image (here with a Logarithmic Stretch function) and d) Output Image (in Photoshop).
- 36. The ESA/ESO/NASA Photoshop FITS Liberator User’s Guide 36 Index 16 bit, 29, 34 mathematical functions, 13, 27 32 bit, 5, 8, 29 maximum data values, 27 8 bit, 8, 12, 29 Maximum Input, 24 Auto Scaling, 14, 20, 24, 28, 29 Maximum Scaled, 24 average, 27, See mean Maximum Stretched, 24 Background level, 14, 24, 27, 28, 29, 30 mean, 27 Background level selector, 23, 26 Mean Input, 24 Background level text field, 24 Mean Scaled, 24 Black and White levels, 20, 25, 26, 28, Mean Stretched, 24 29, 30 median, 27, 29 Black clipping (blue) checkbox, 24 Median Input, 24 Black level button down, 23 Median Scaled, 24 Black level button up, 23 Median Stretched, 24 Black level selector, 23, 25 Metadata, 5, 15, 25 Black level slider, 23 Metadata tab, 23, 24, 25 Black level text field, 23 minimum data values, 27 burn in, 12 Minimum Input, 24 Cancel button, 24, 30 Minimum Scaled, 24 Channels, 29 Minimum Stretched, 24 Channels 16-bit, 24 Minus button, 23 Channels 32-bit, 24 Move tool, 23, 25, 26 Channels 8-bit, 24 multiple images, 26 clipping, 30 NASA, 5 Curves in Photoshop, 12 OK button, 24, 25, 30 data cube, 26 Output Image, 34, 35 Digitized Sky Survey 2, 10, 22 over-saturate, 12, 27 dynamic range, 12, 27, 29 Peak level, 14, 24, 28, 29, 30 Enter key, 25, 26, 29 Peak level selector, 23, 25, 26, 29 European Southern Observatory, 5 Peak level text field, 24 European Space Agency, 5 Pillars of Creation, 5, 6 FITS, 2, 5 Plus button, 23 FITS header, 5, 25 posterize, 12, 29 FITS header tab, 23, 24, 25 Preview checkbox, 24, 30 FITS Liberator web page, 20 Preview window, 23, 25, 26, 27, 28, 30 Flexible Image Transport System. See Processing tab, 23, 24, 25 FITS Reset button, 24, 30 Freeze settings, 24, 26, 30 Scaled Image, 24, 26, 27, 29, 34, 35 Graphical User Interface, 23, 24 Scaled peak level, 14, 24, 28, 29, 30 Height, 24, 27 Scaled peak level text field, 24 Histogram window, 23, 25, 26, 28, 34 Scaled value, 24 Hubble Space Telescope, 5 Scaling, 5, 13, 15, 25, 26, 27, 29 image axes, 26 Set Background level, 24 Image Data, 27, 28, 30 Set Peak level, 24 Image Statistics, 23, 27, 30 Show Image information, 27, 30 Image/Plane selector, 24, 26, 27 Show Scaled value, 24 Input Image, 24, 26, 27, 34, 35 Show Stretched value, 24 Input value, 24, 28, 29 Spitzer Space Telescope, 5, 7 Levels in Photoshop, 12 standard deviation, 27 Linear, 12, 28, 29 Standard Deviation Input, 24 Log, 15, 28, 29, 34, See Logarithm Standard Deviation Scaled, 24 Logarithm, 13, 34, 35 Standard Deviation Stretched, 24 Mark pixels, 30
- 37. The ESA/ESO/NASA Photoshop FITS Liberator User’s Guide 37 Stretch function, 14, 15, 20, 24, 27, 28, Virtual Observatory, 24 29, 30, 34, 35 White clipping (green) checkbox, 24 Stretched Image, 24, 26, 27, 34, 35 White level. See Black and White levels Stretched value, 24 White level button down, 23 Stretching, 5, 13, 25, 26 White level button up, 23 Tab key, 25, 26, 29 White level selector, 23, 25 Technical requirements, 8 White level slider, 23 Tools, 23, 25 White level text field, 23 transparent, 30 Width, 24, 27 Undefined, 24, 29, 30 X coordinate, 24, 27 Undefined (red) checkbox, 24 XMM-Newton, 5 Undefined Black, 24 Y coordinate, 24, 27 Undefined Transparent, 24, 30 Zoom pop up, 23 Very Large Telescope, 5 Zoom tool, 23, 25, 26