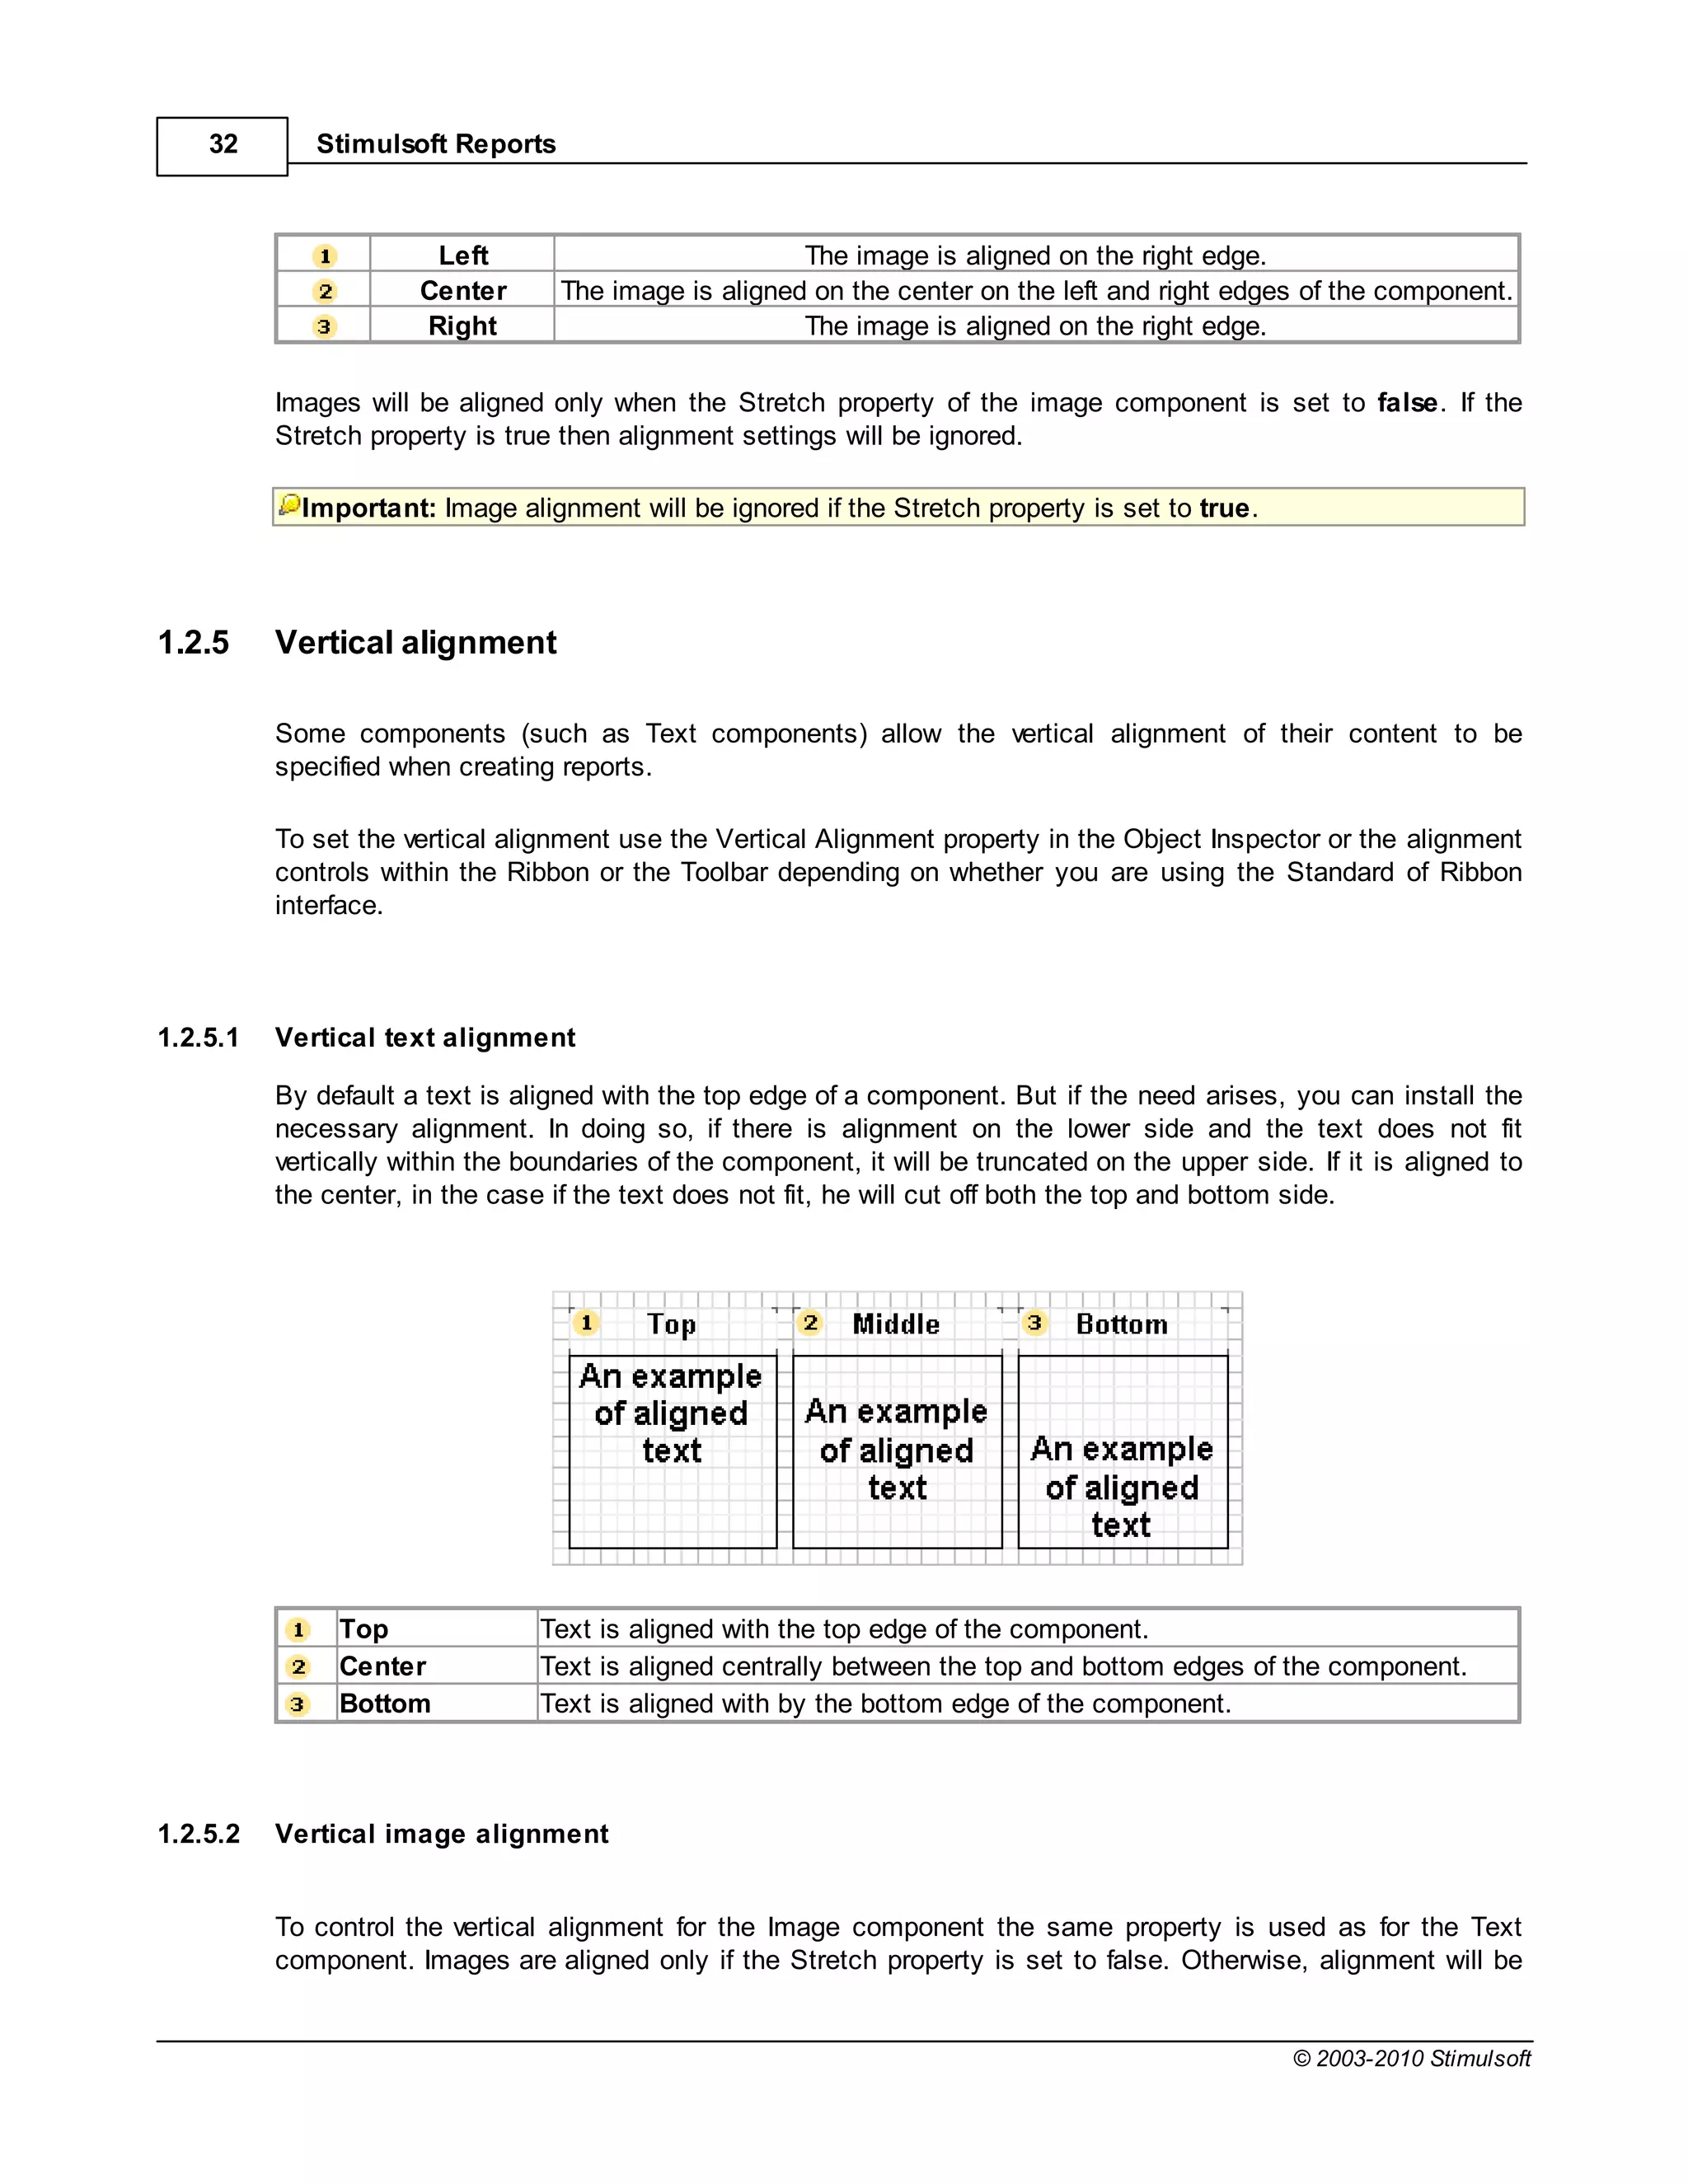
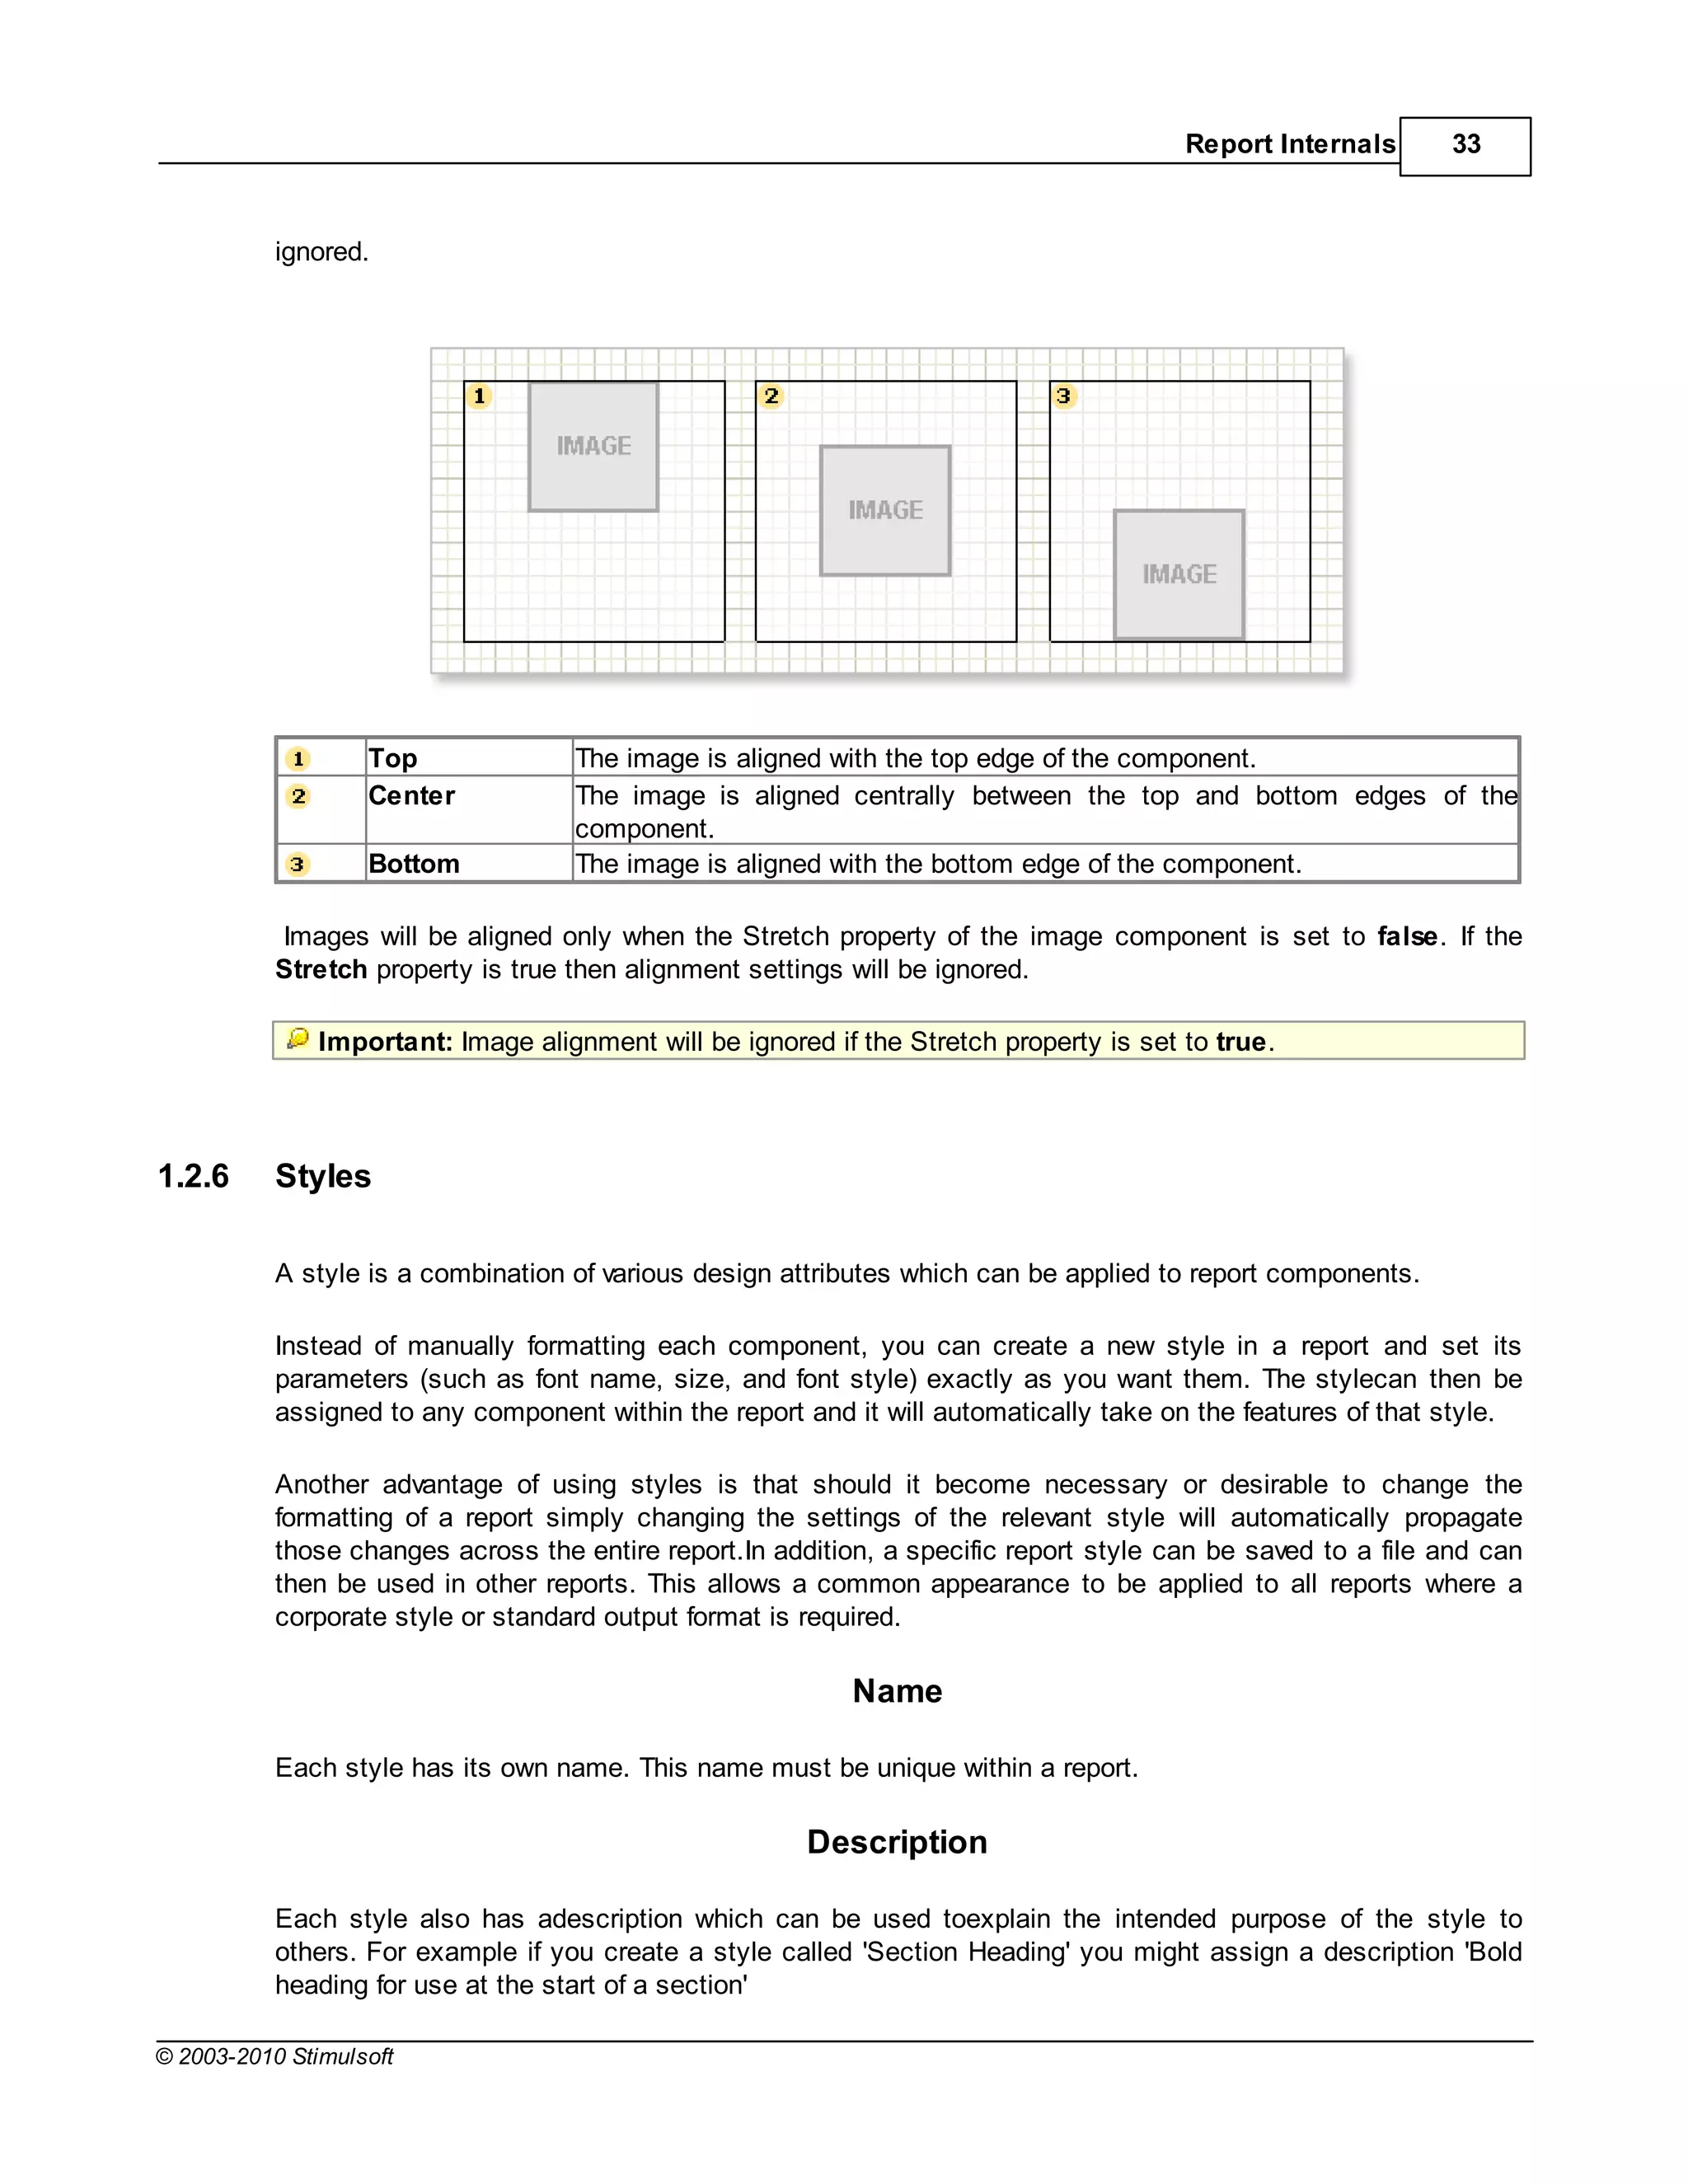
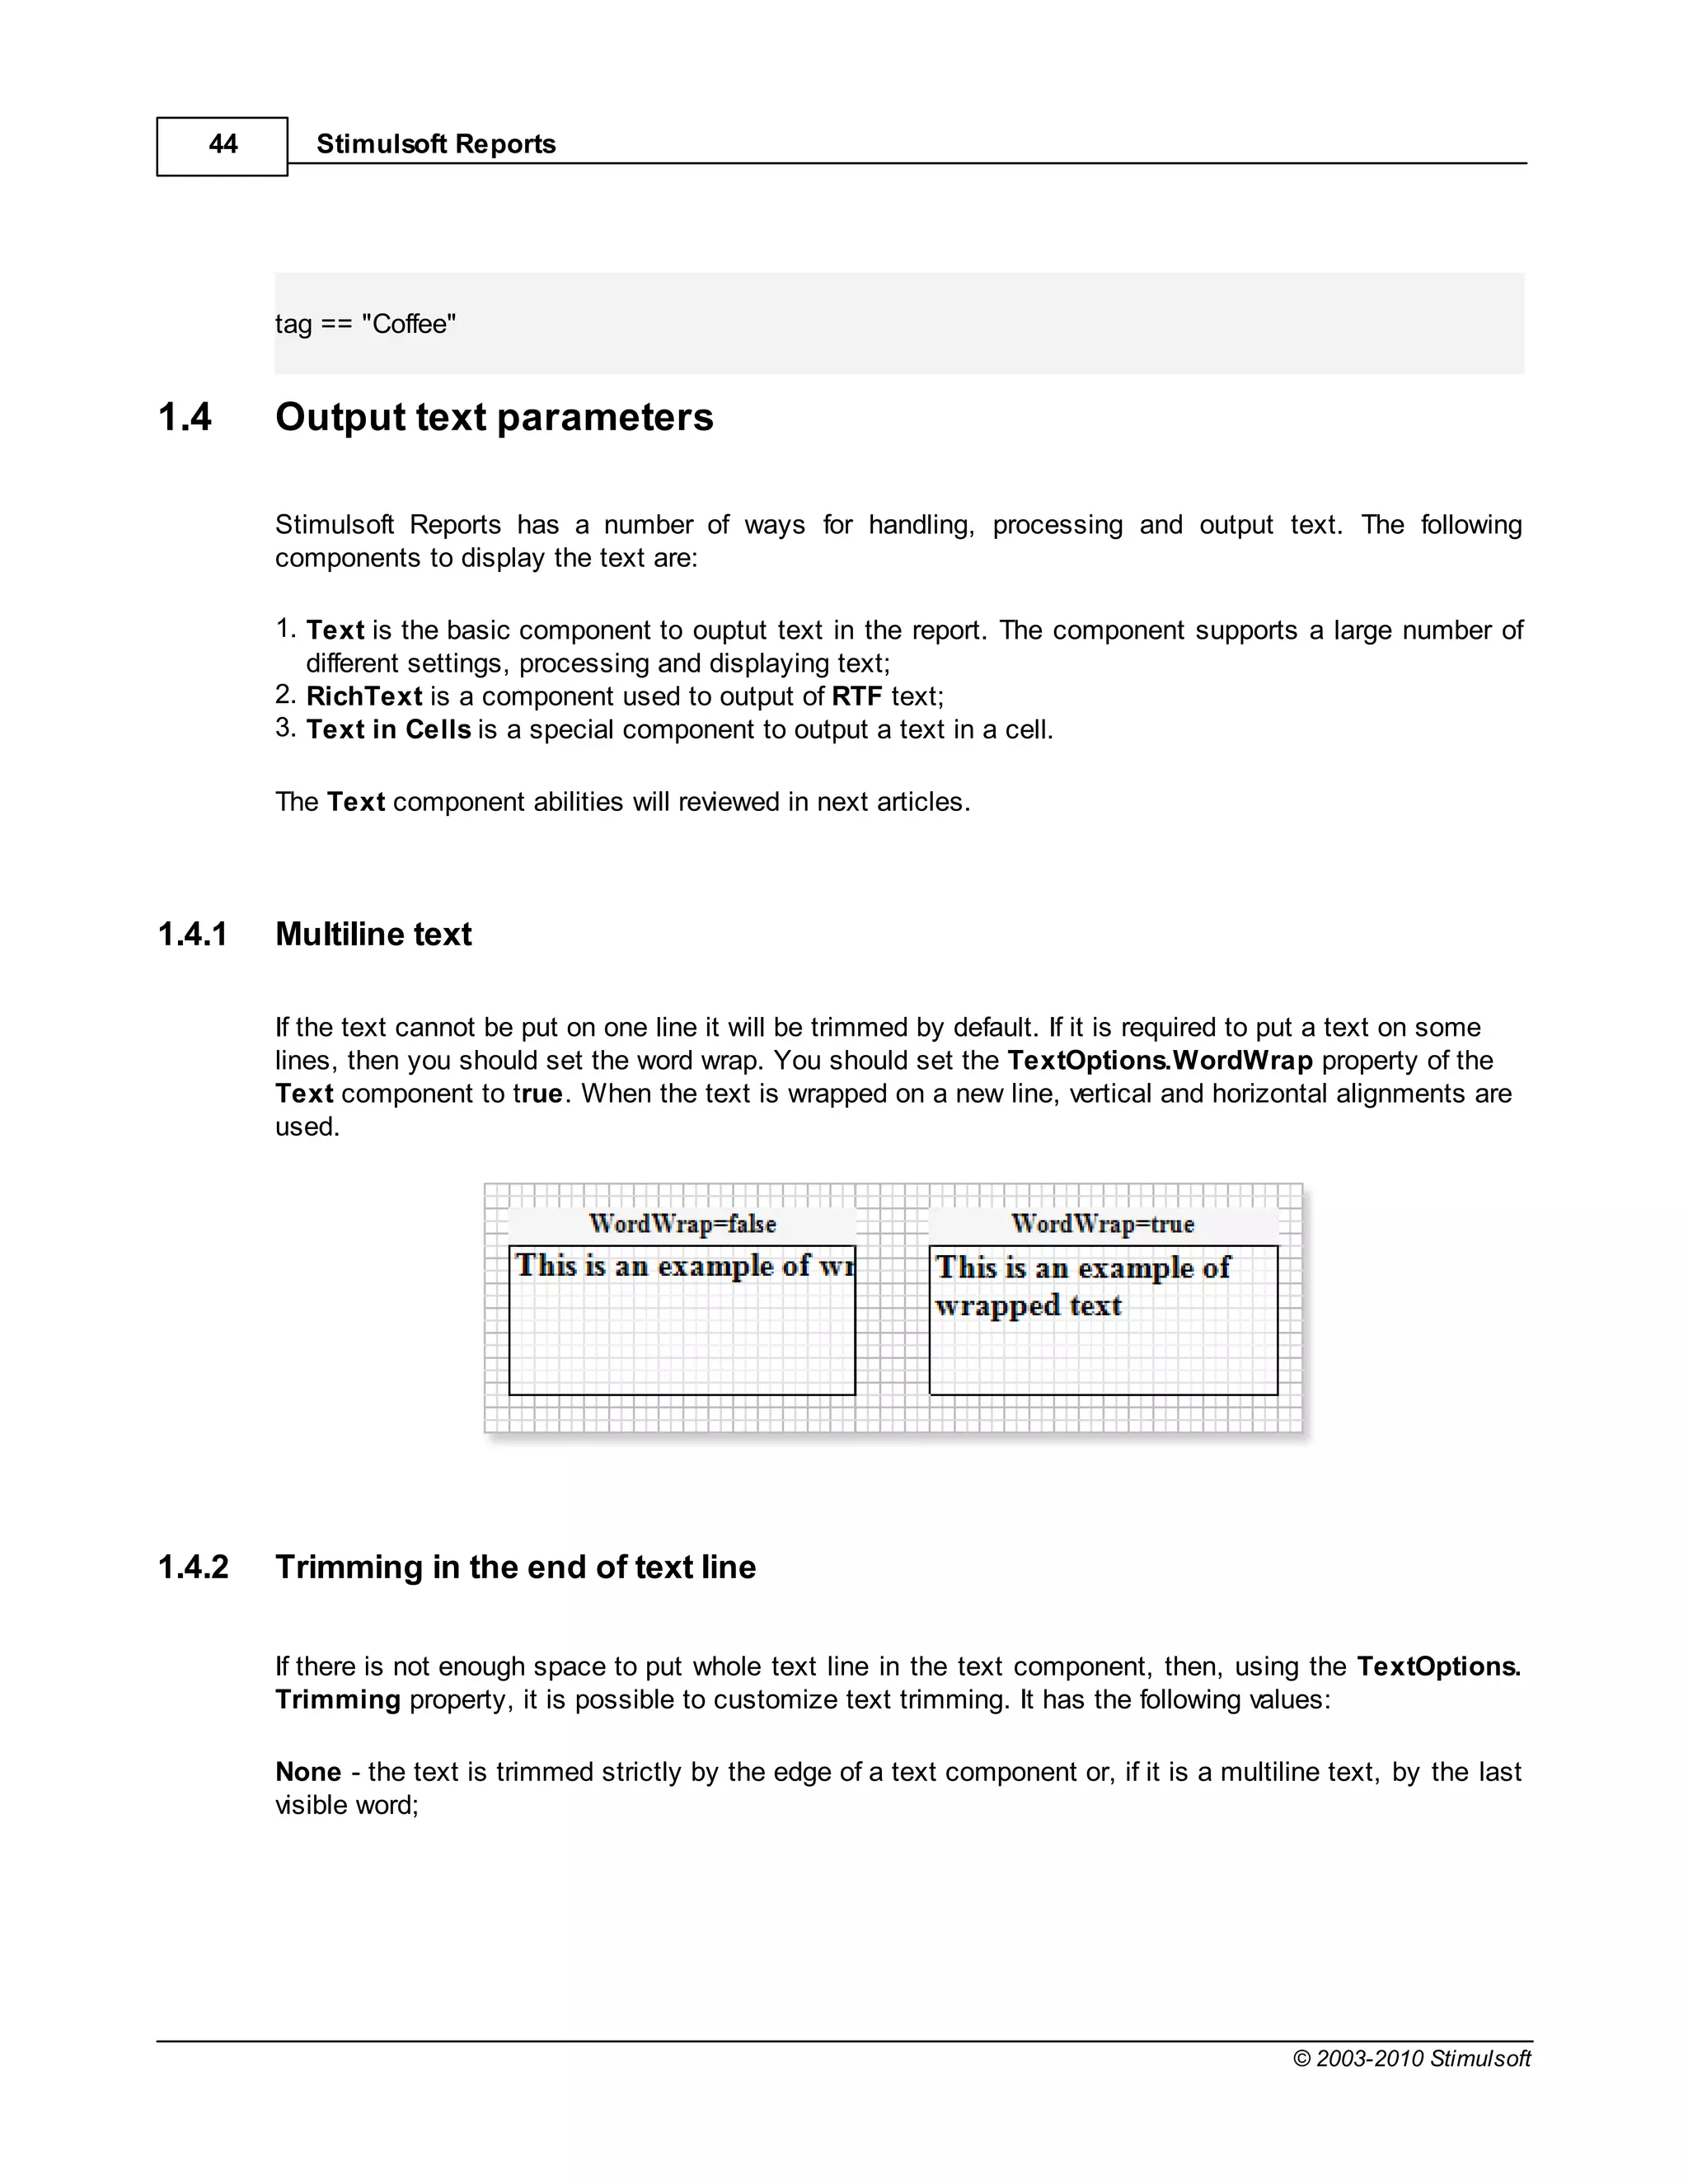
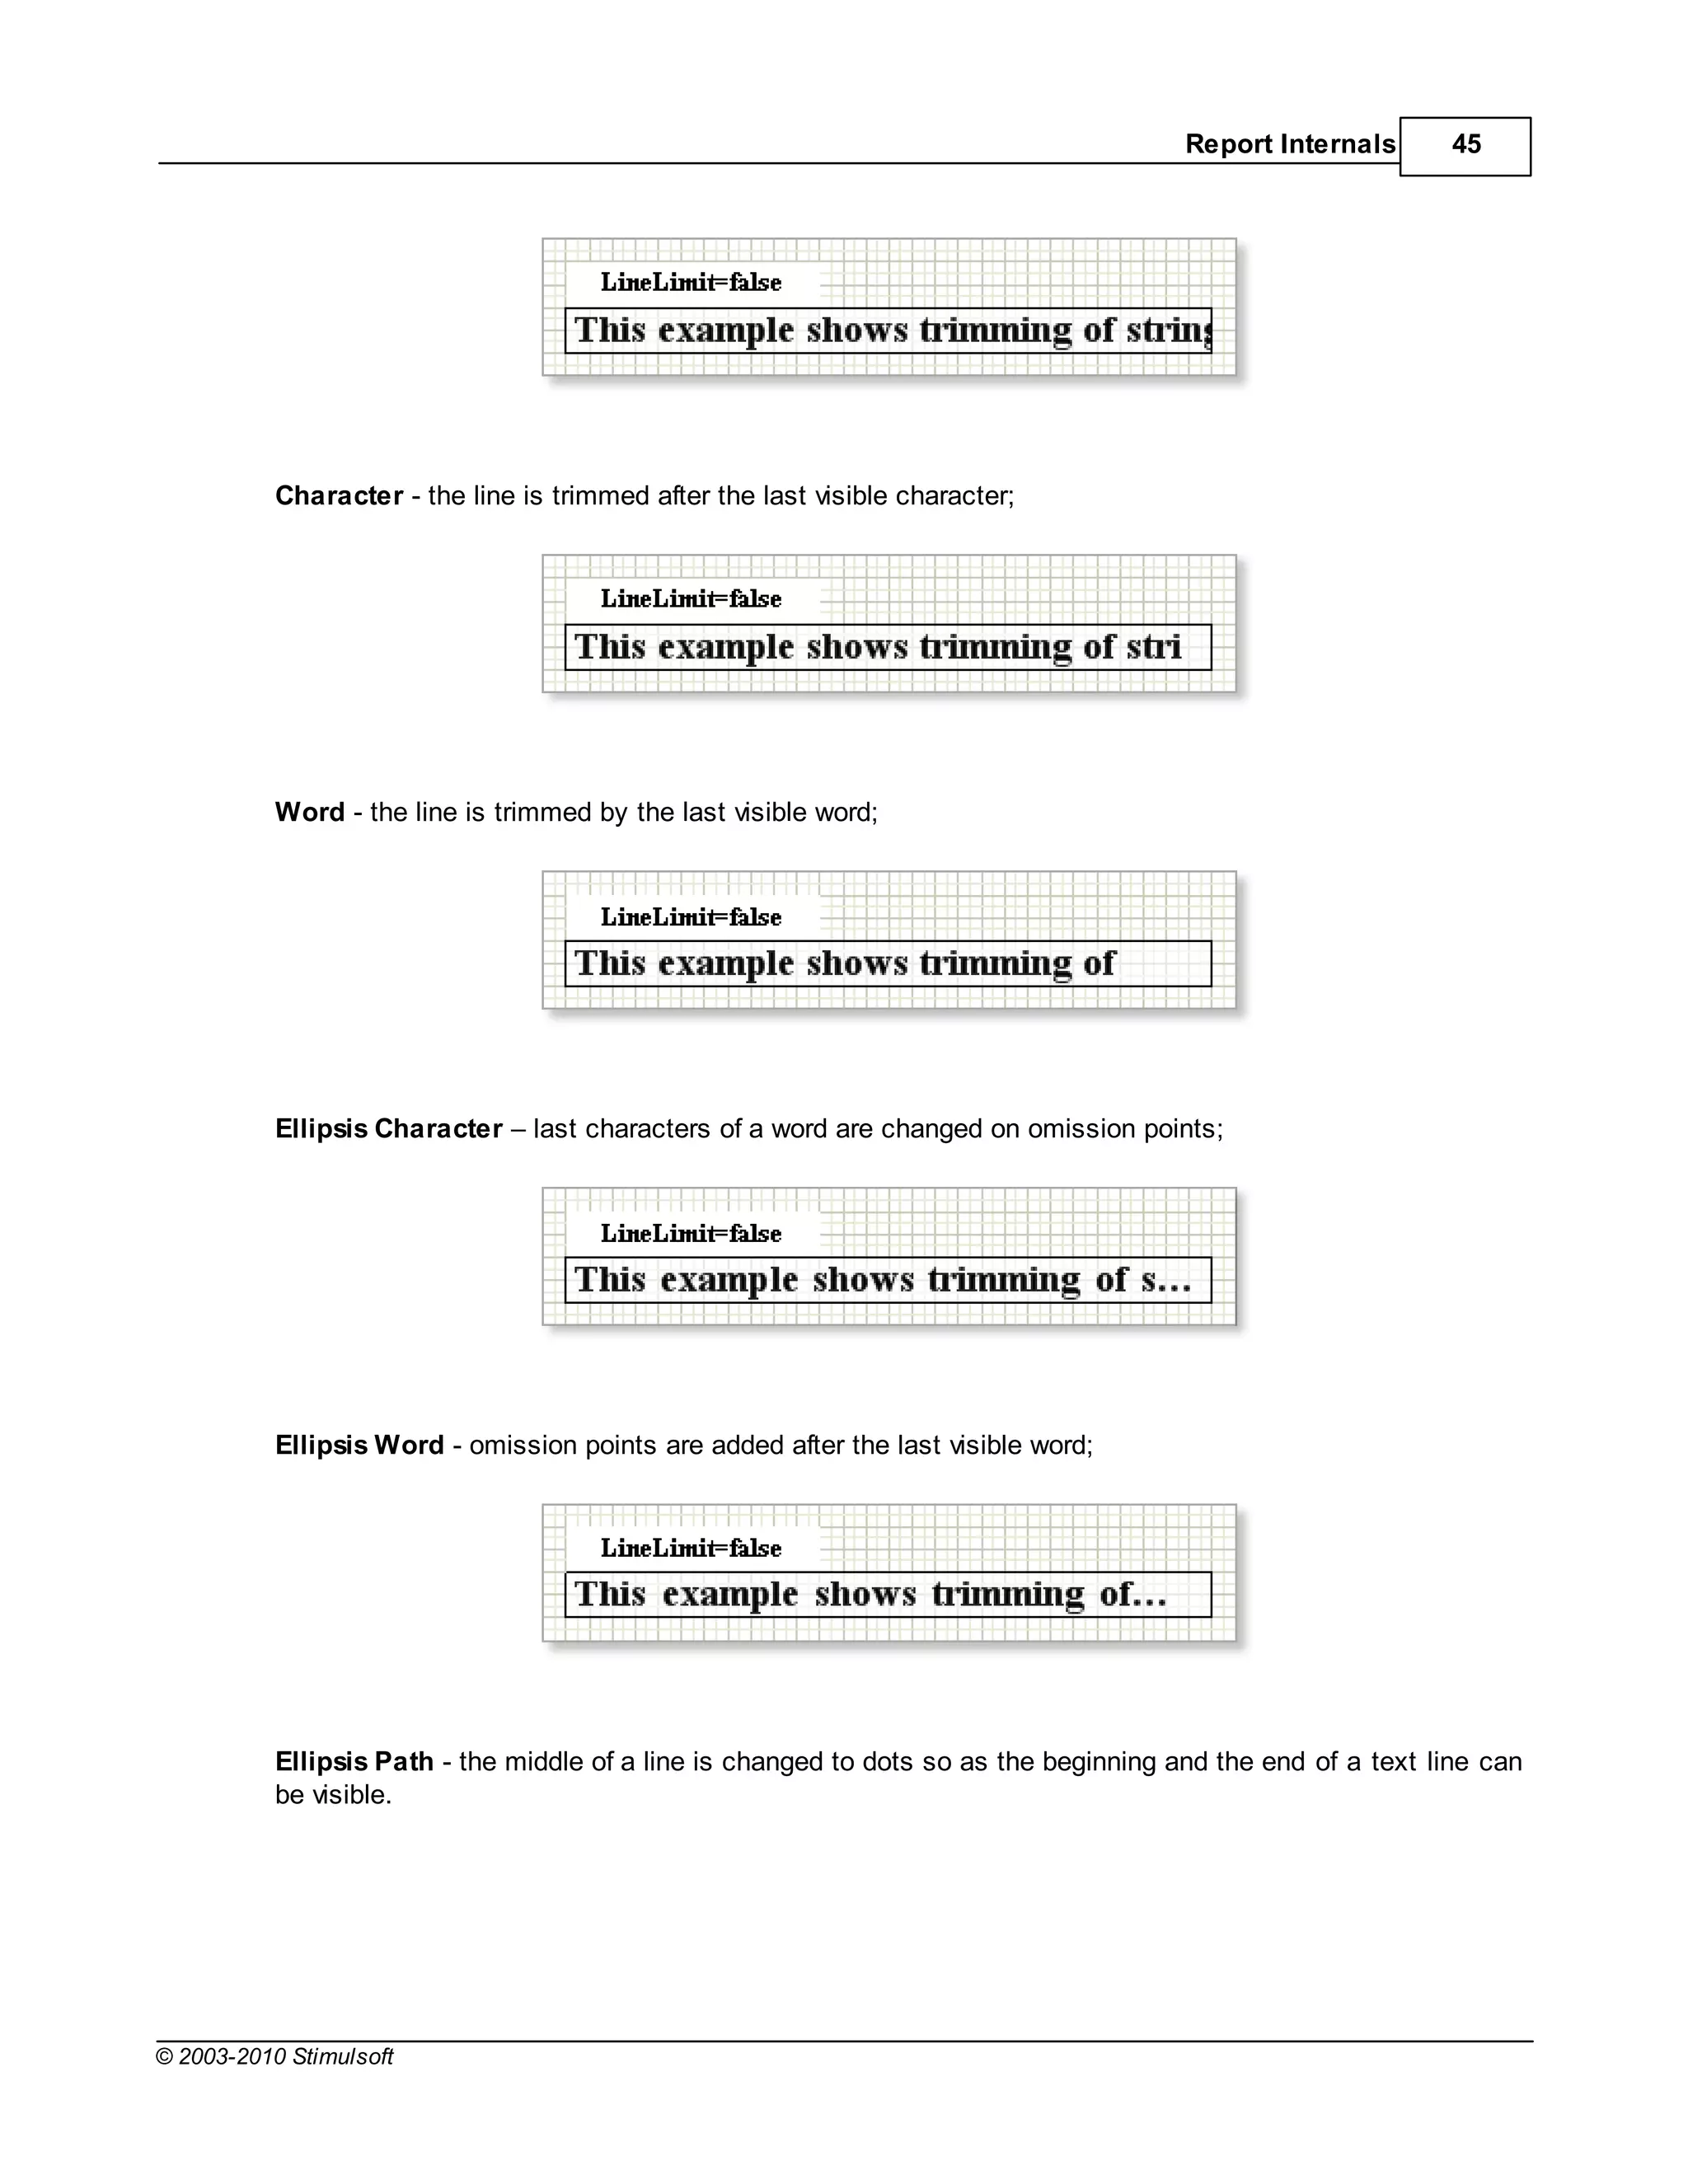
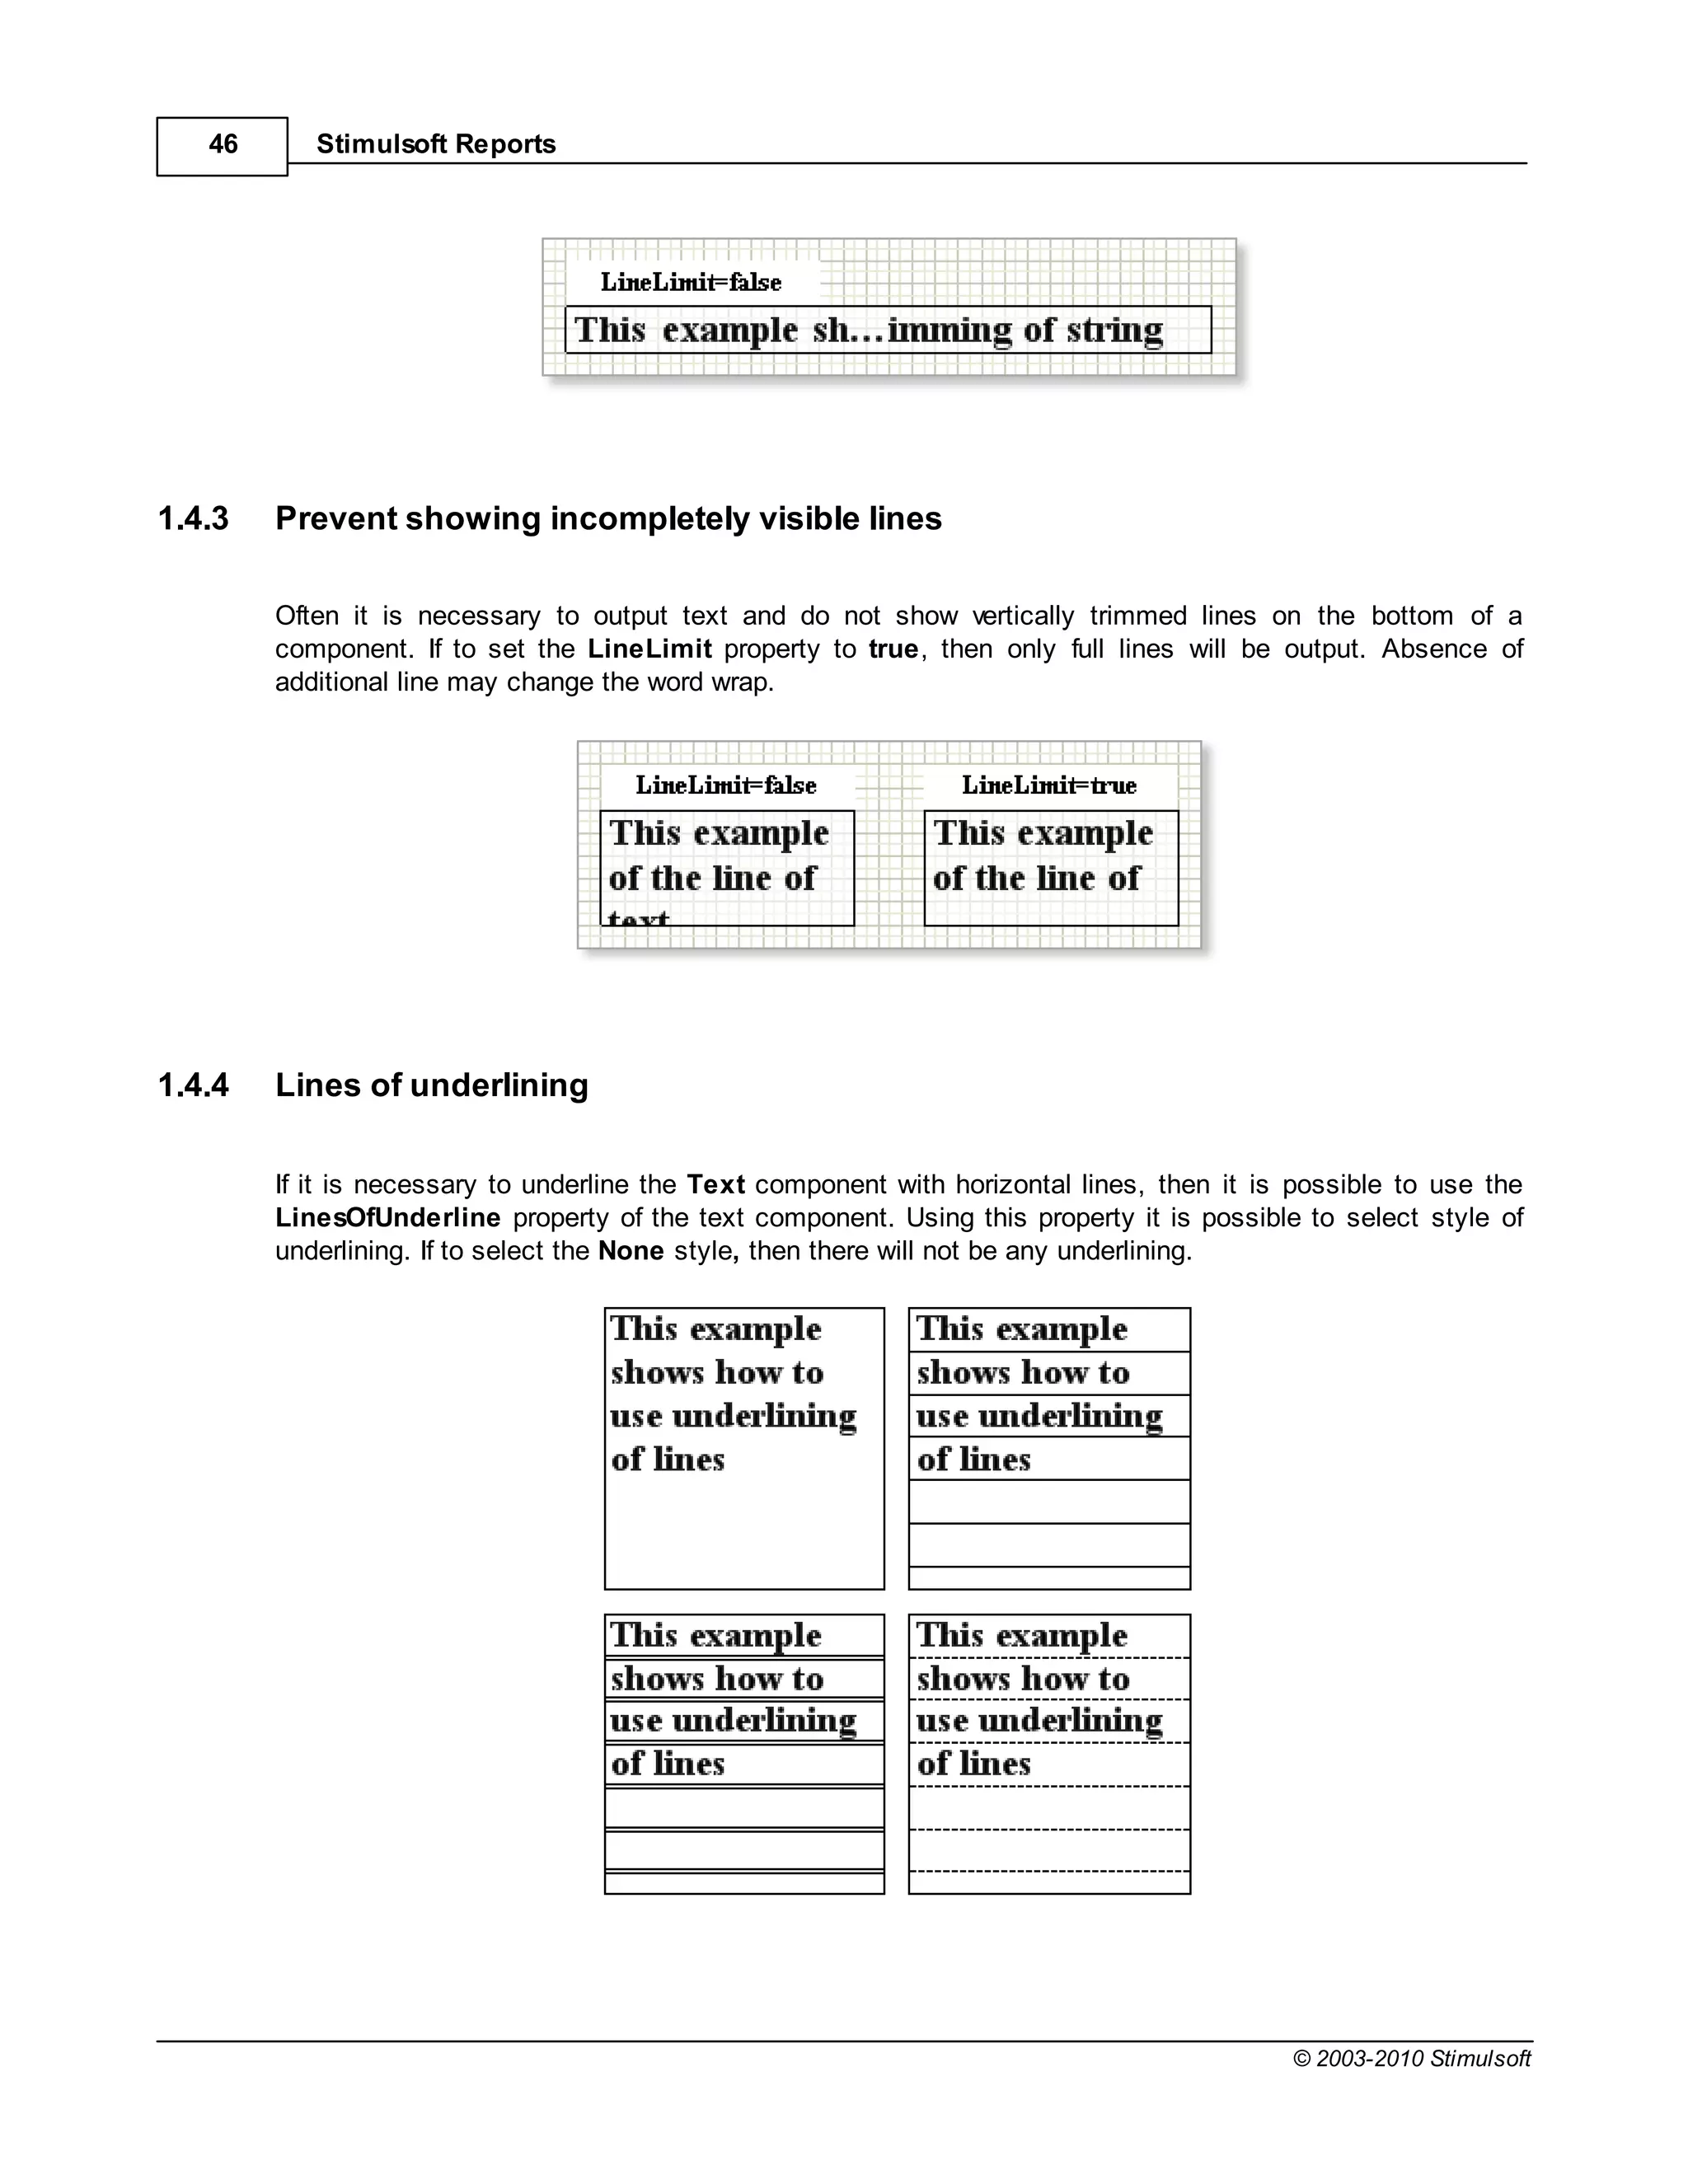
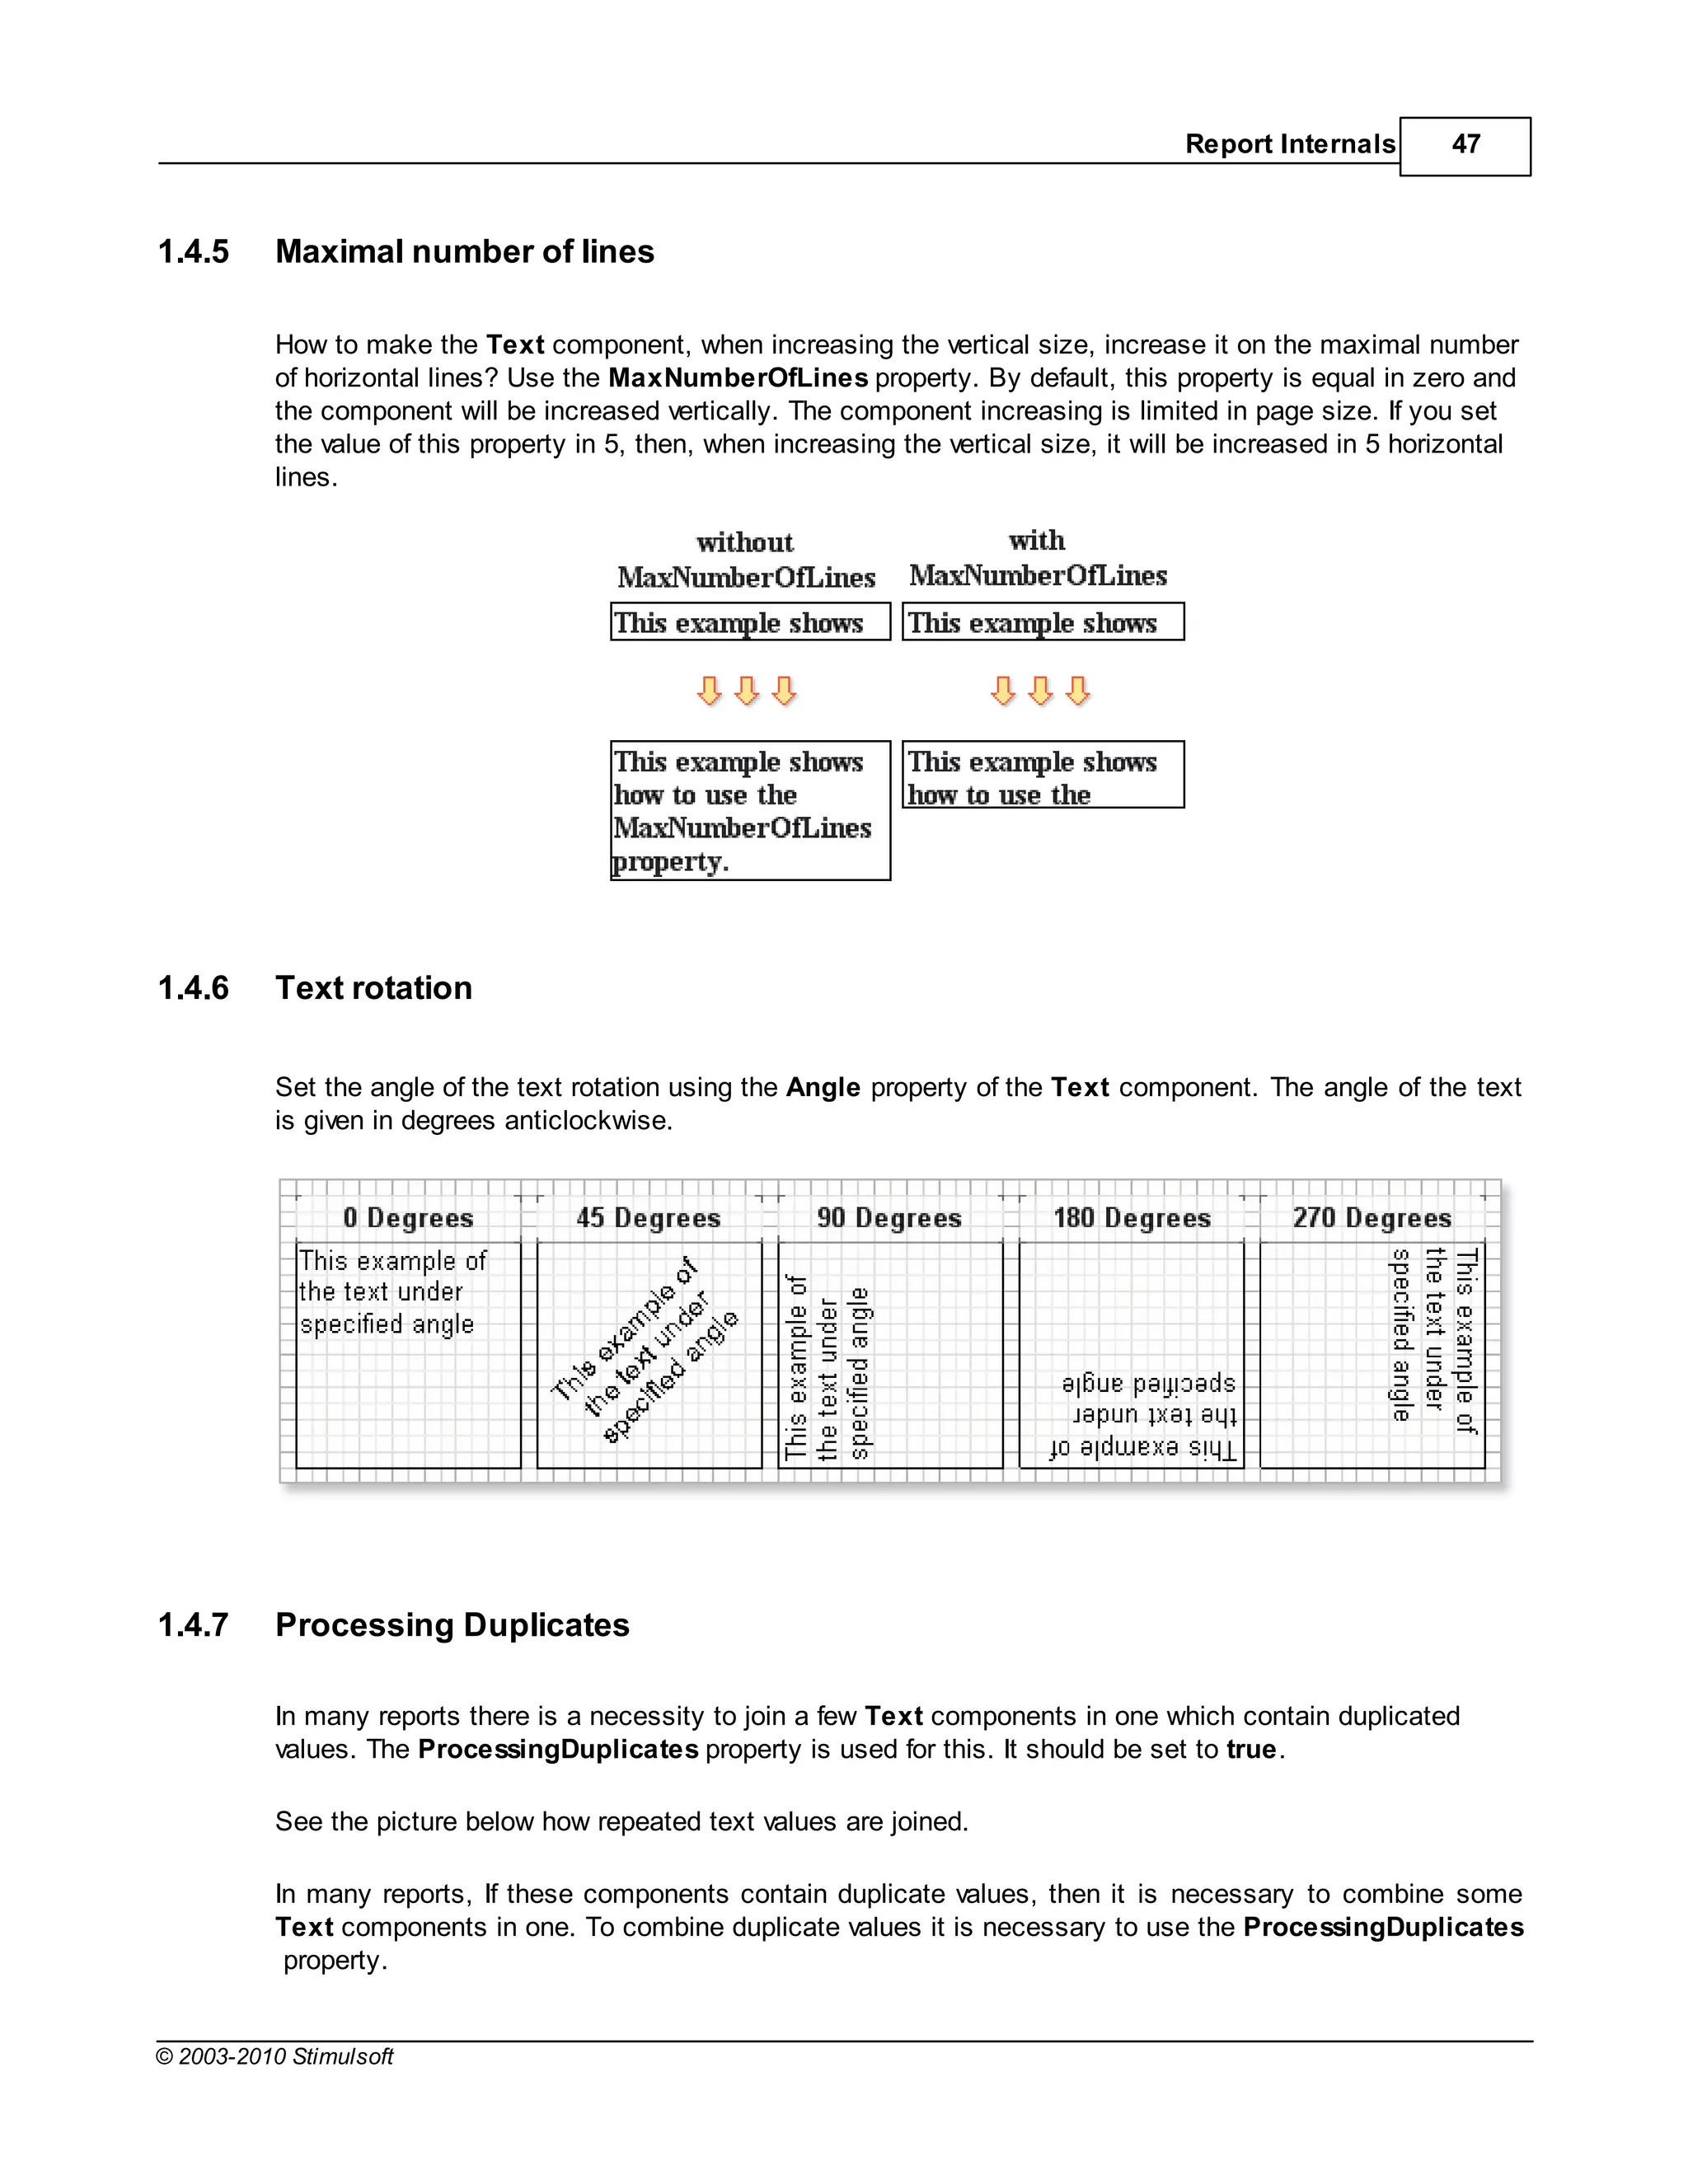
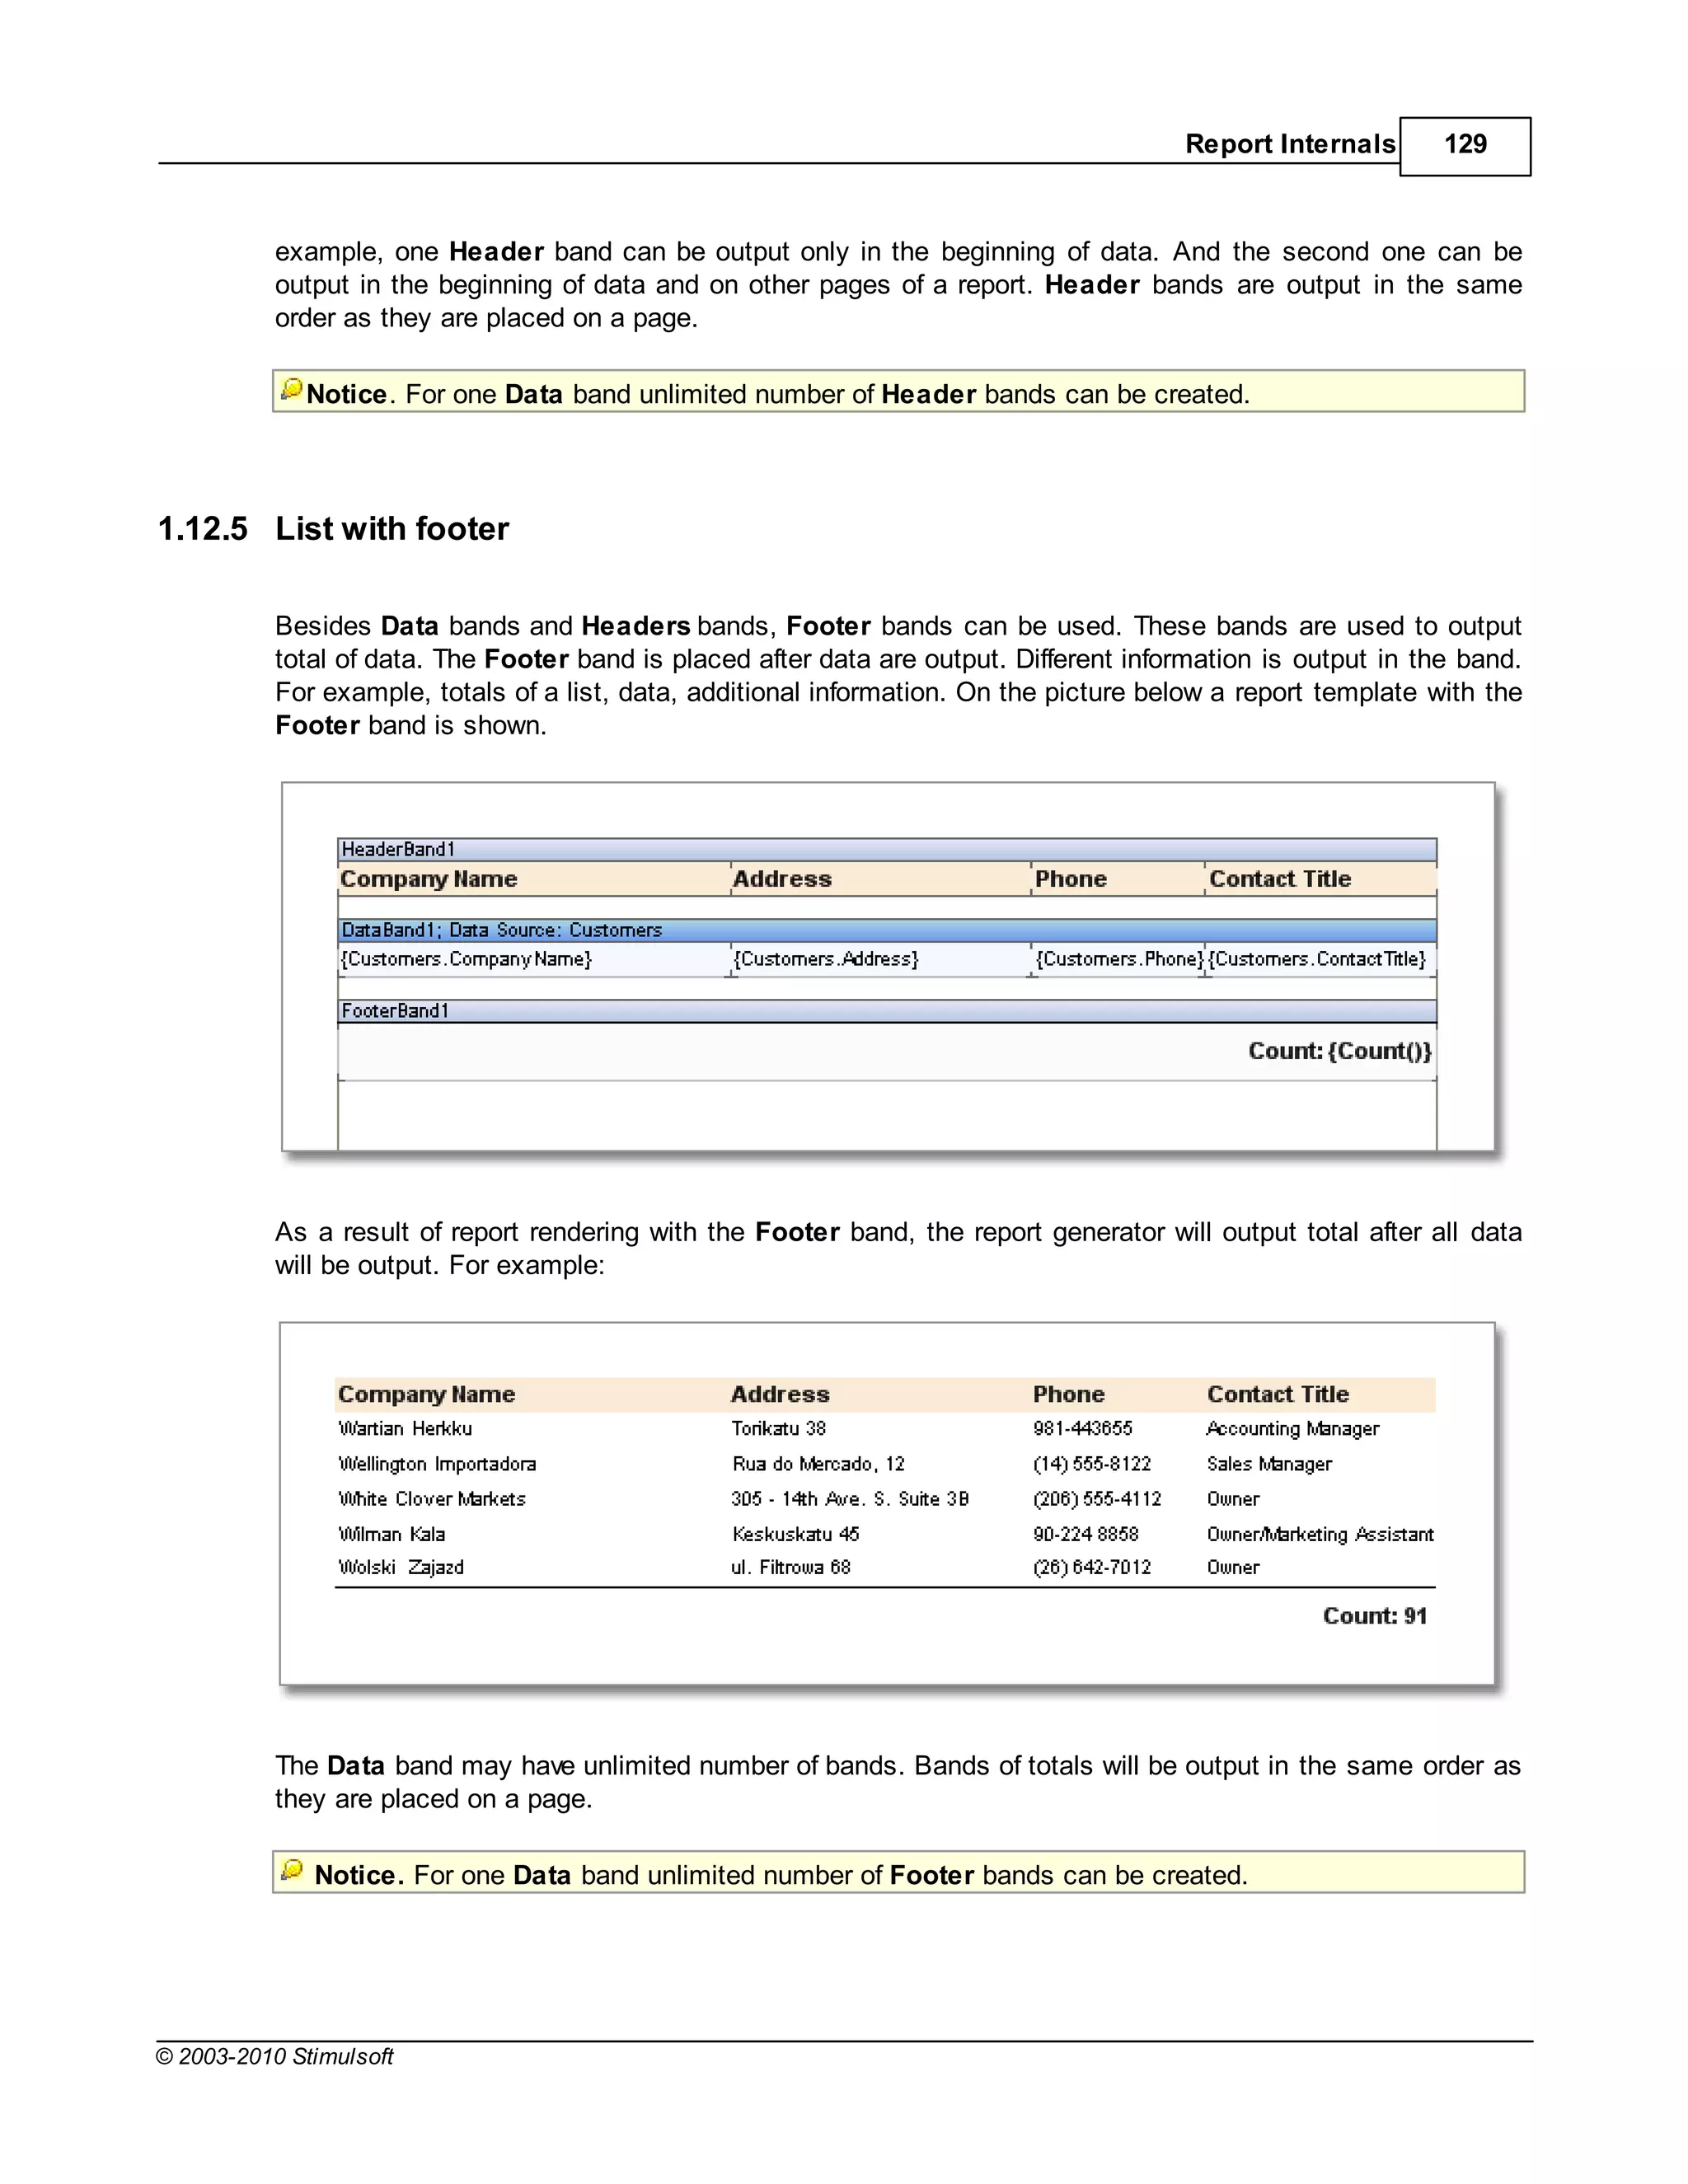
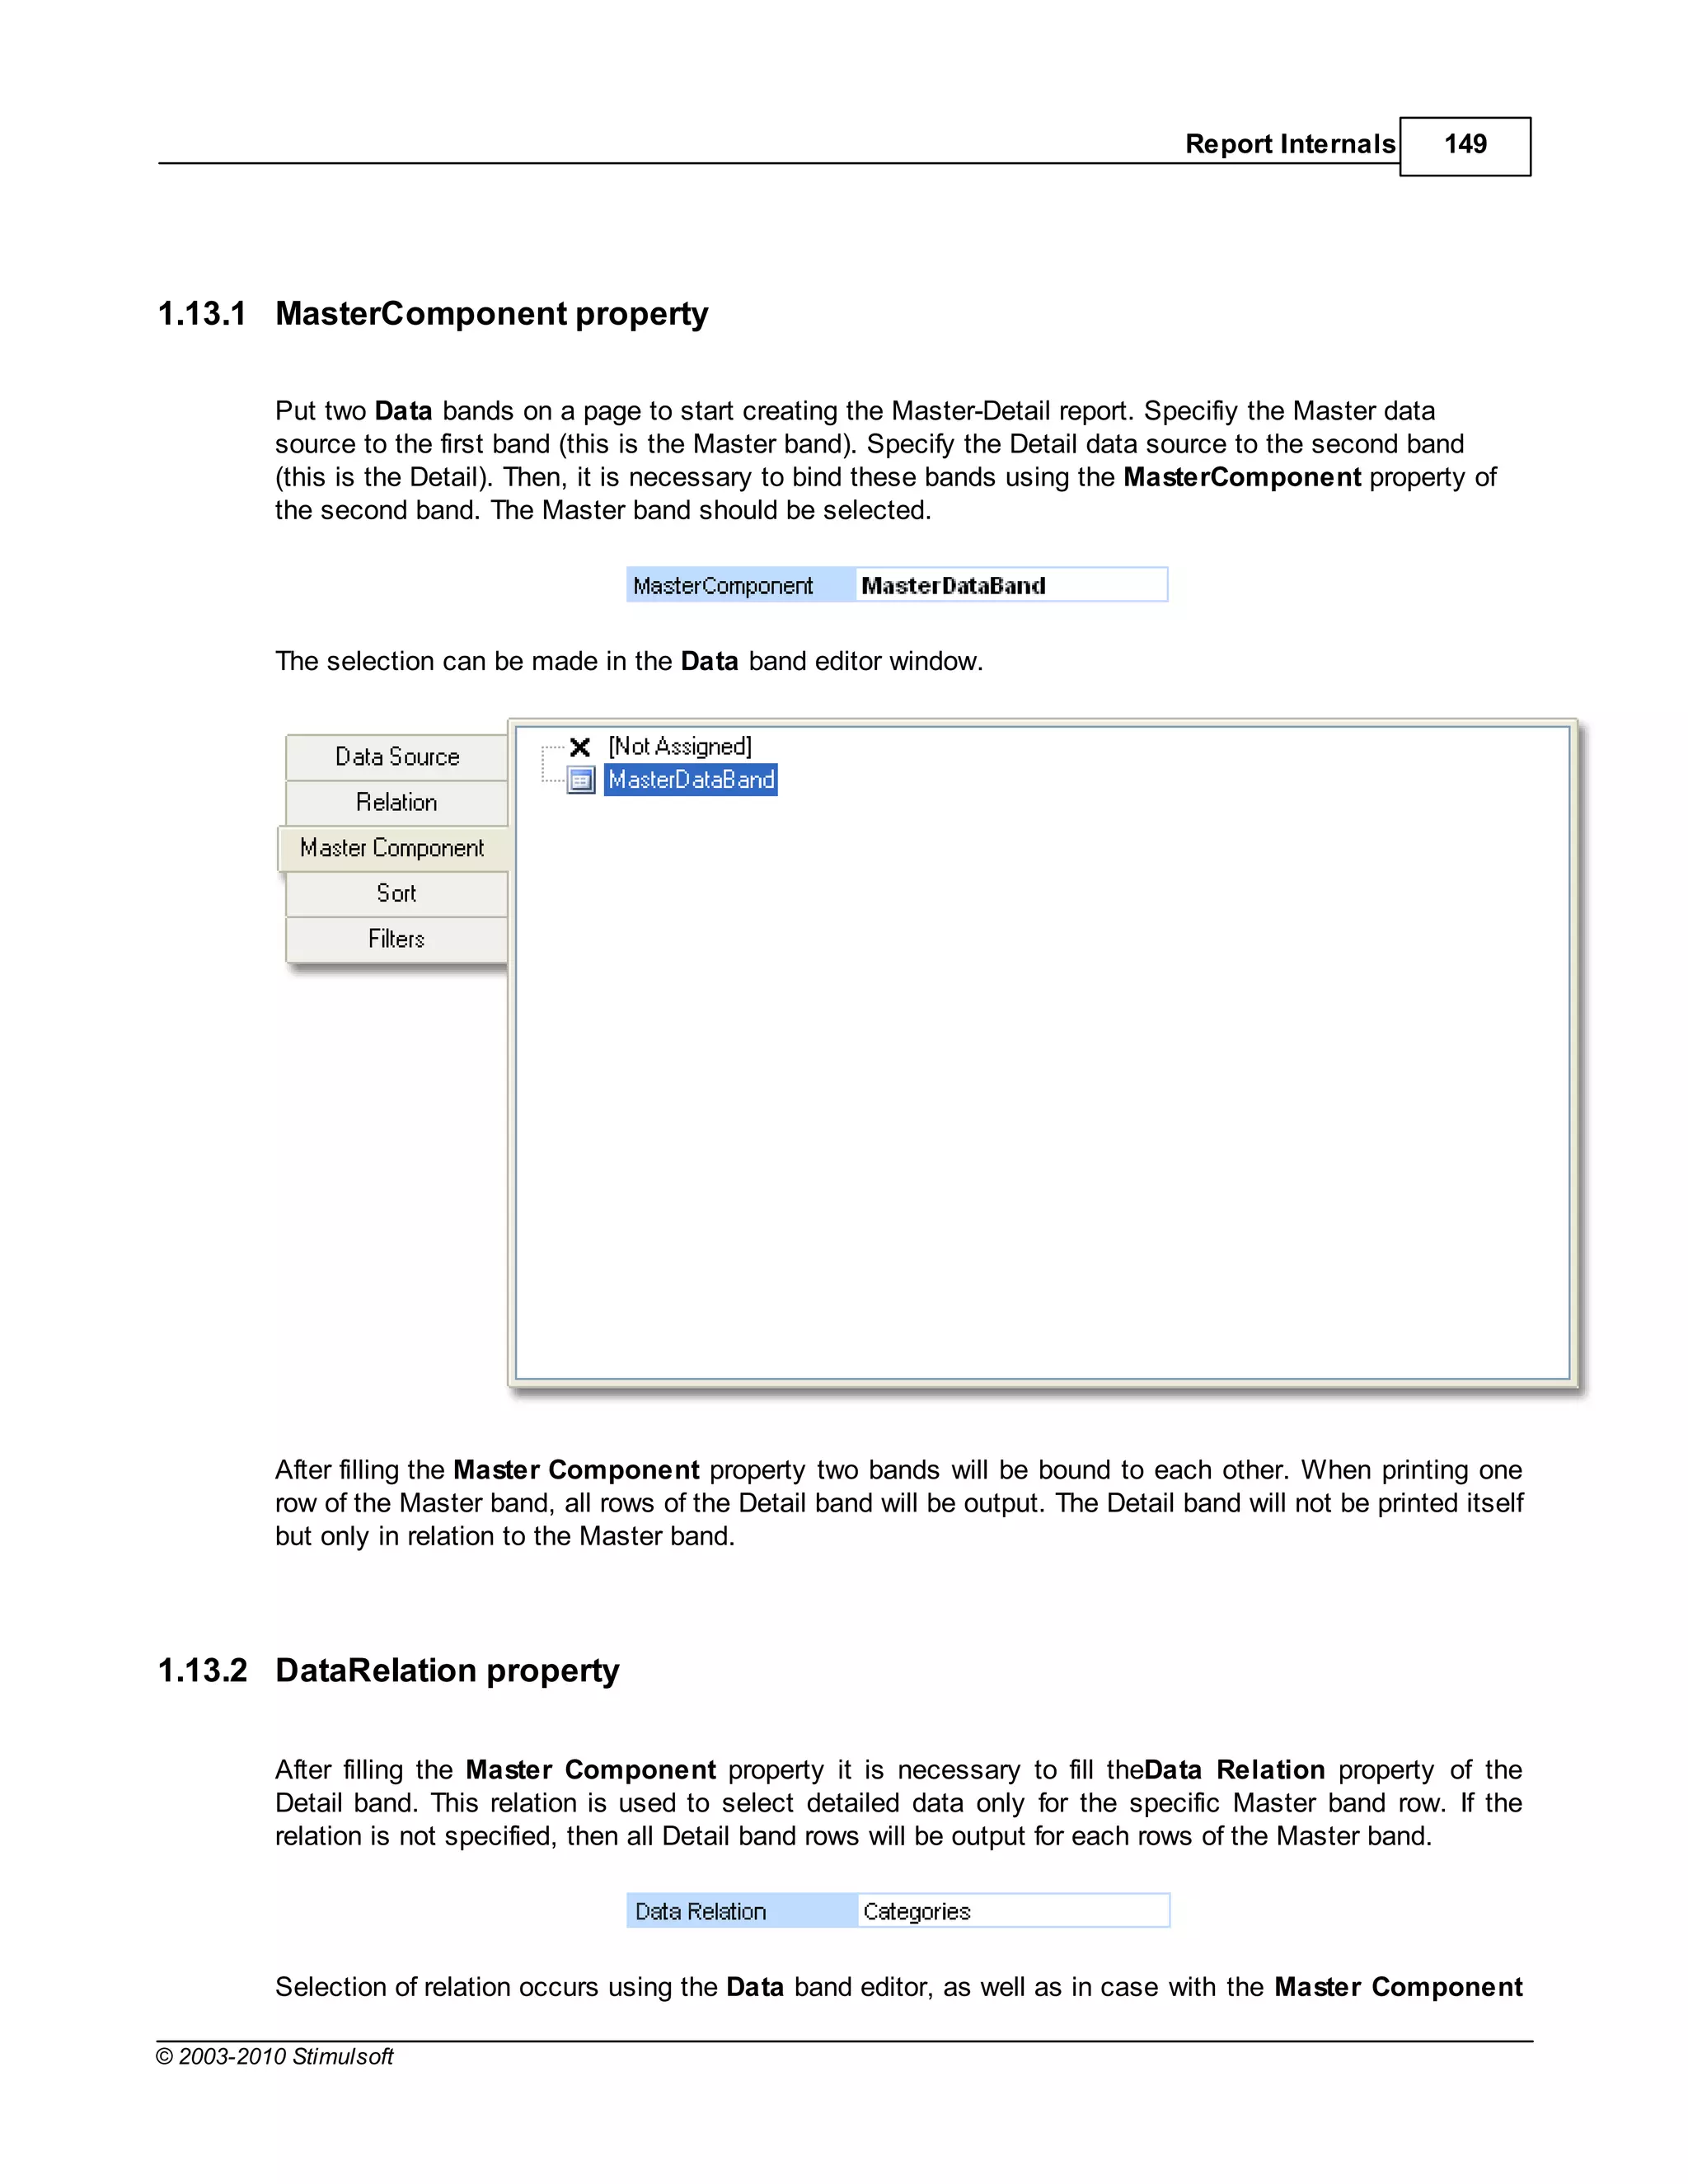
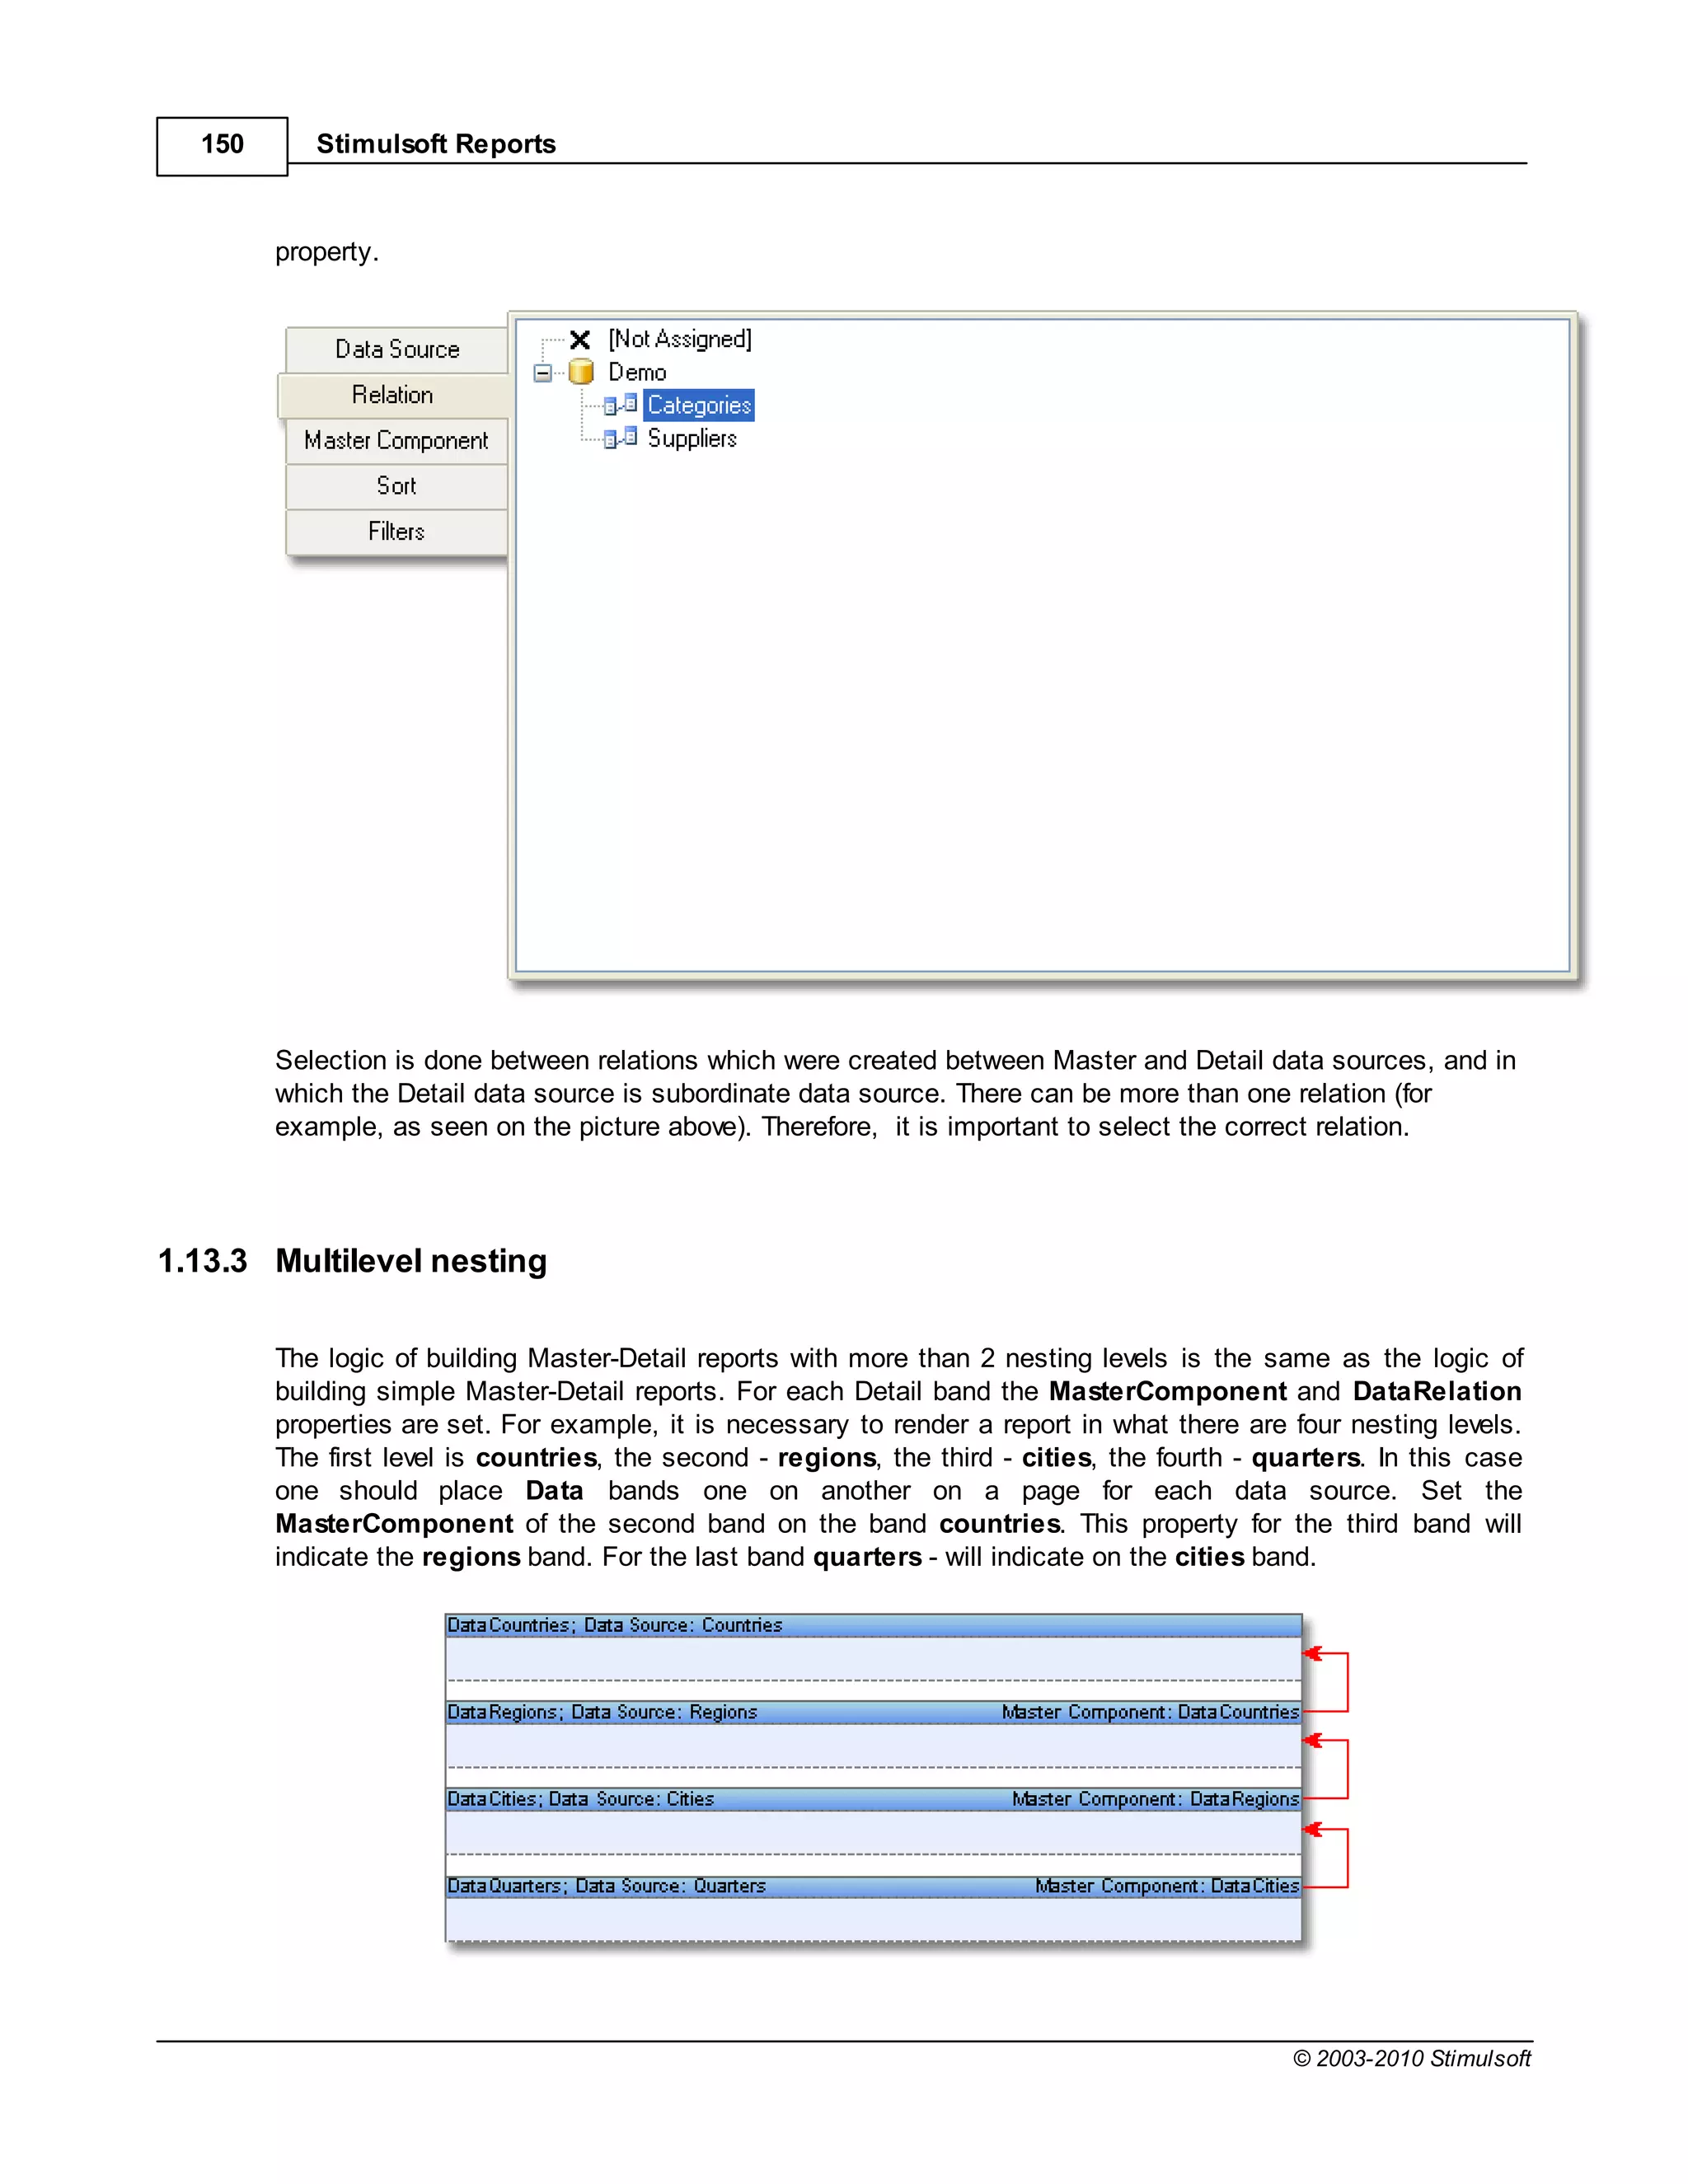
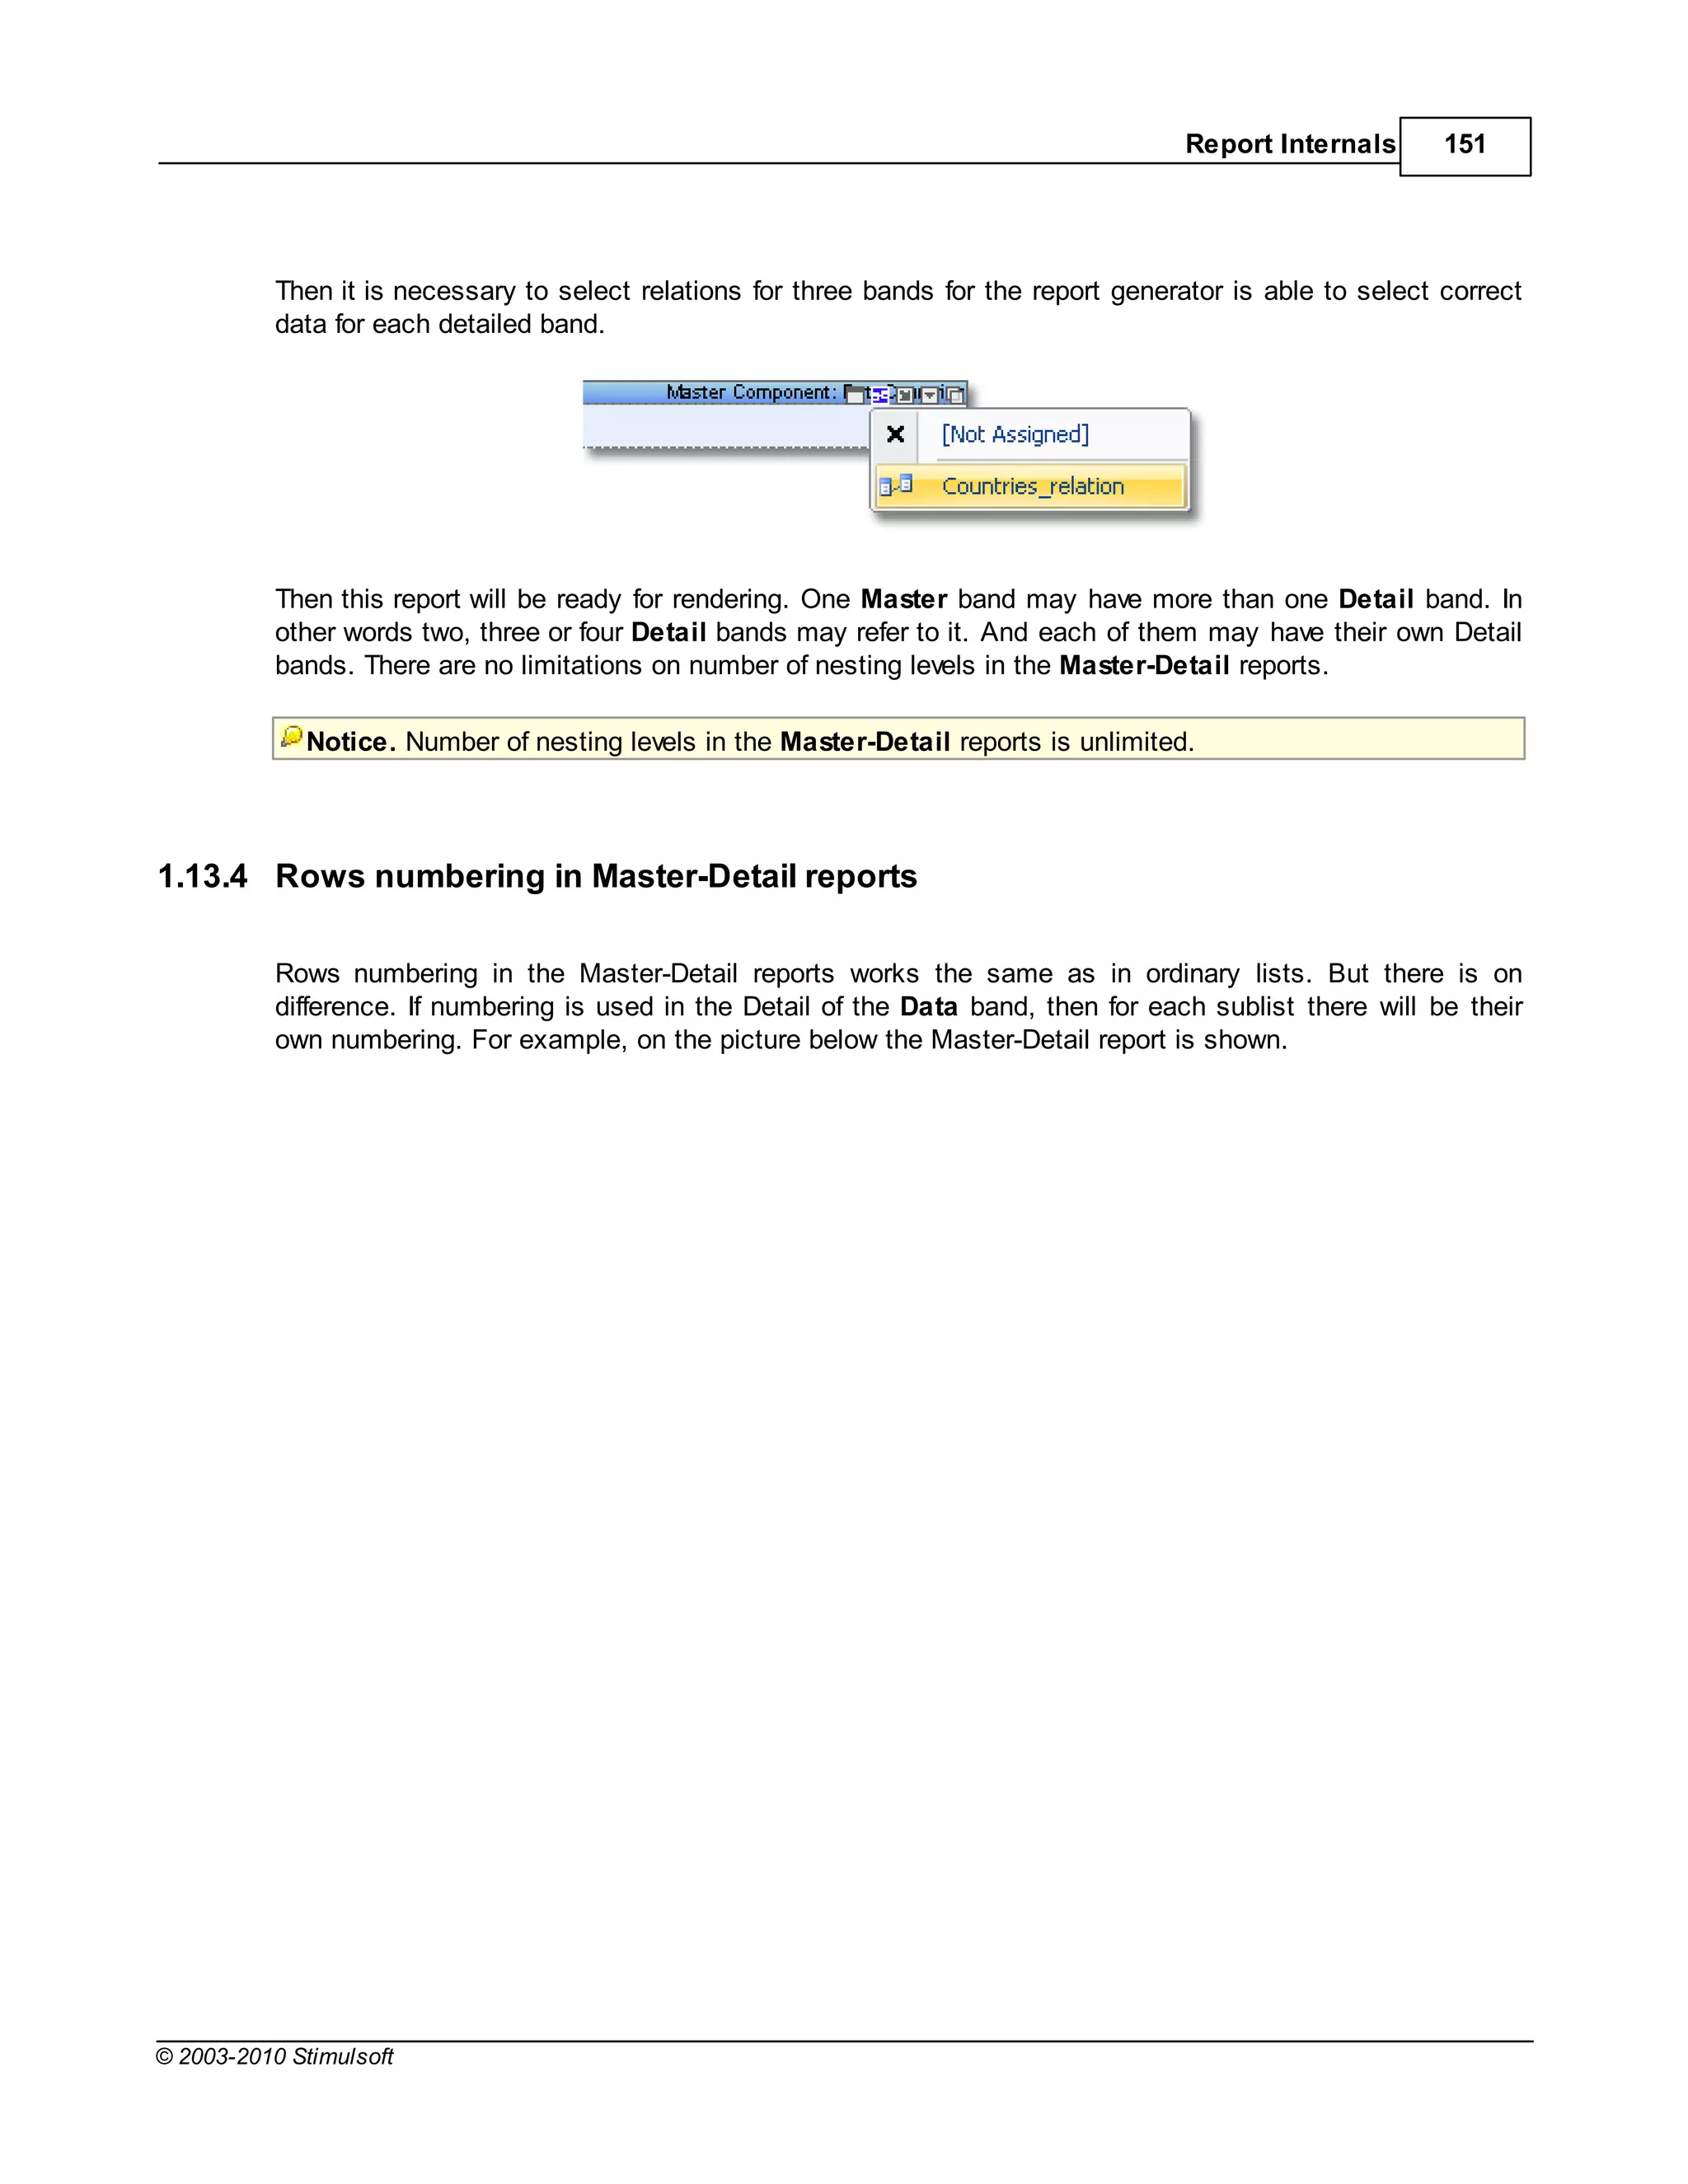
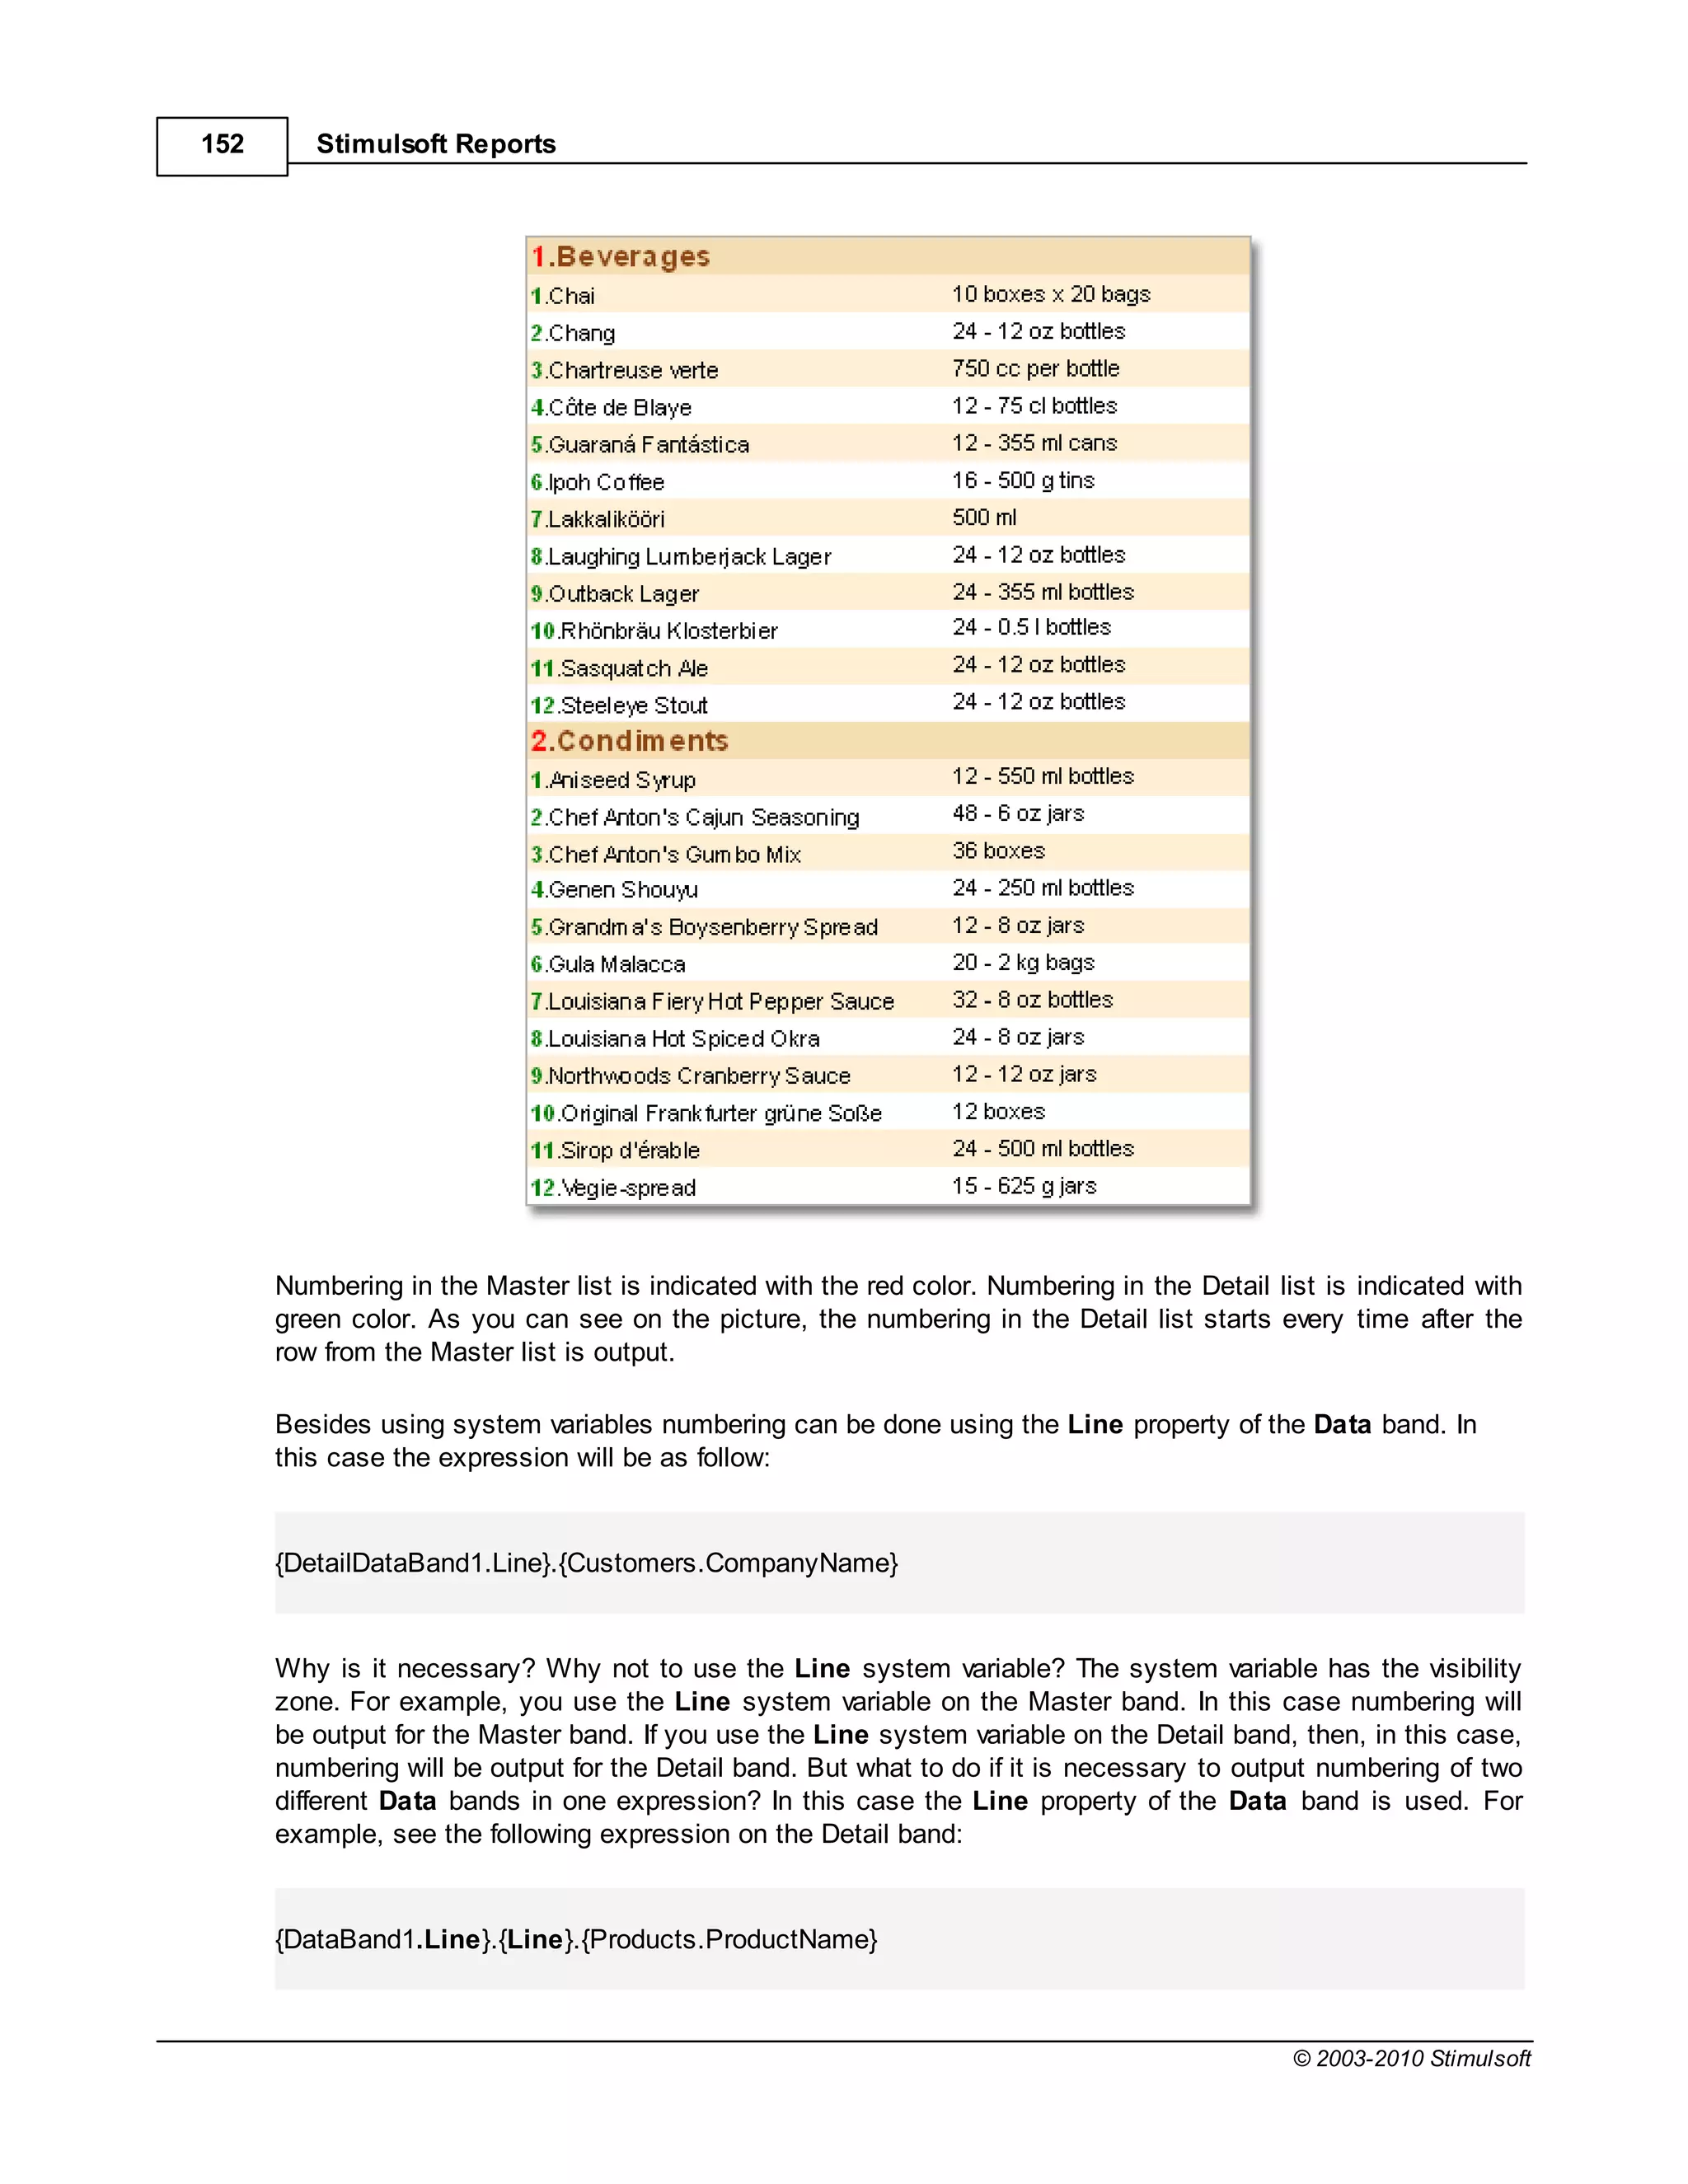
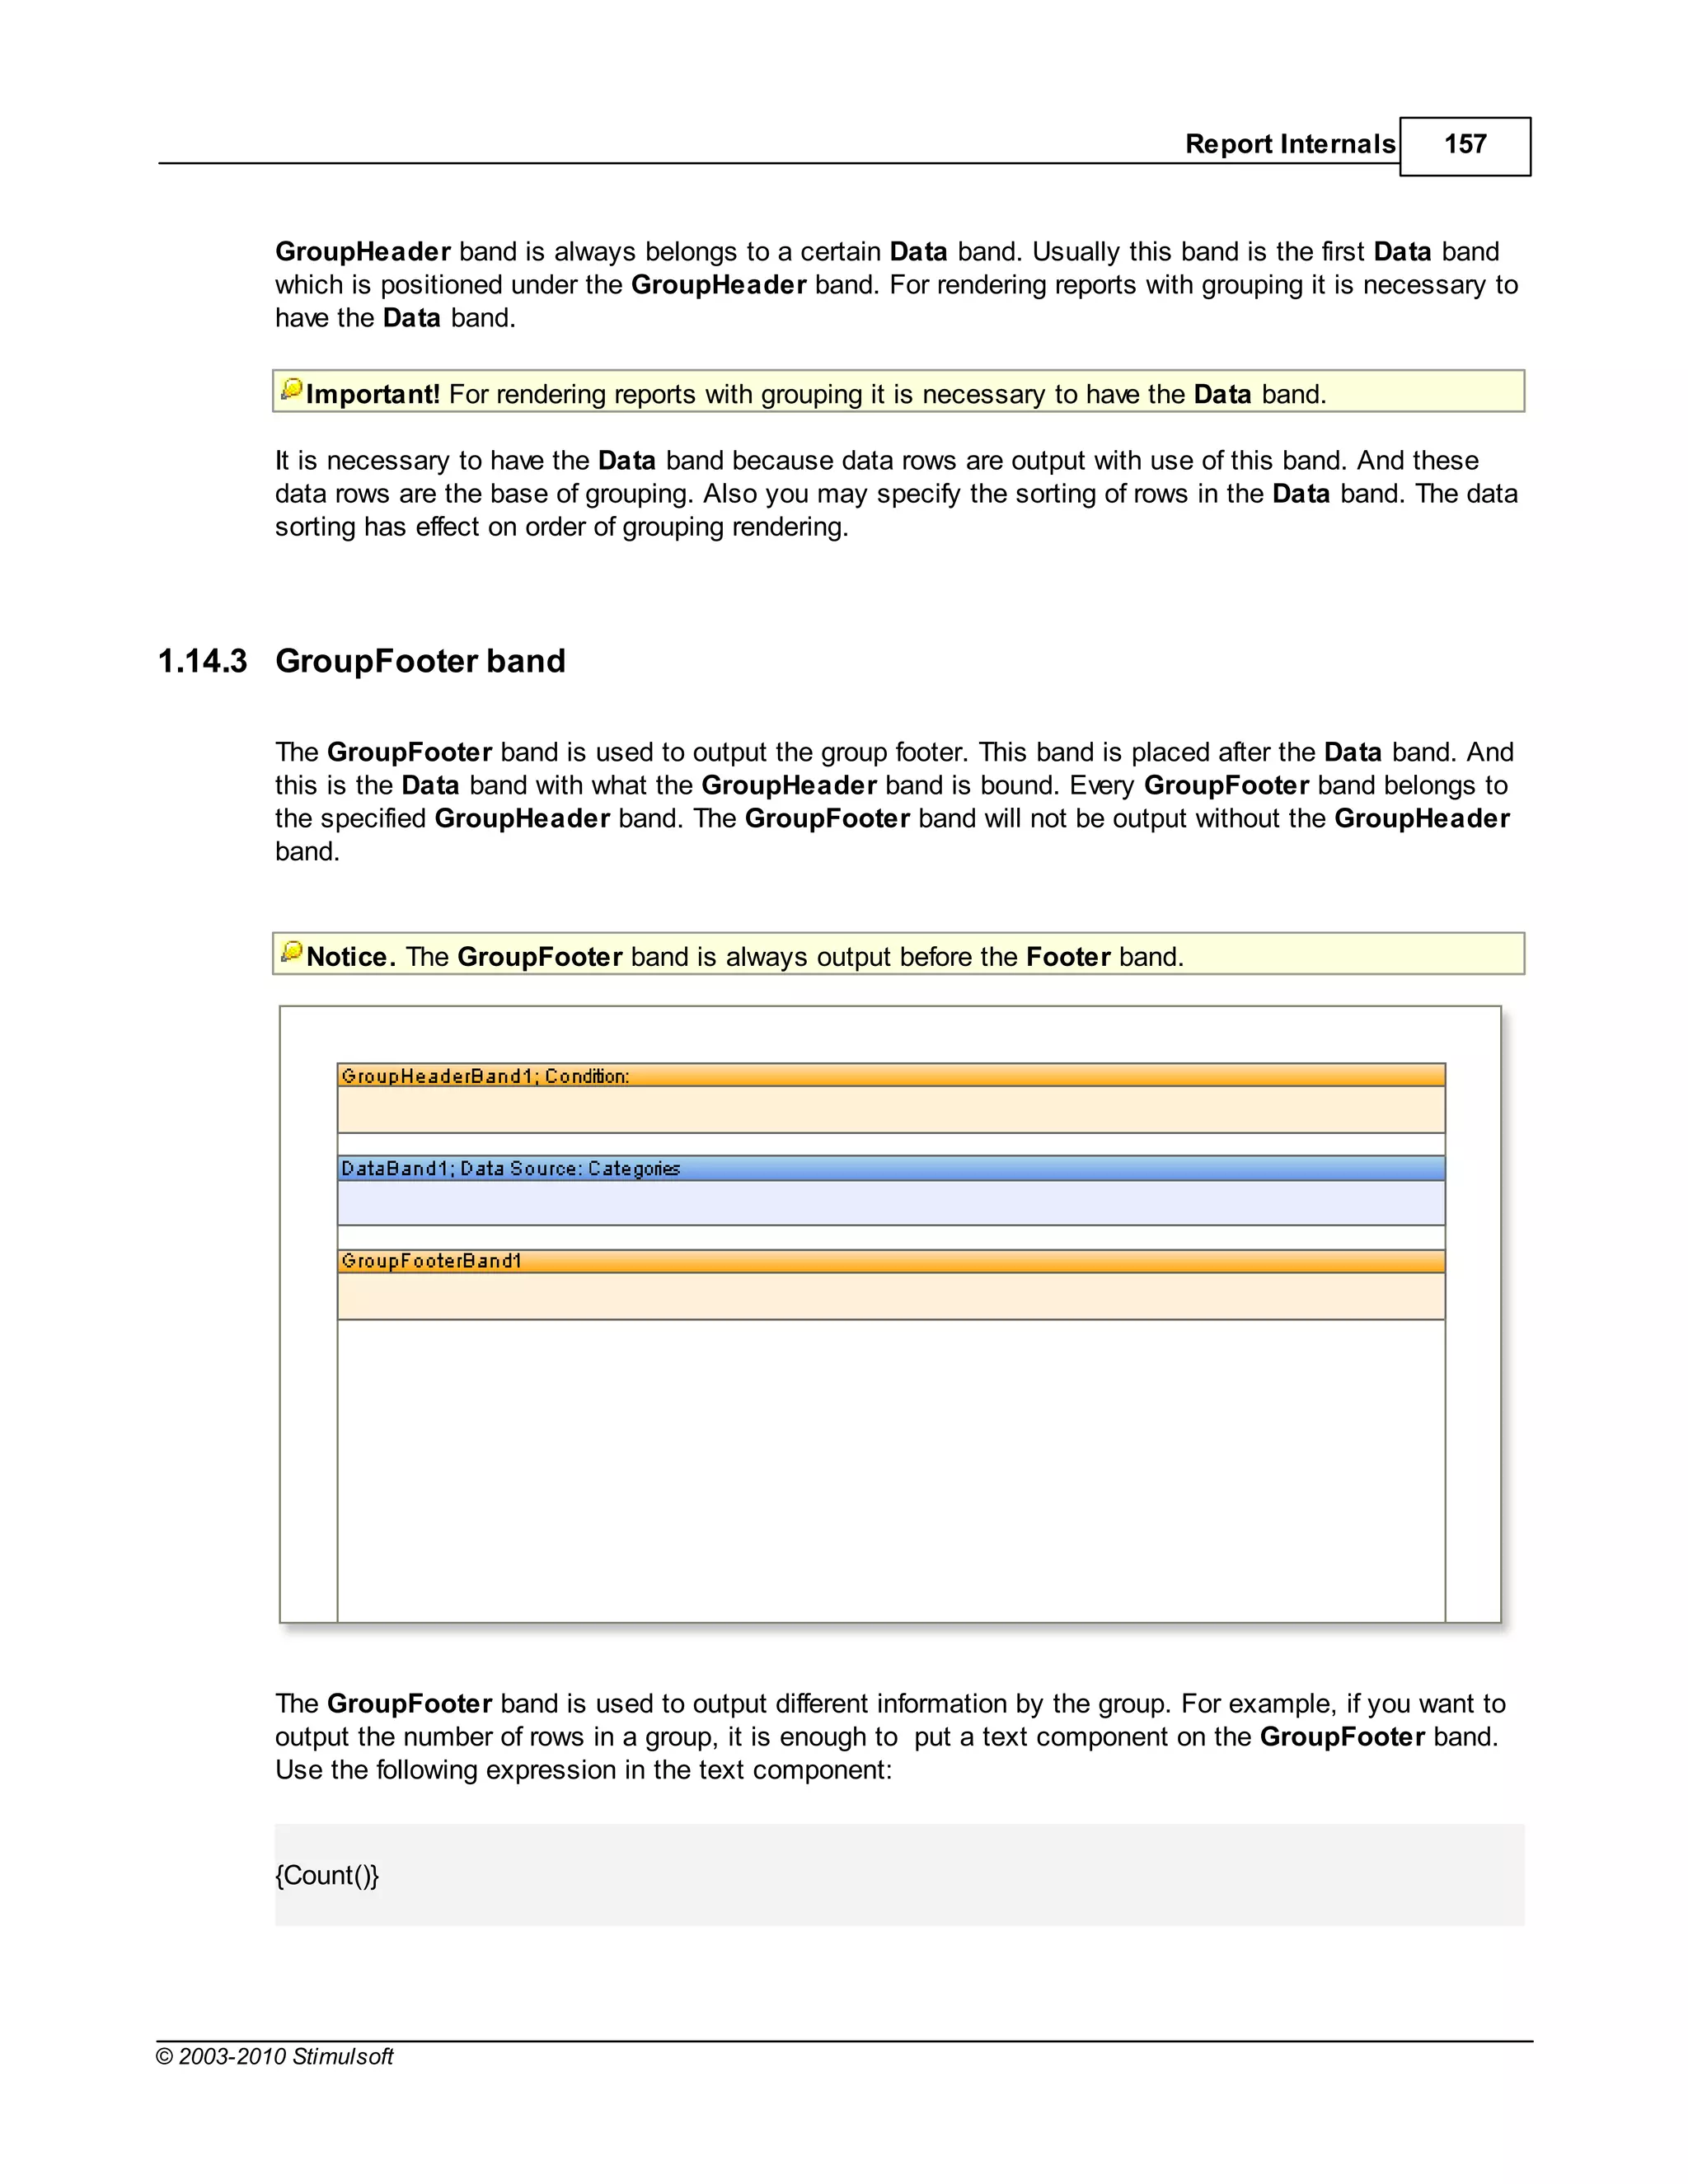
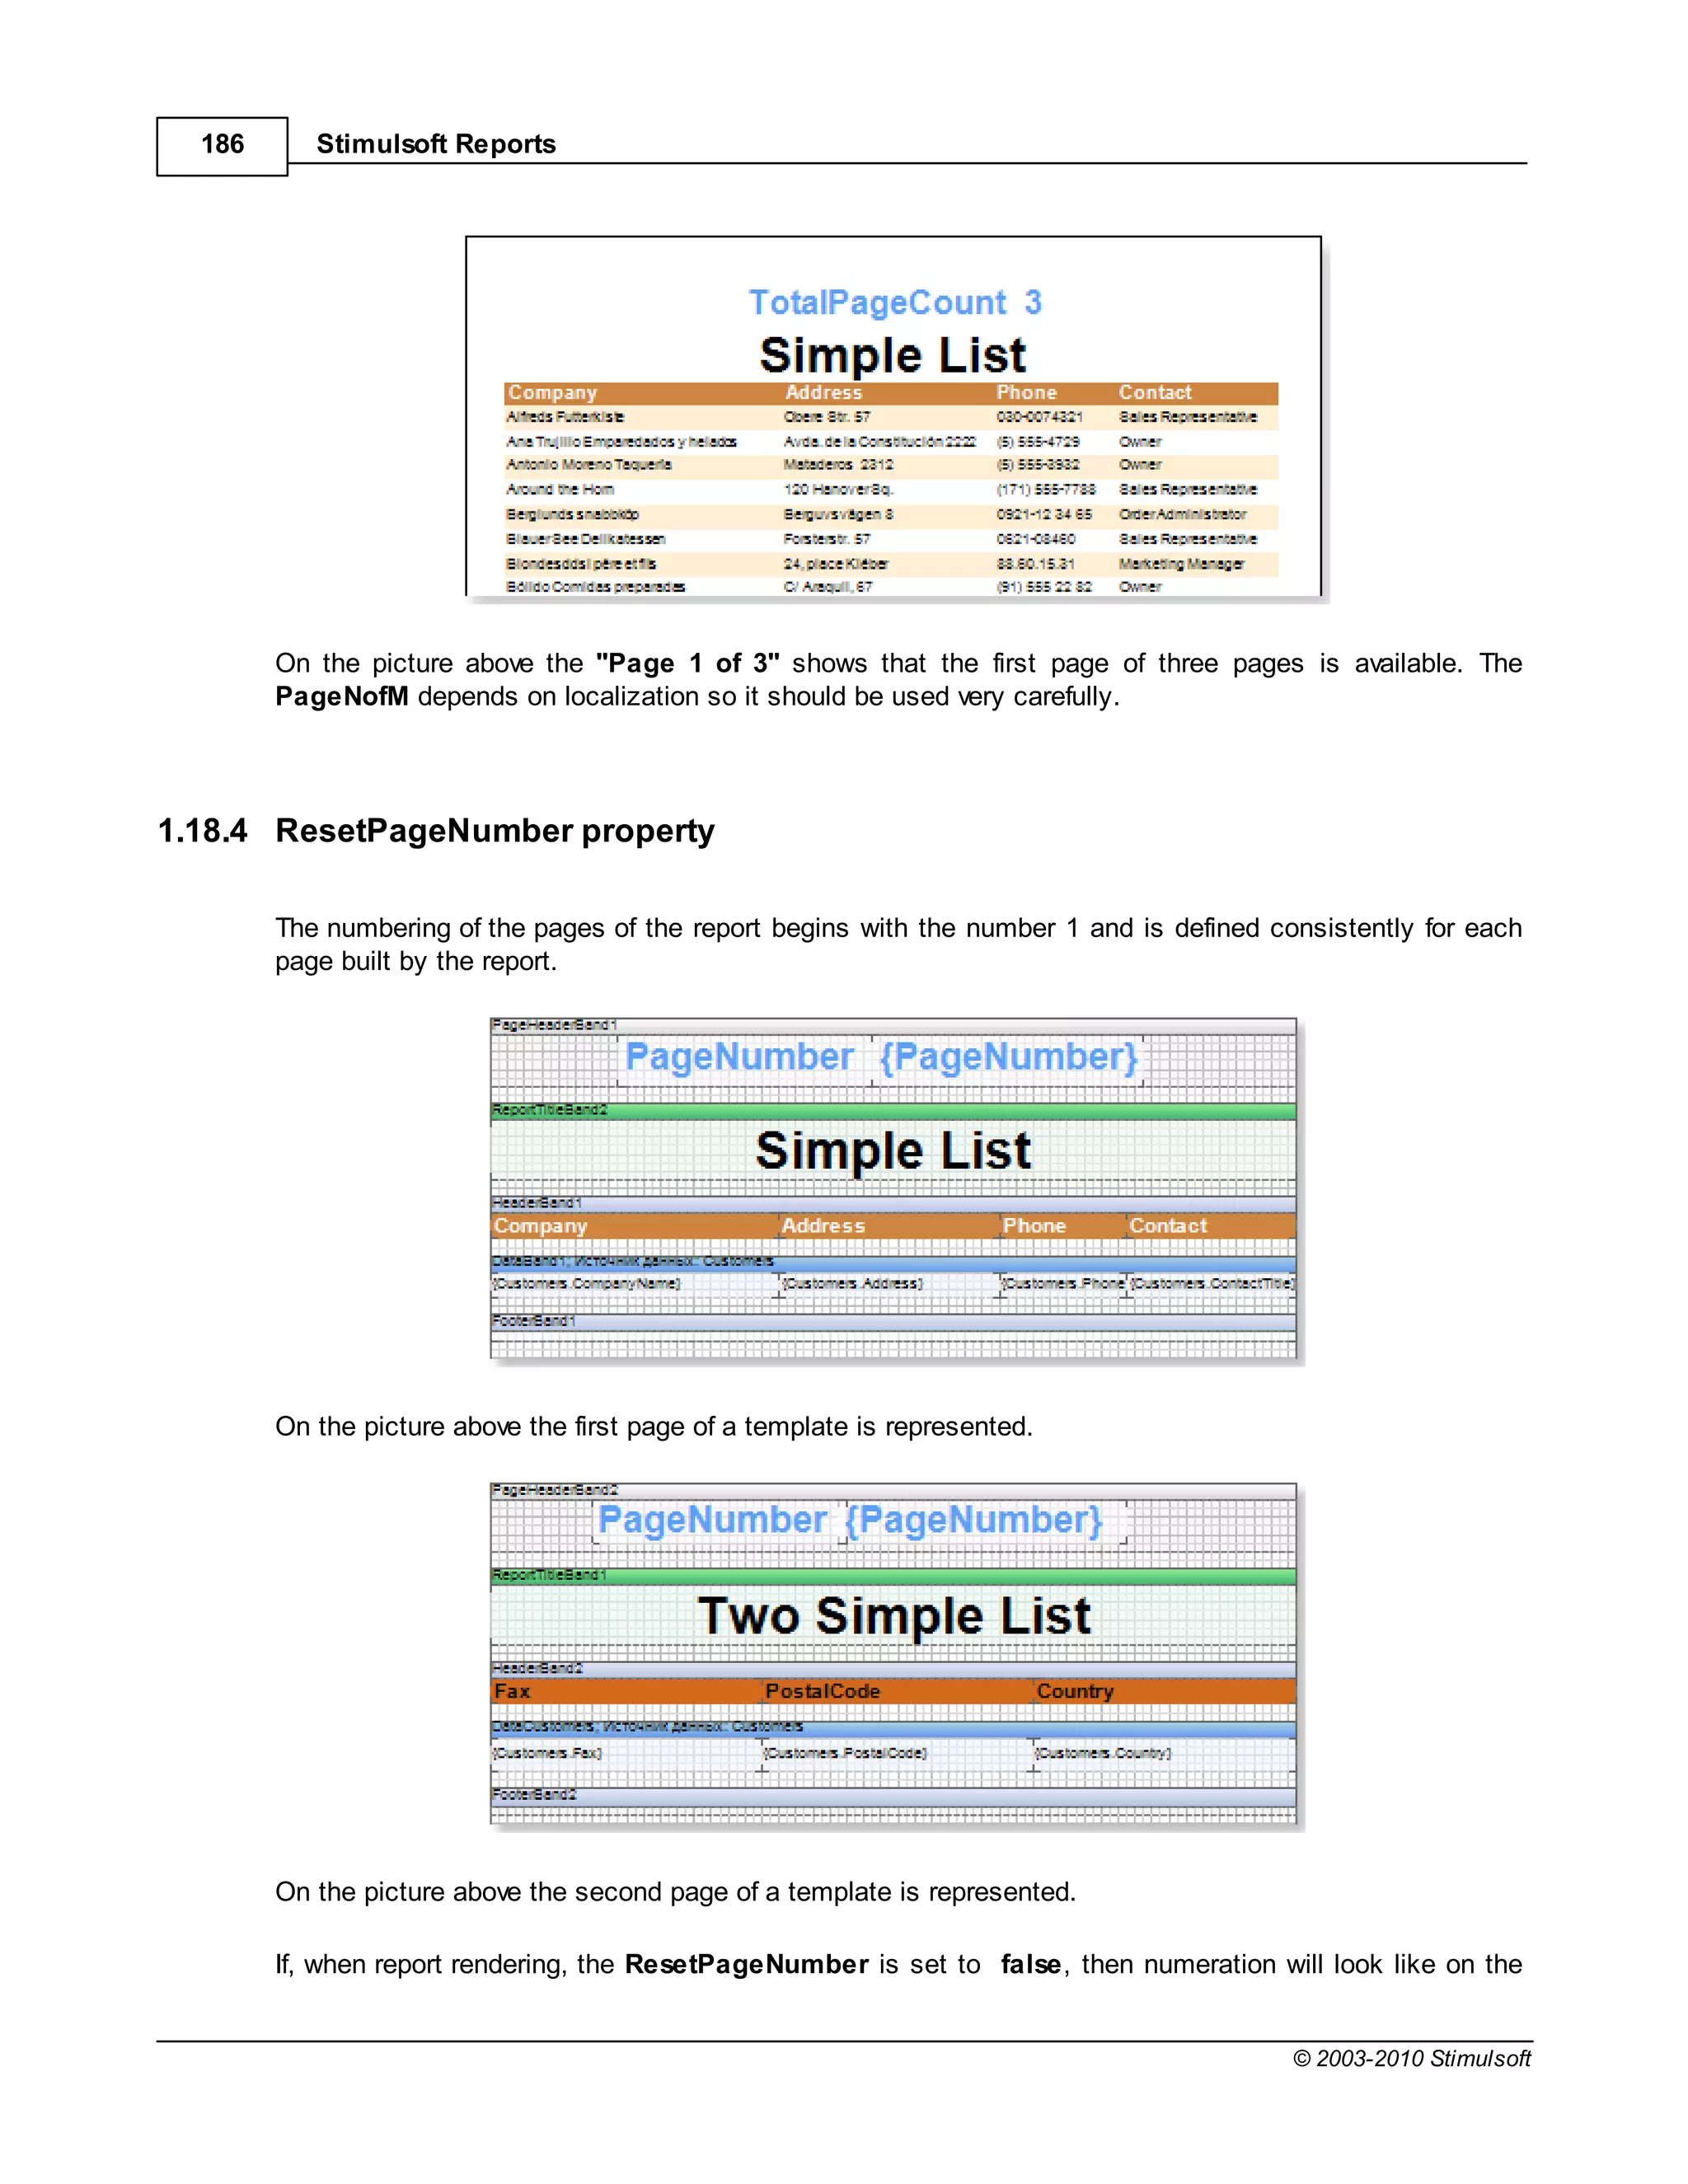
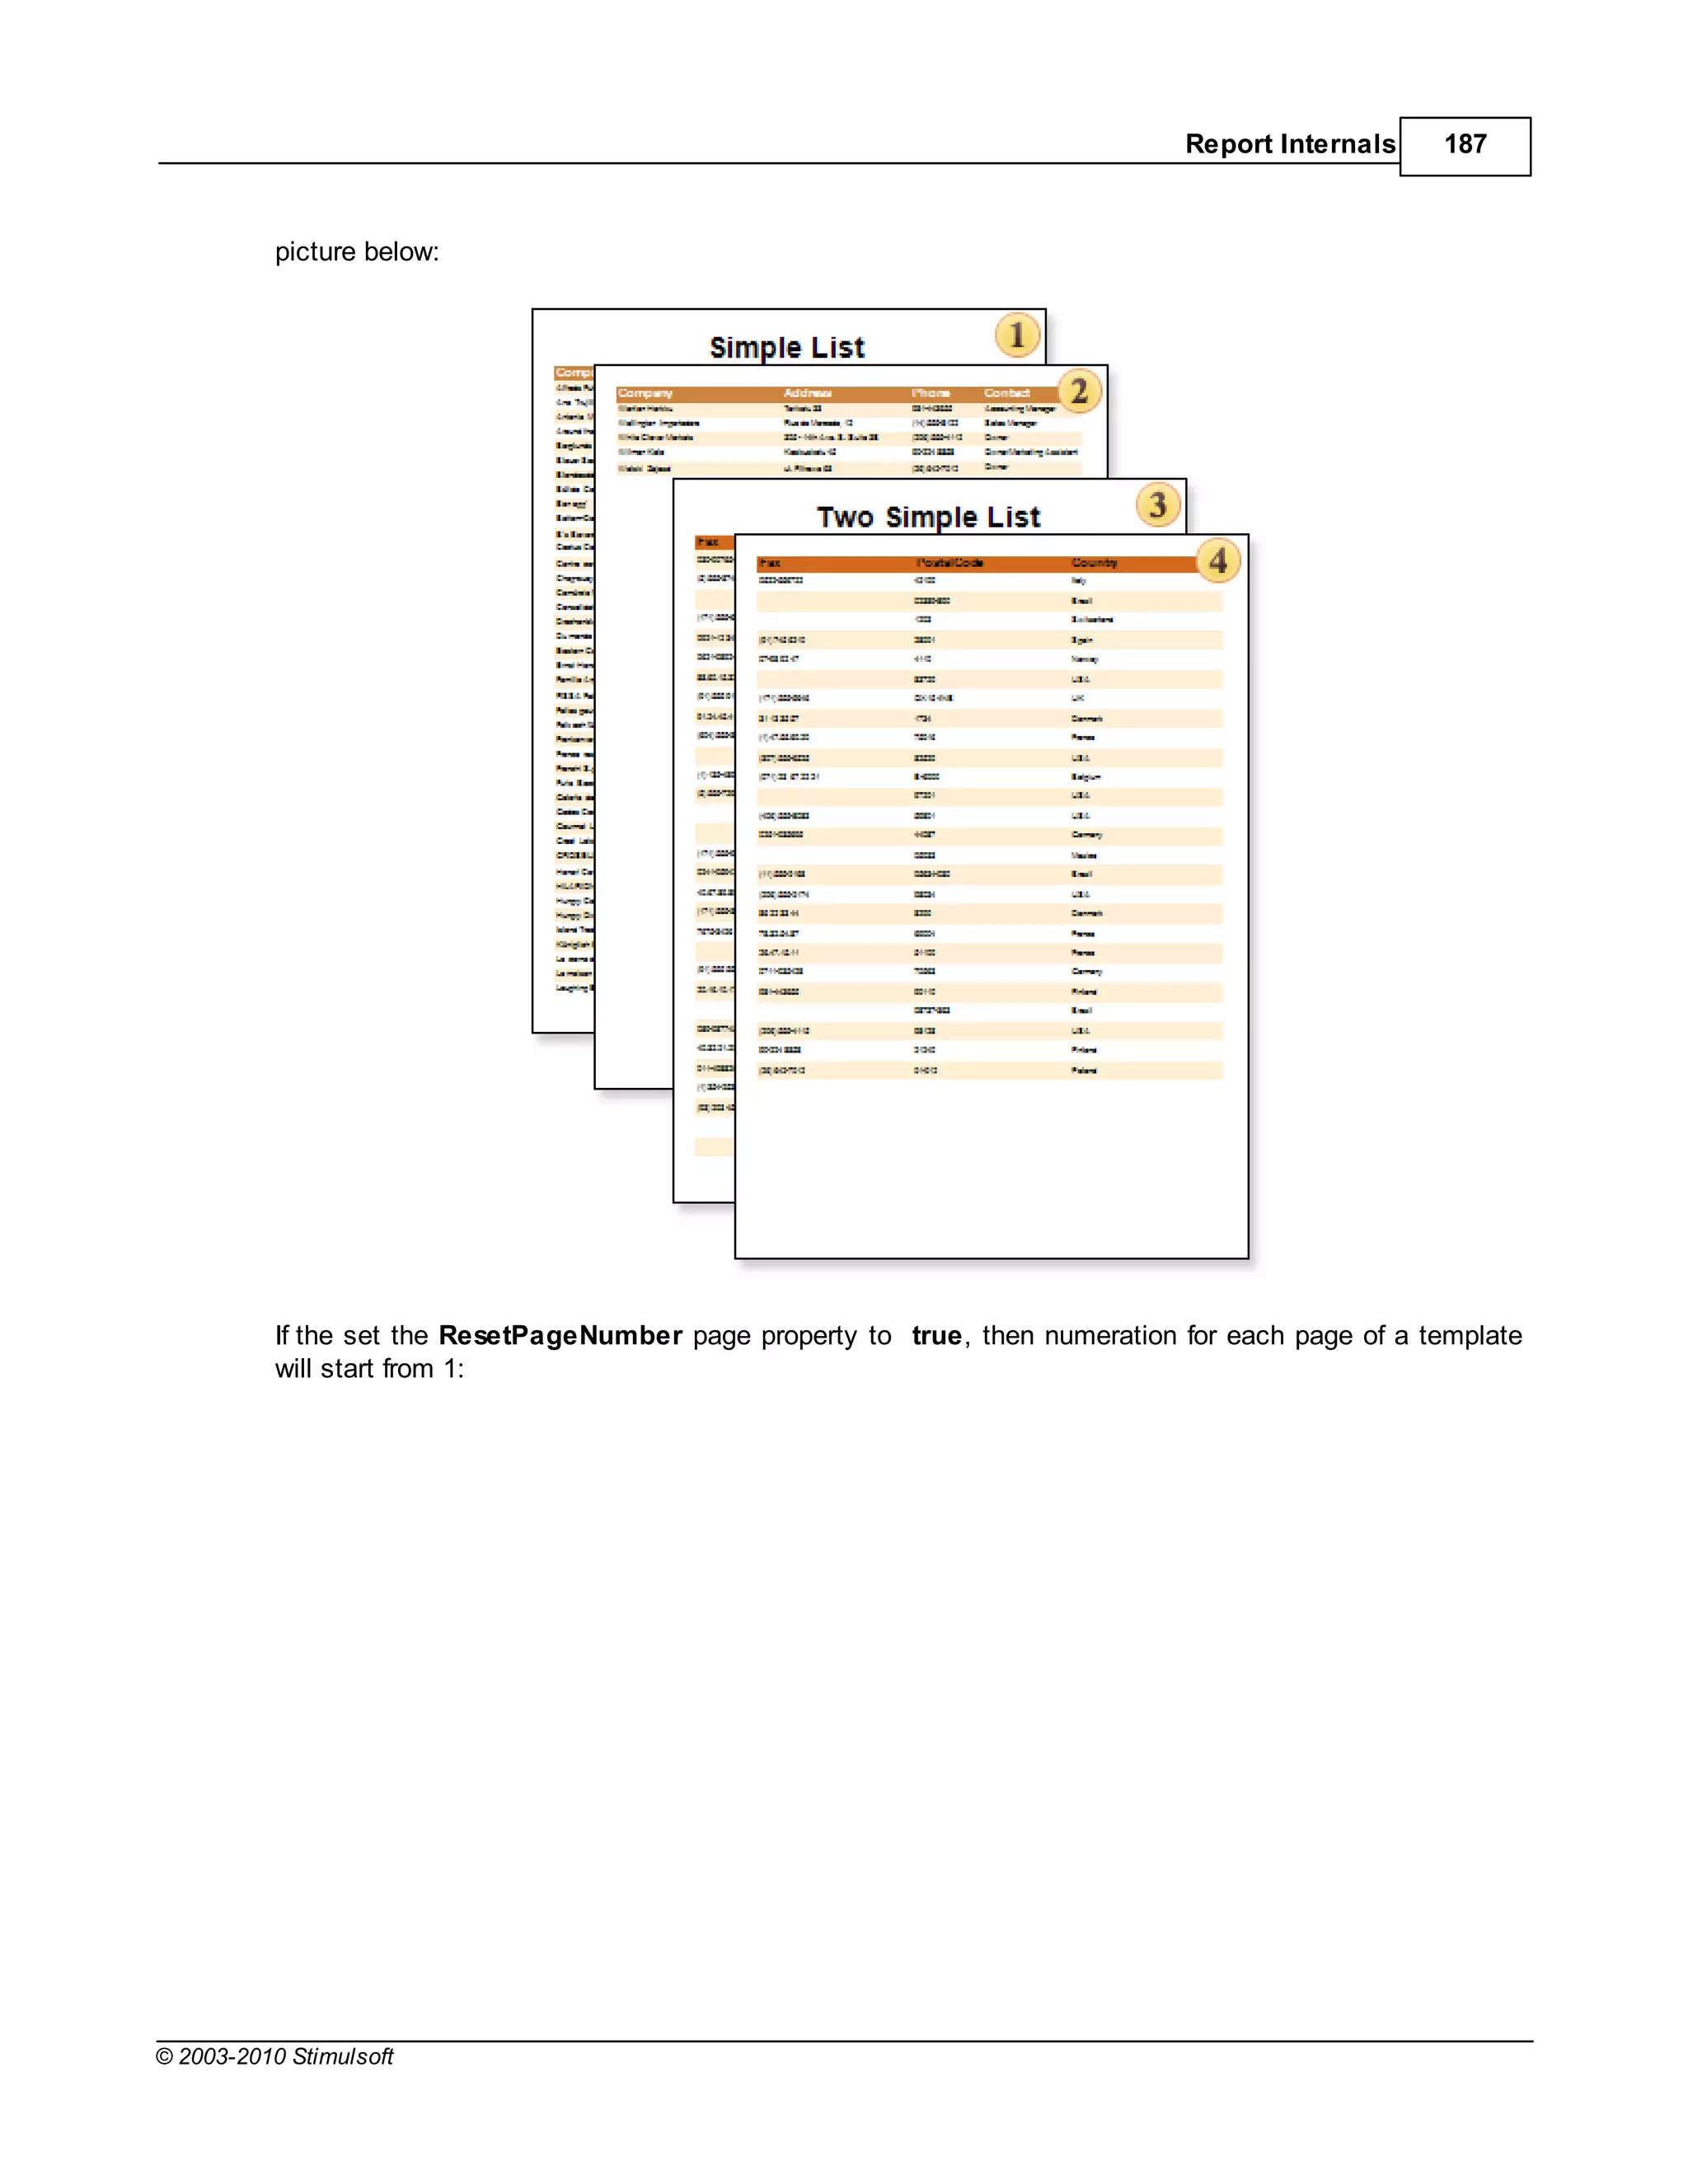
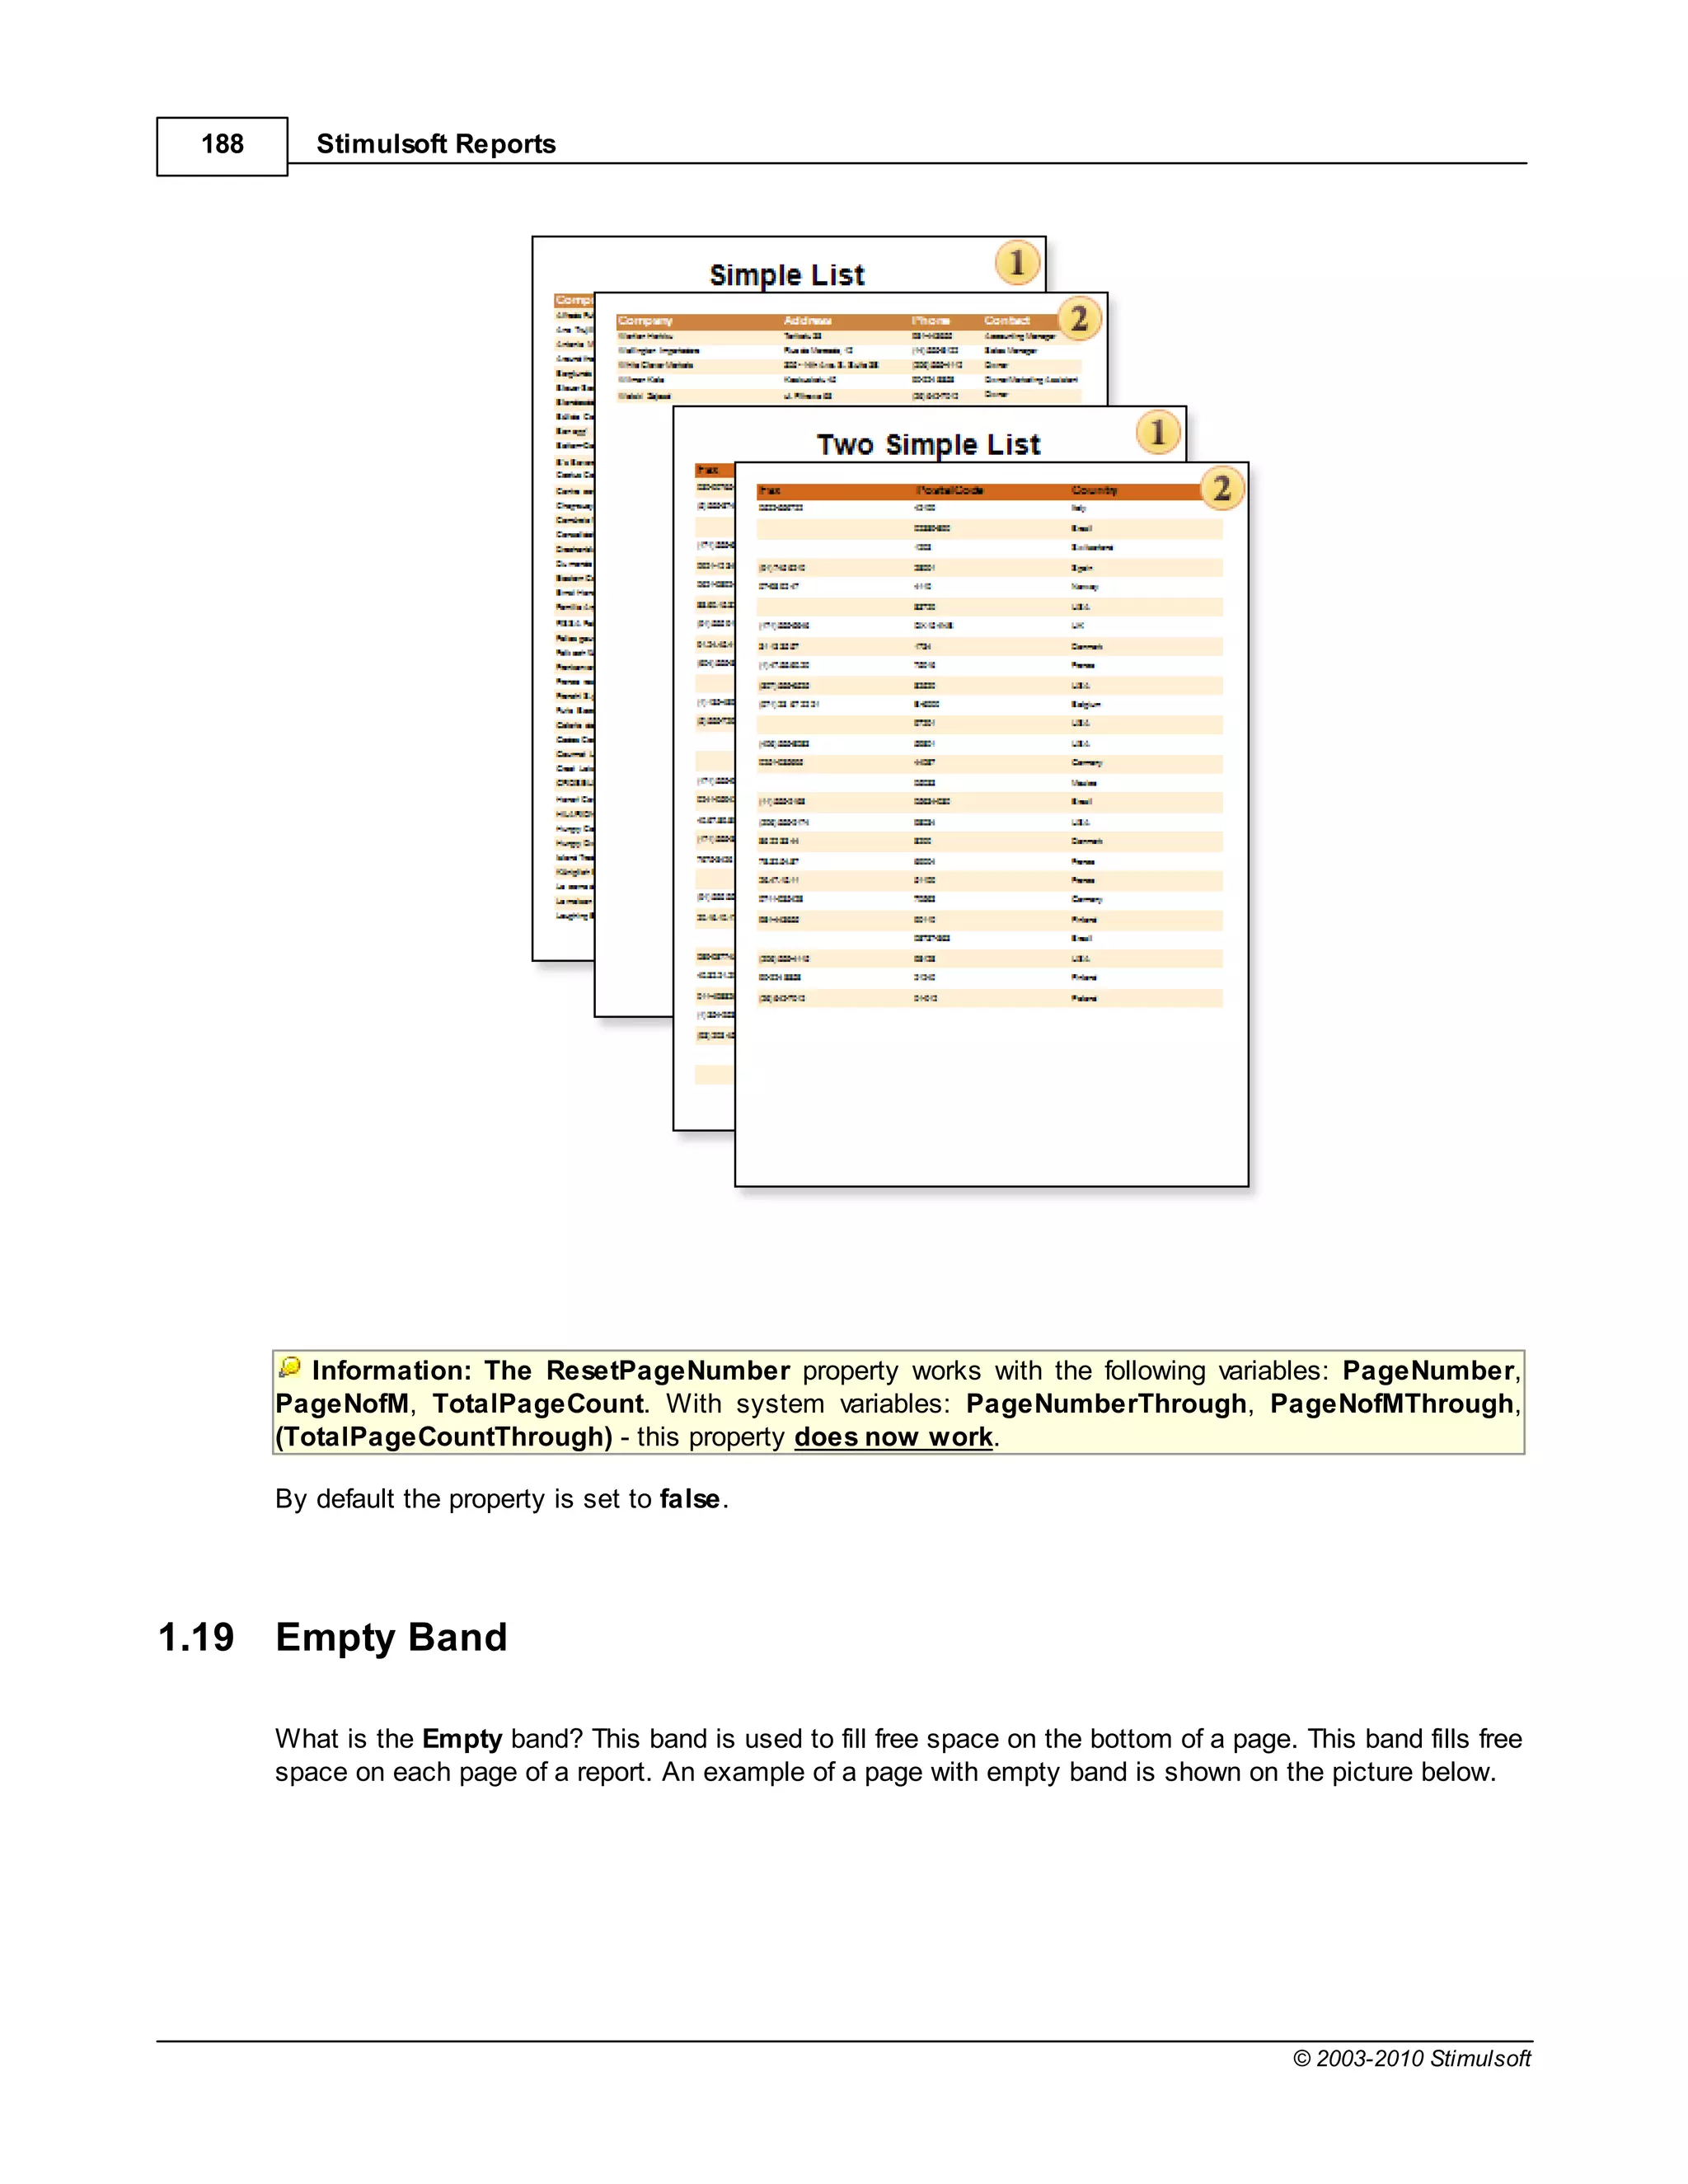
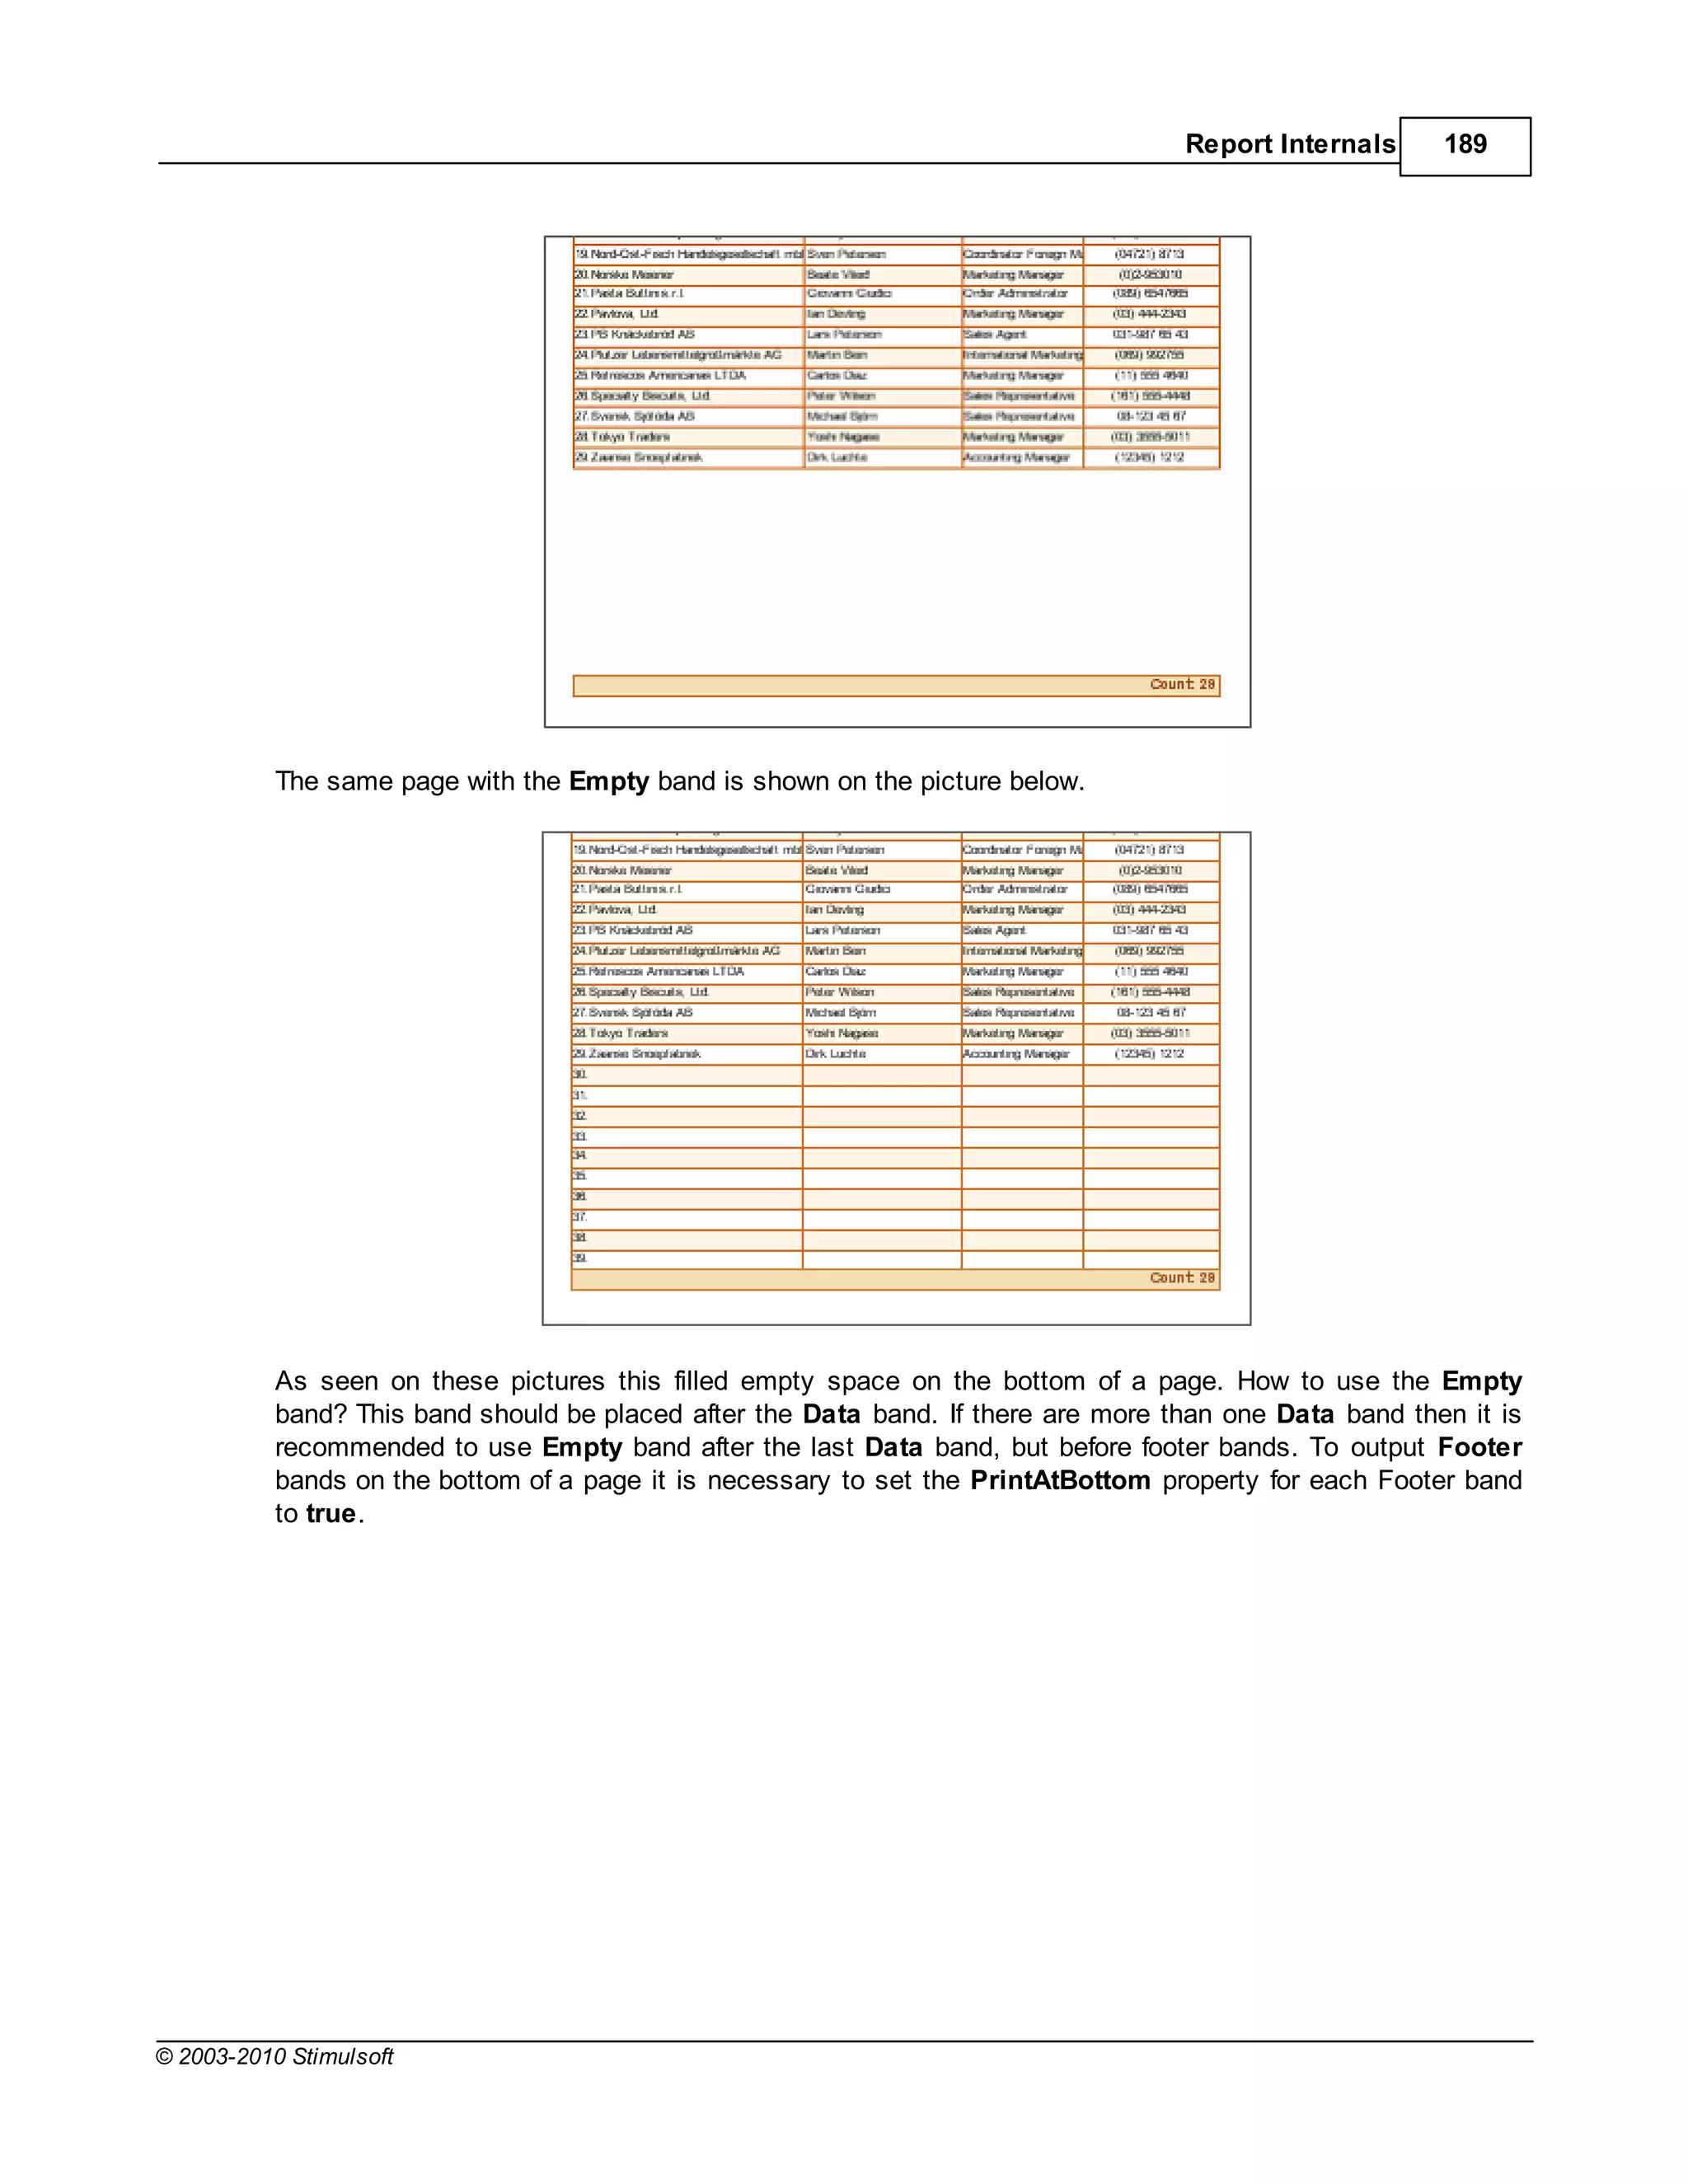
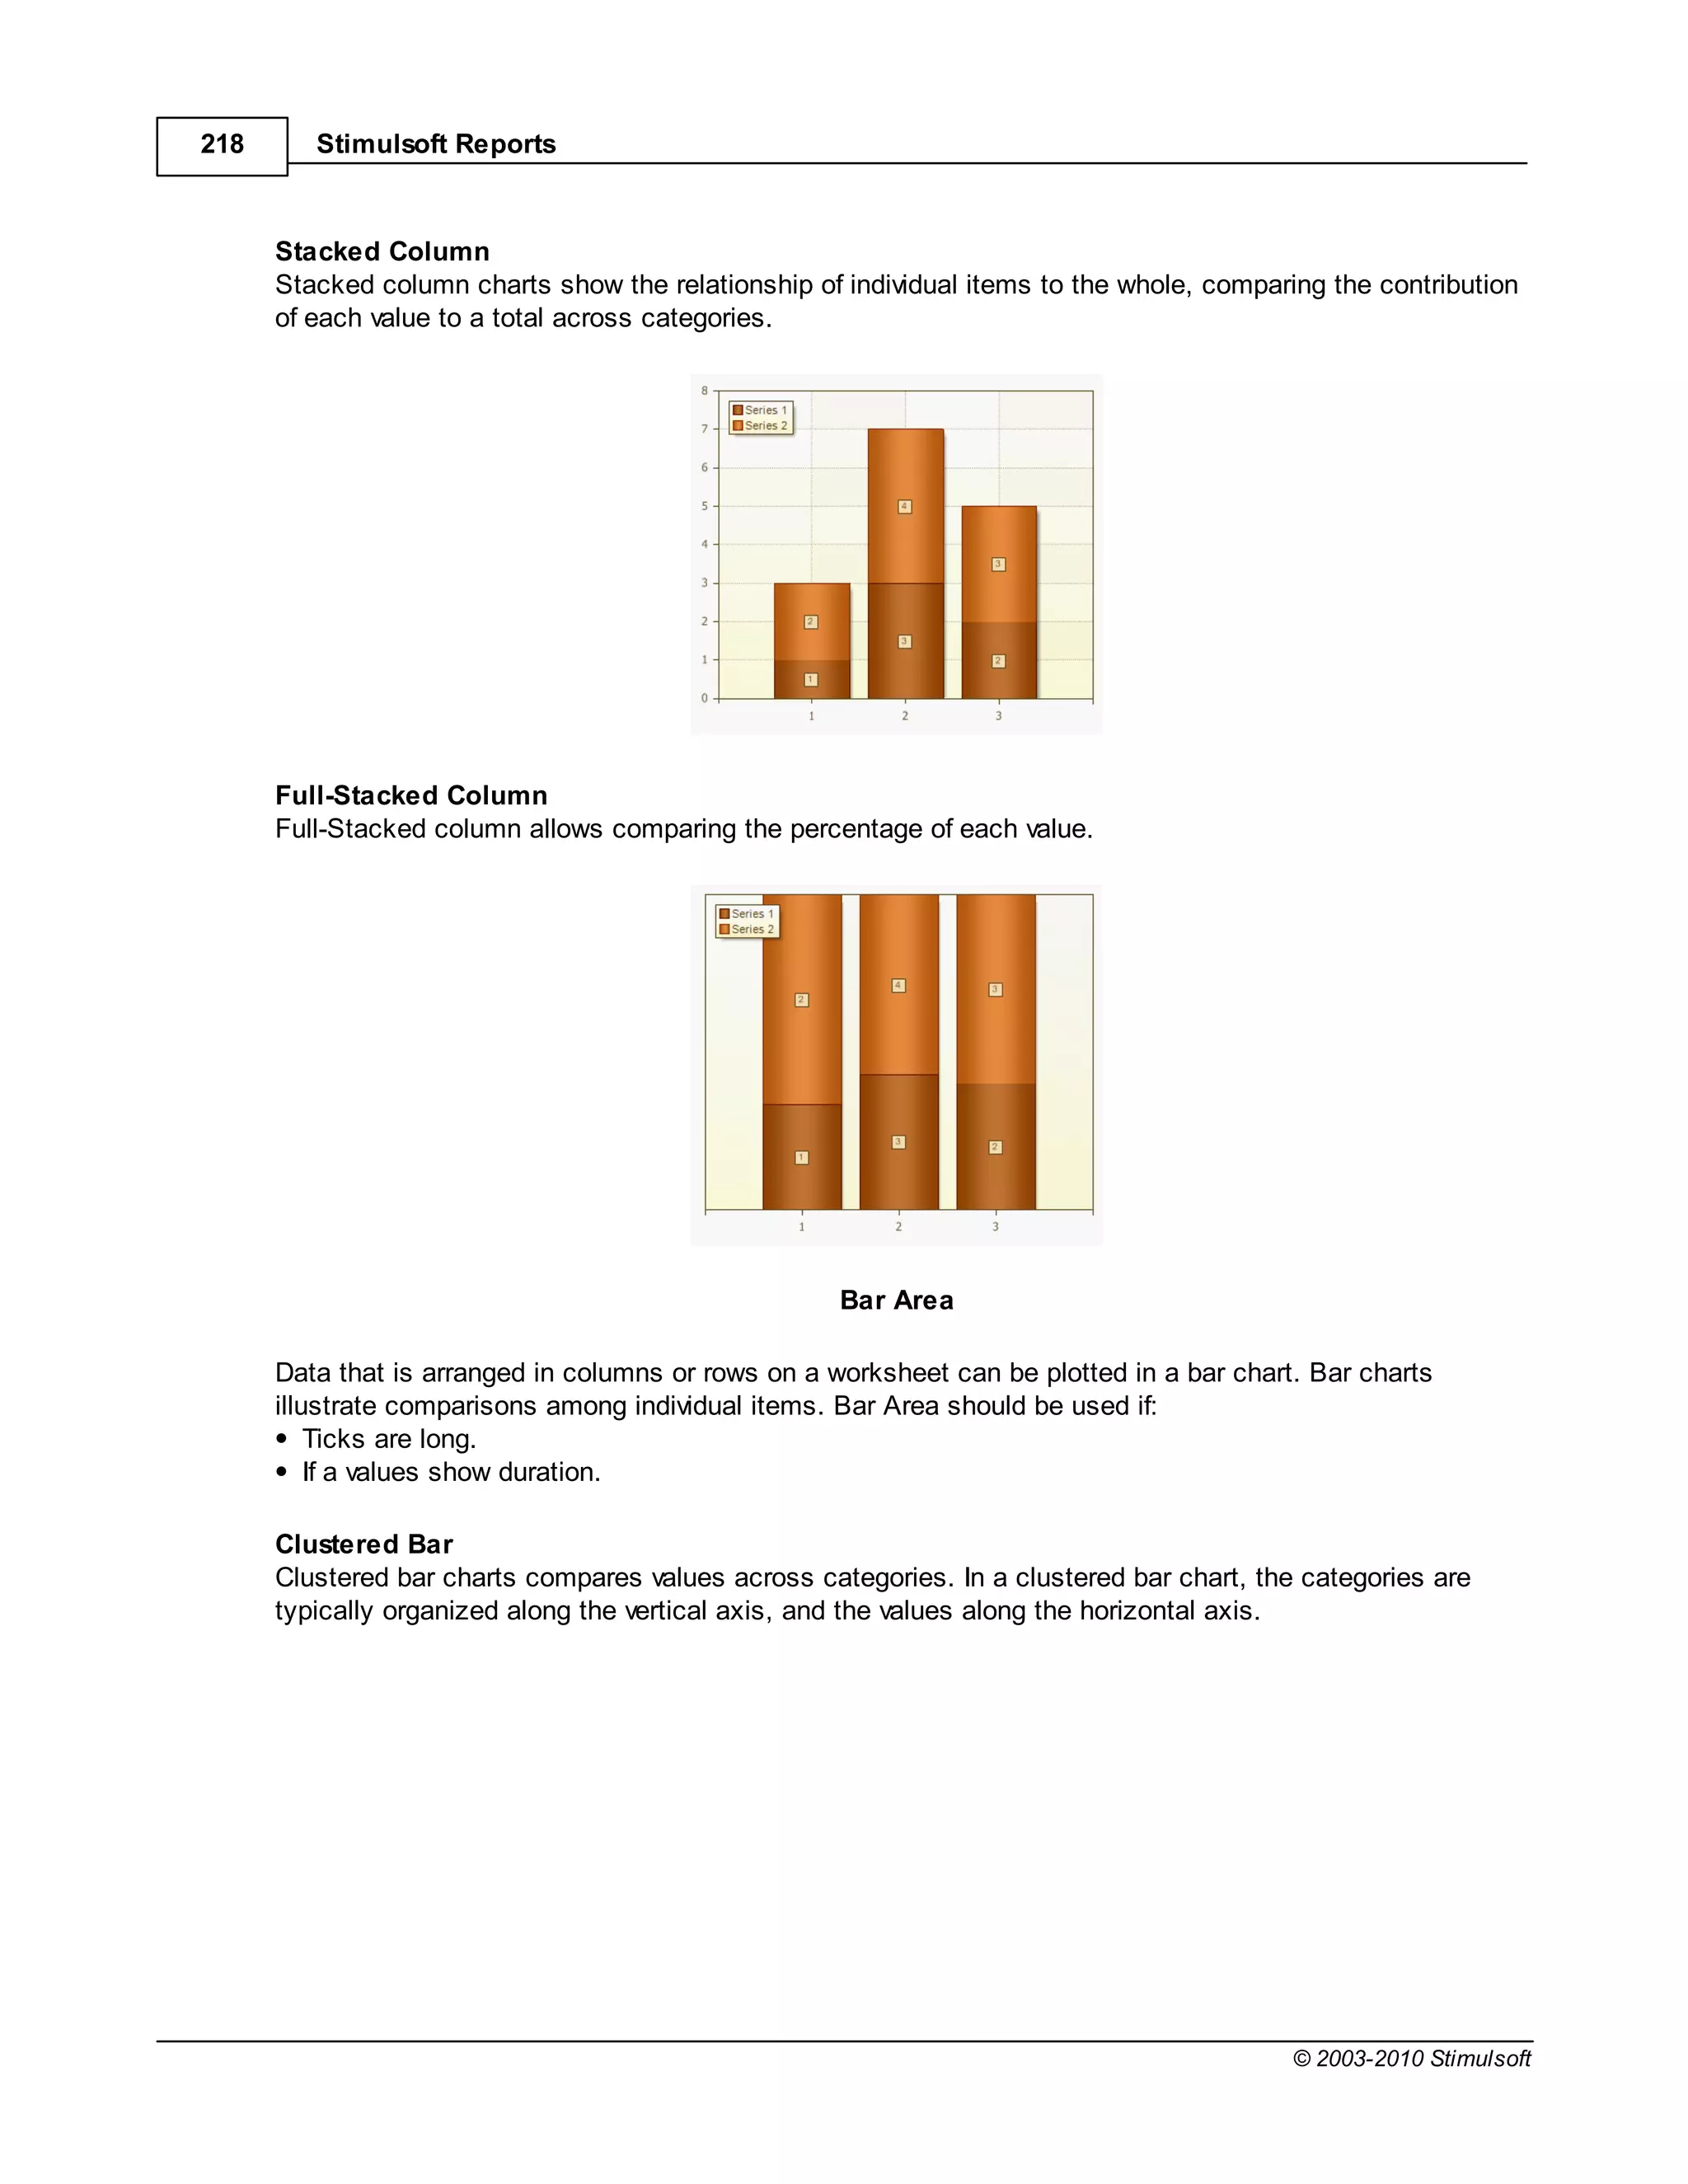
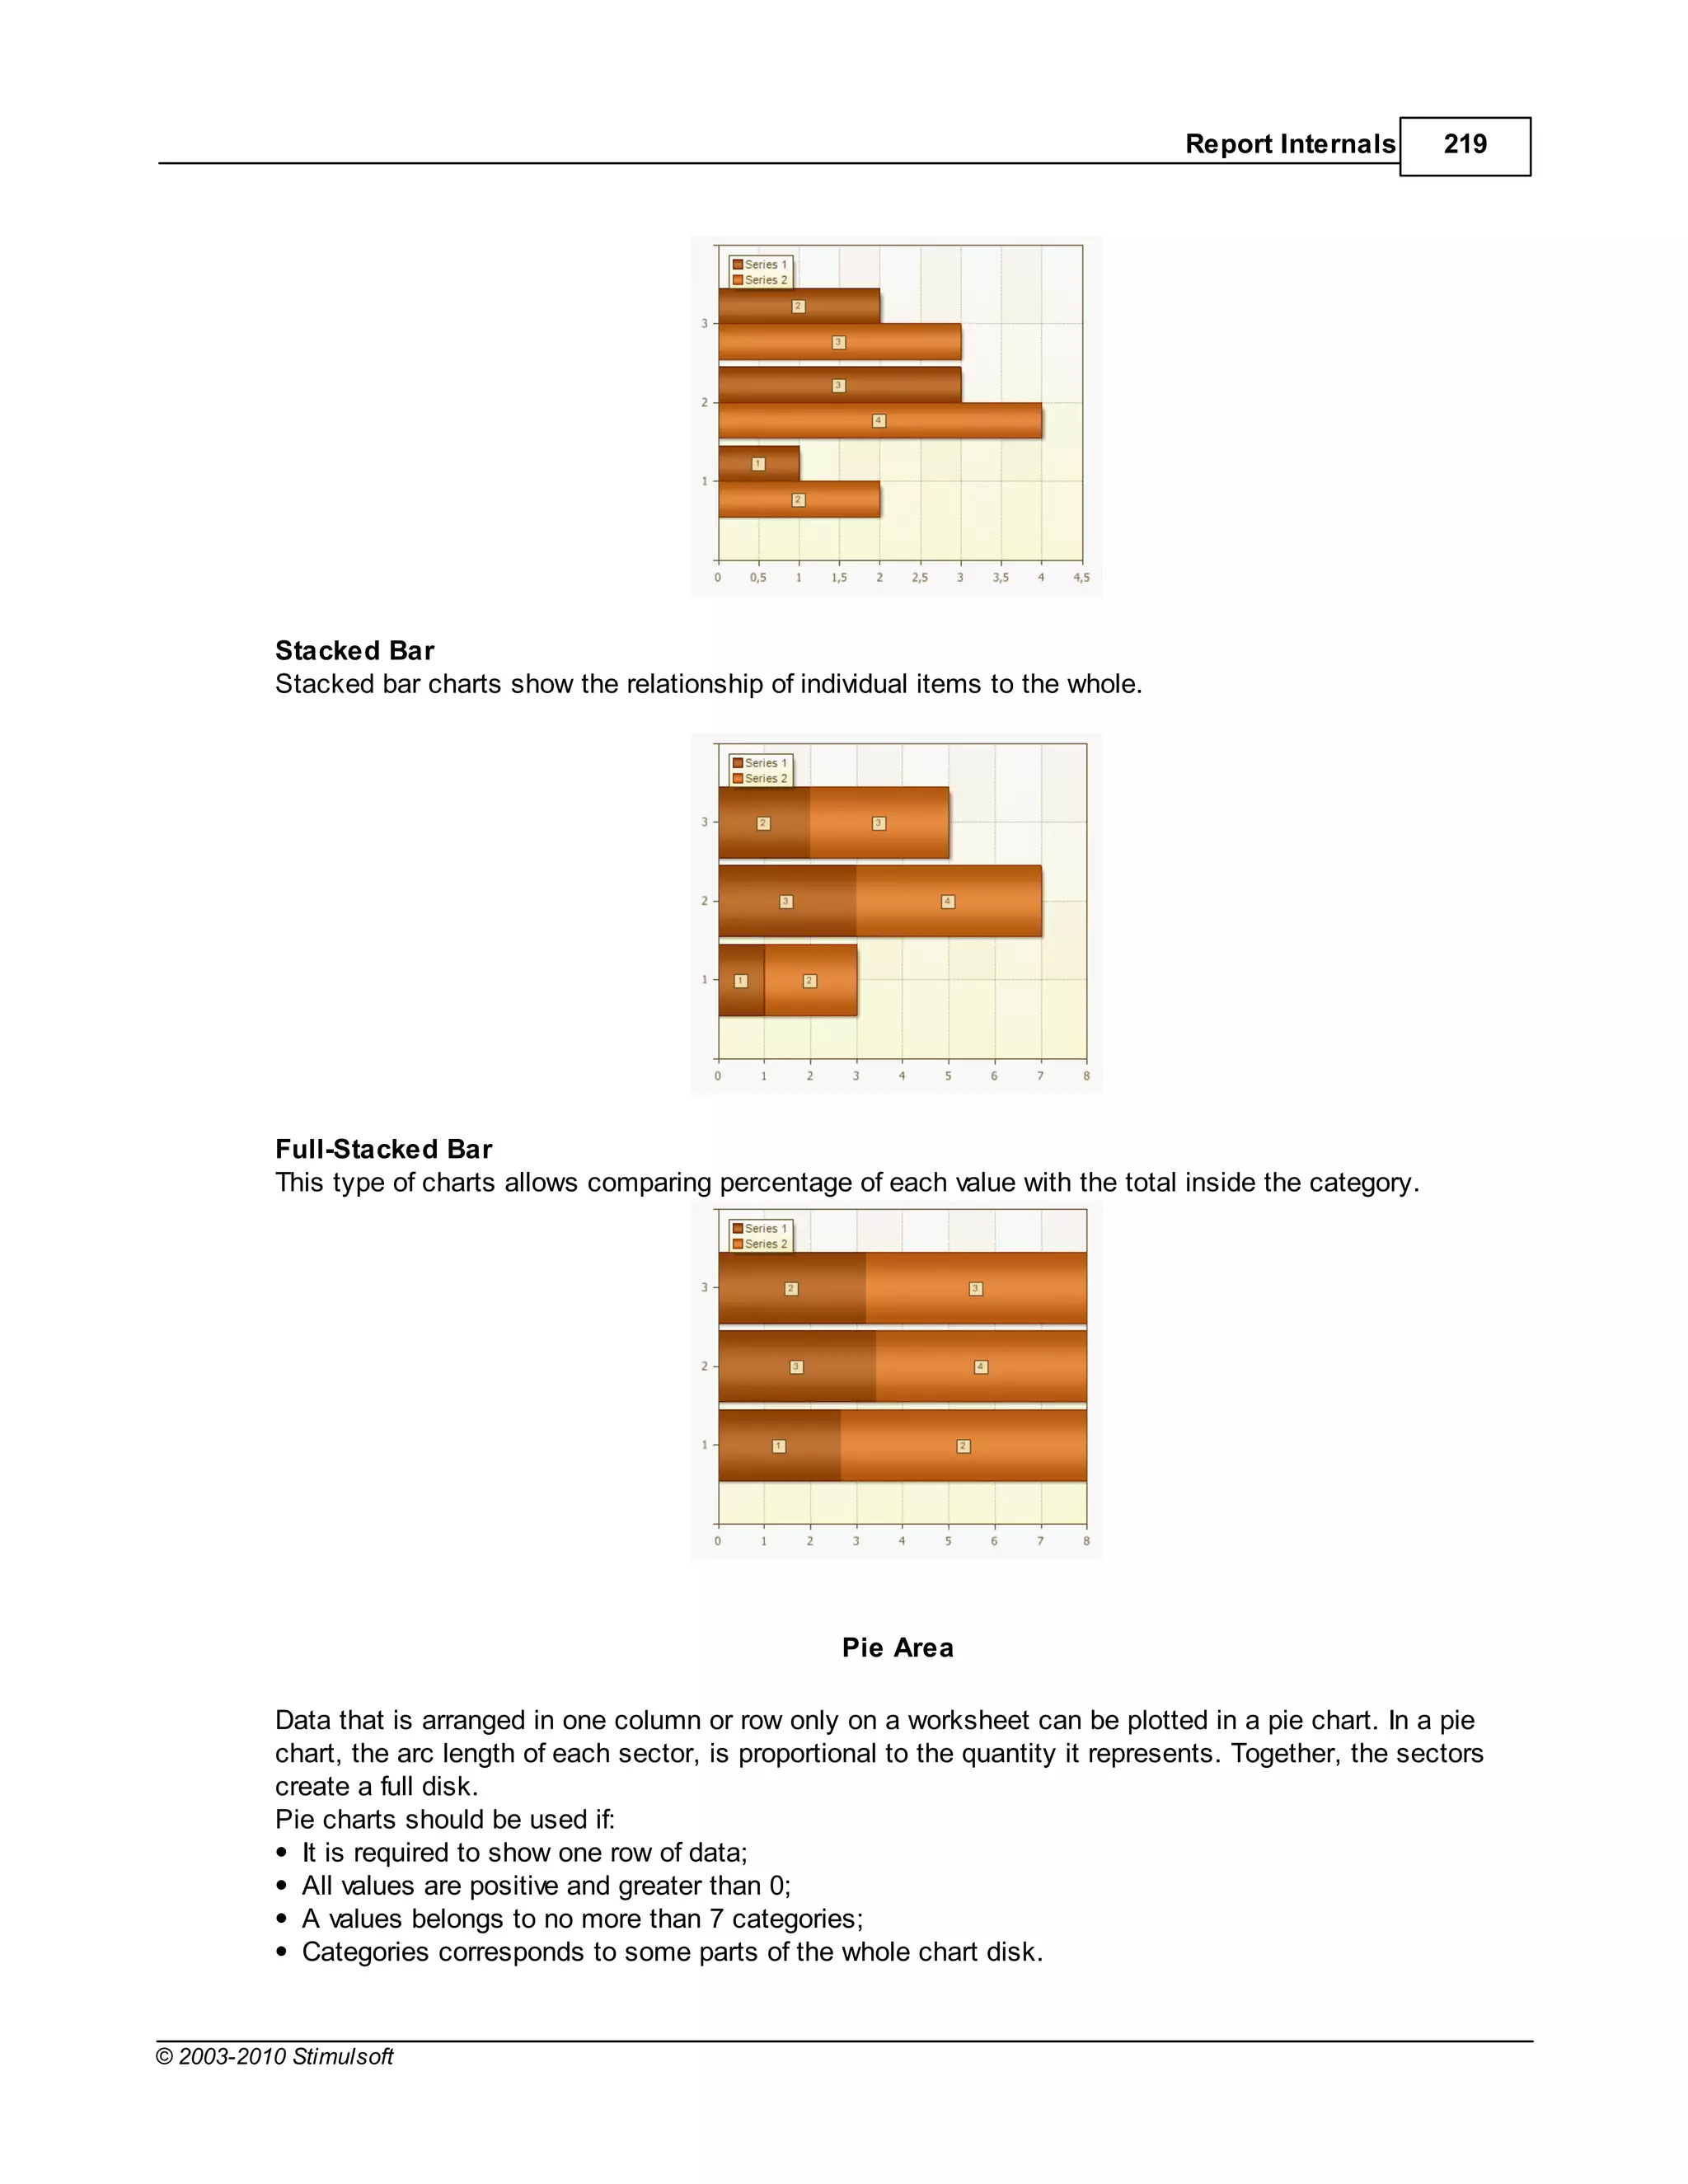
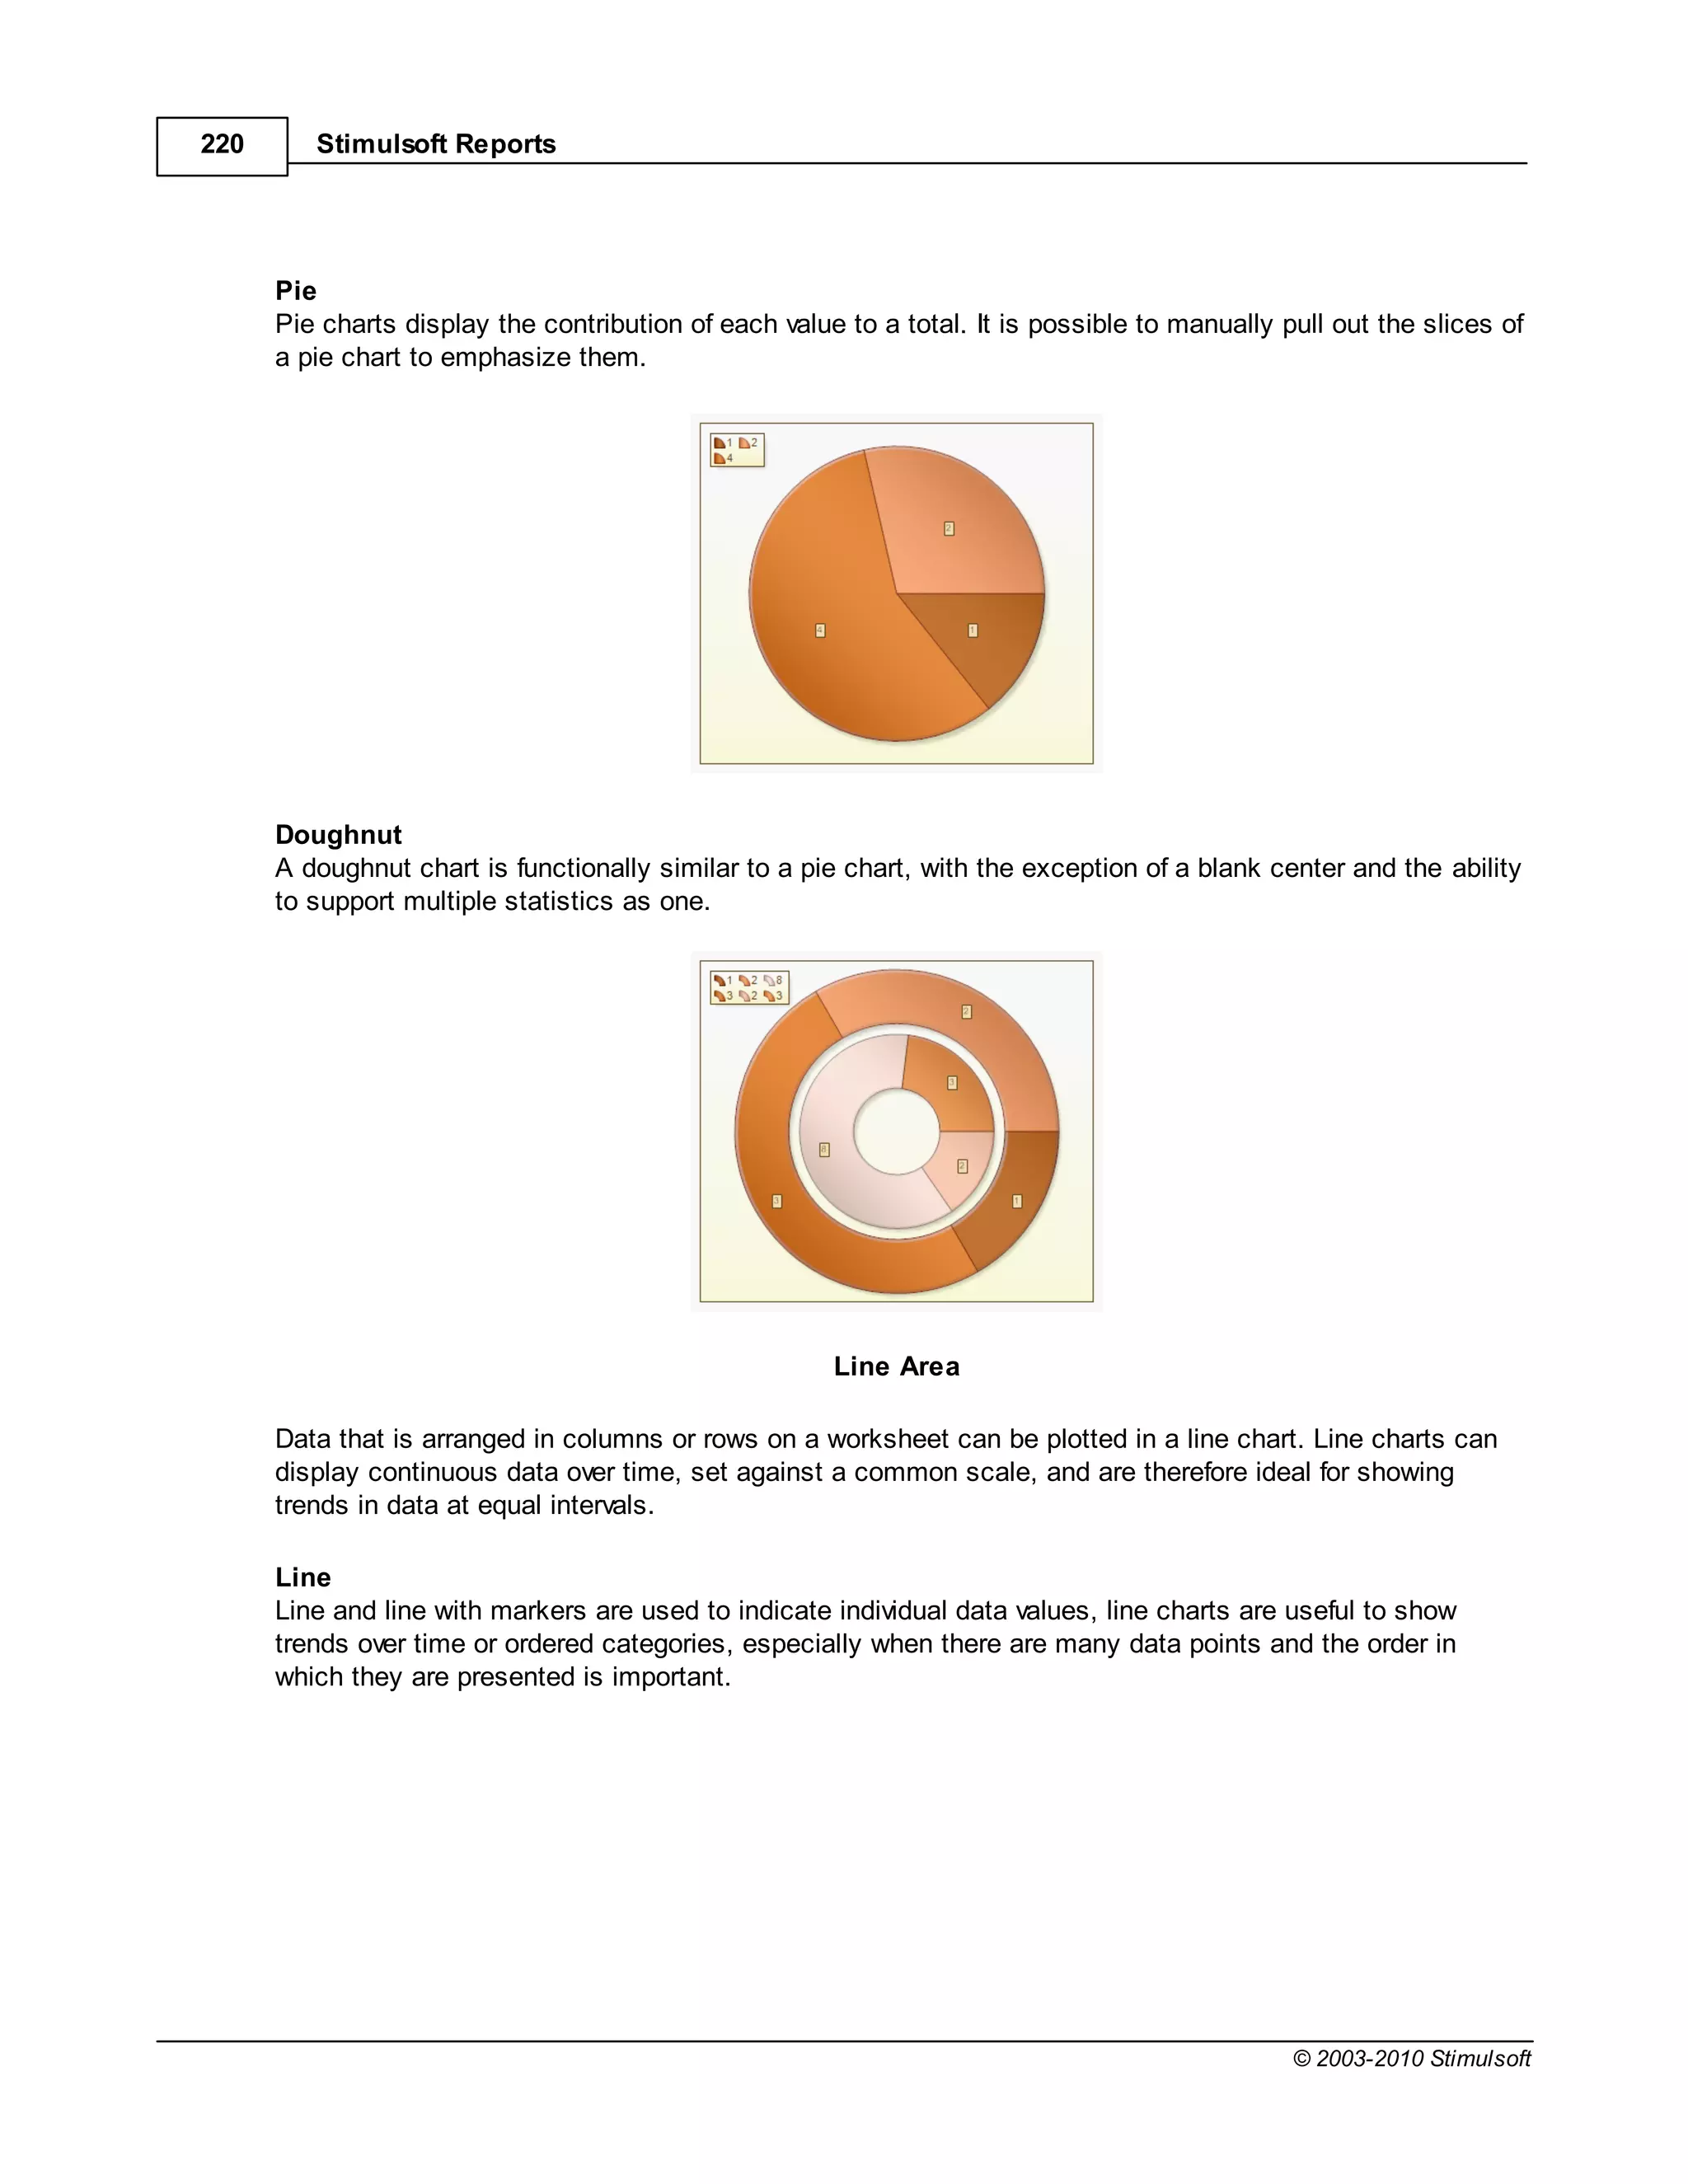
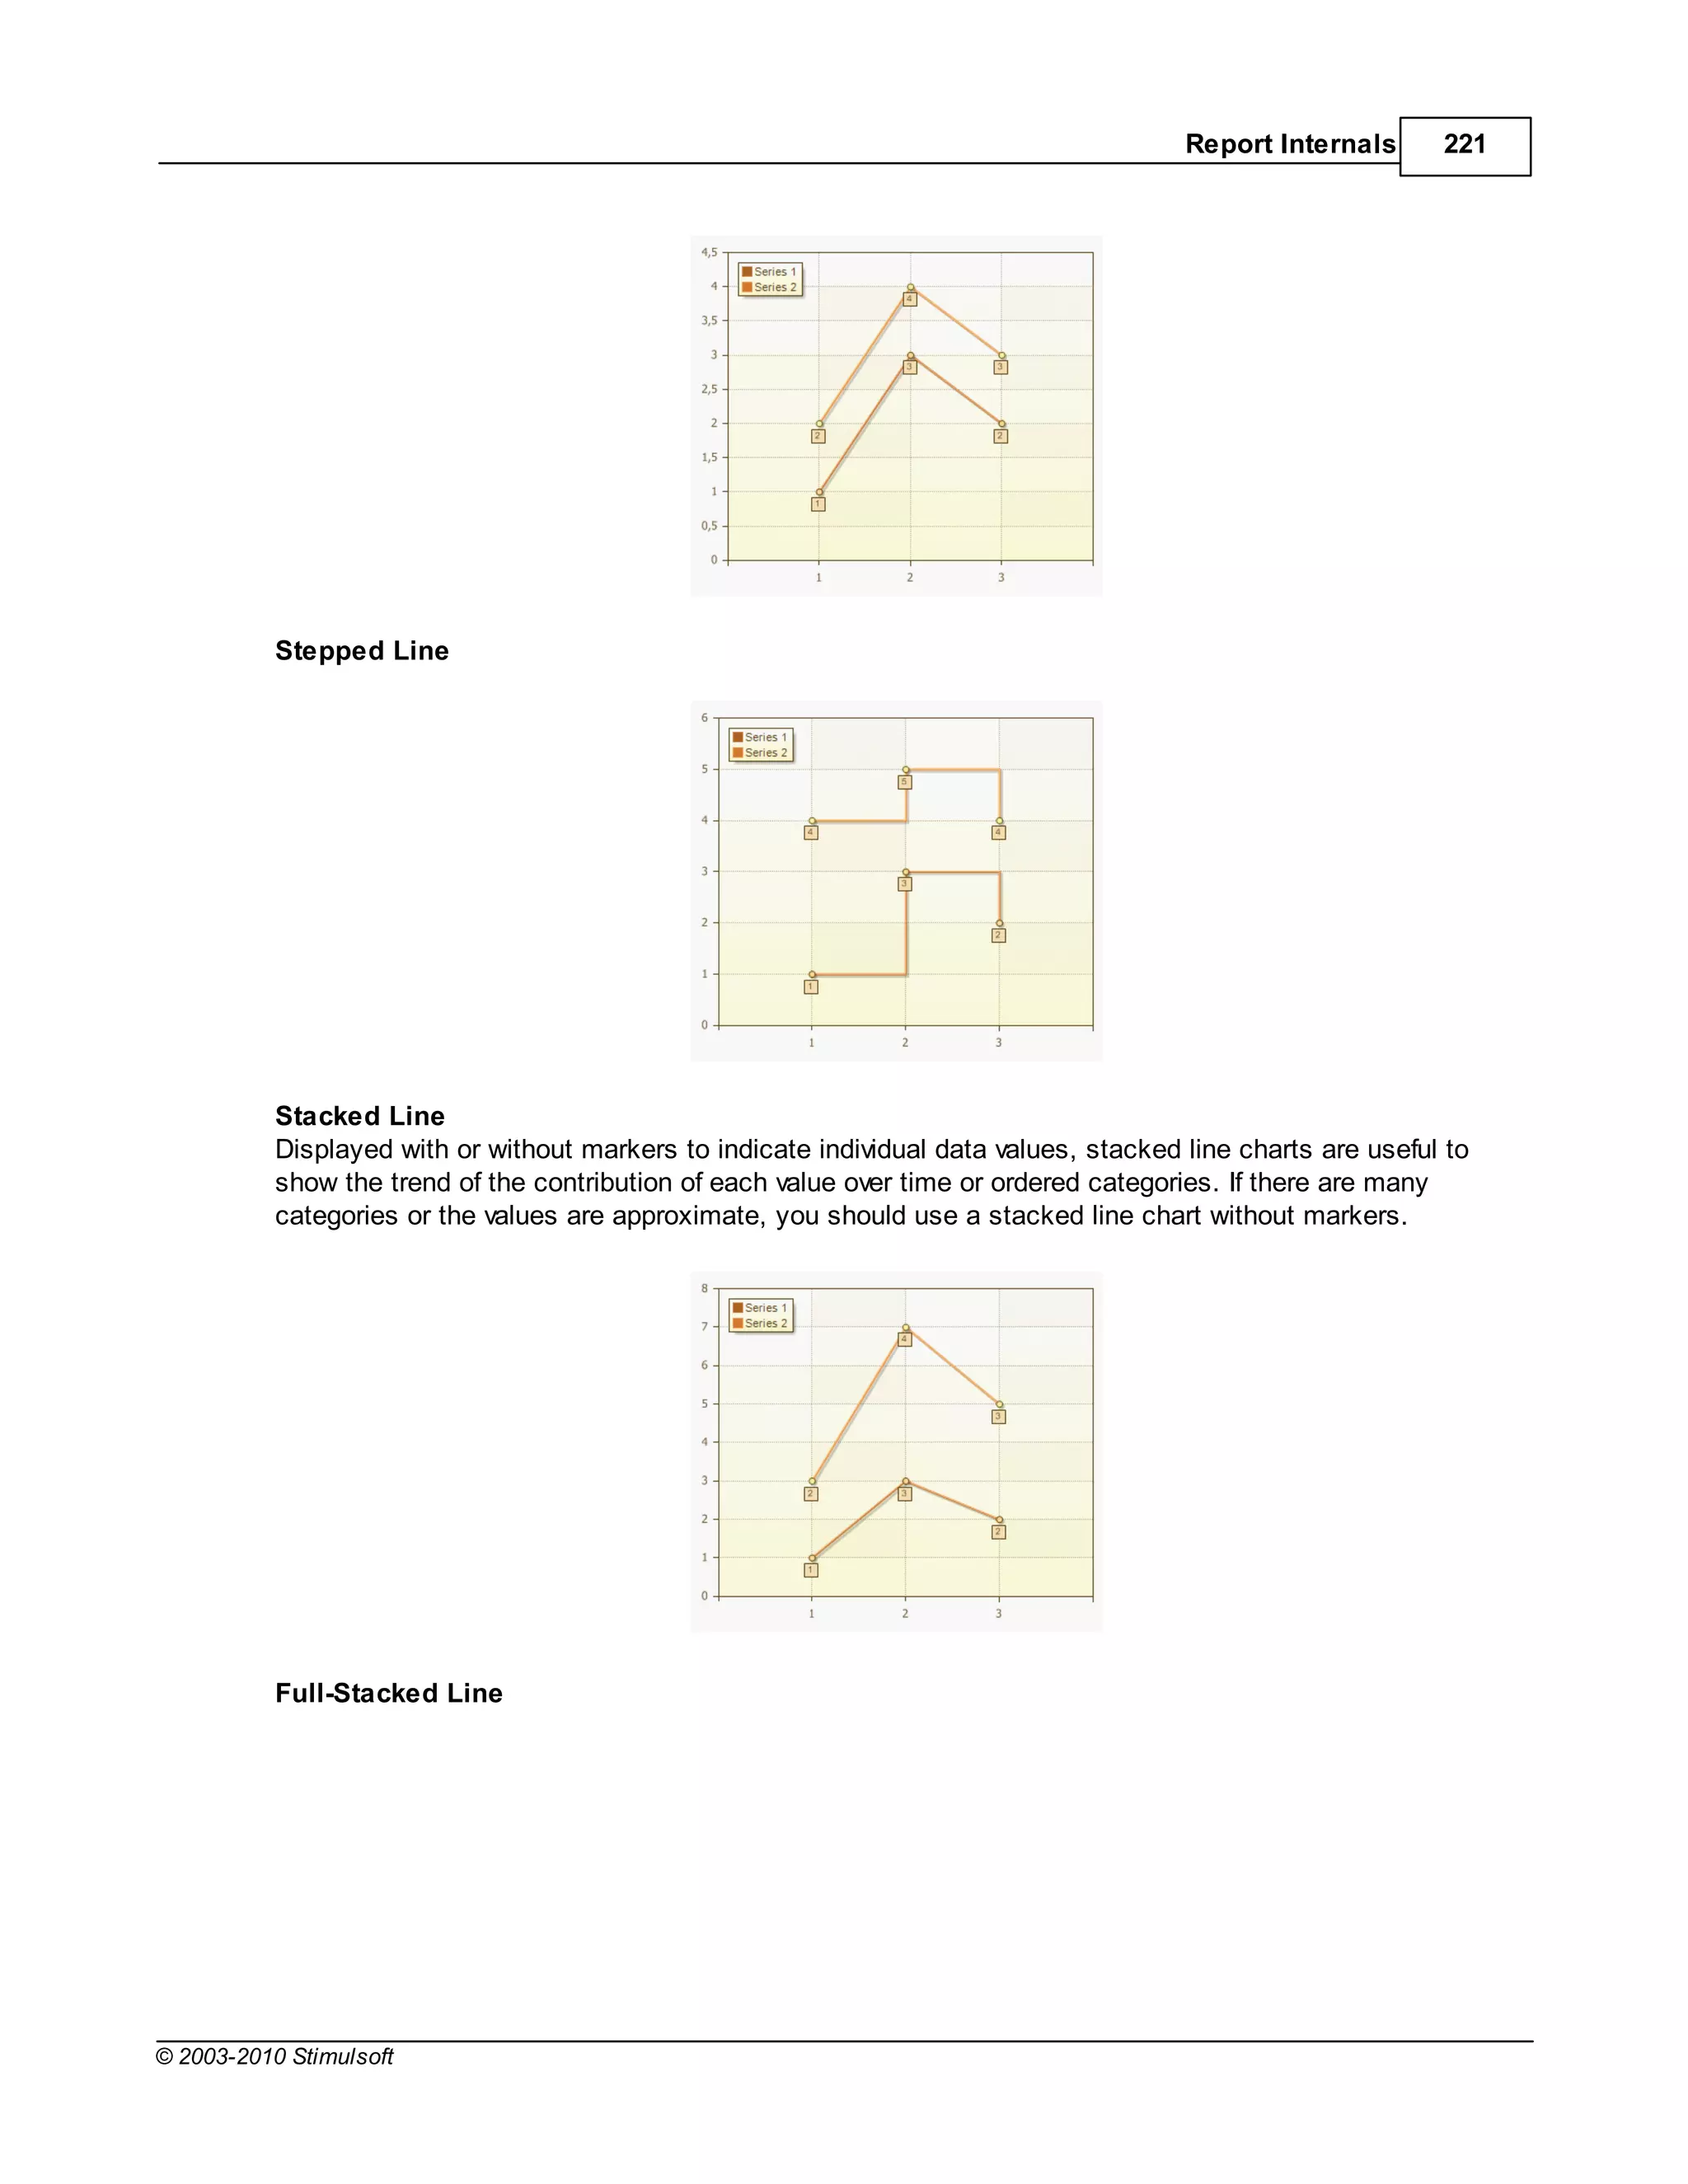
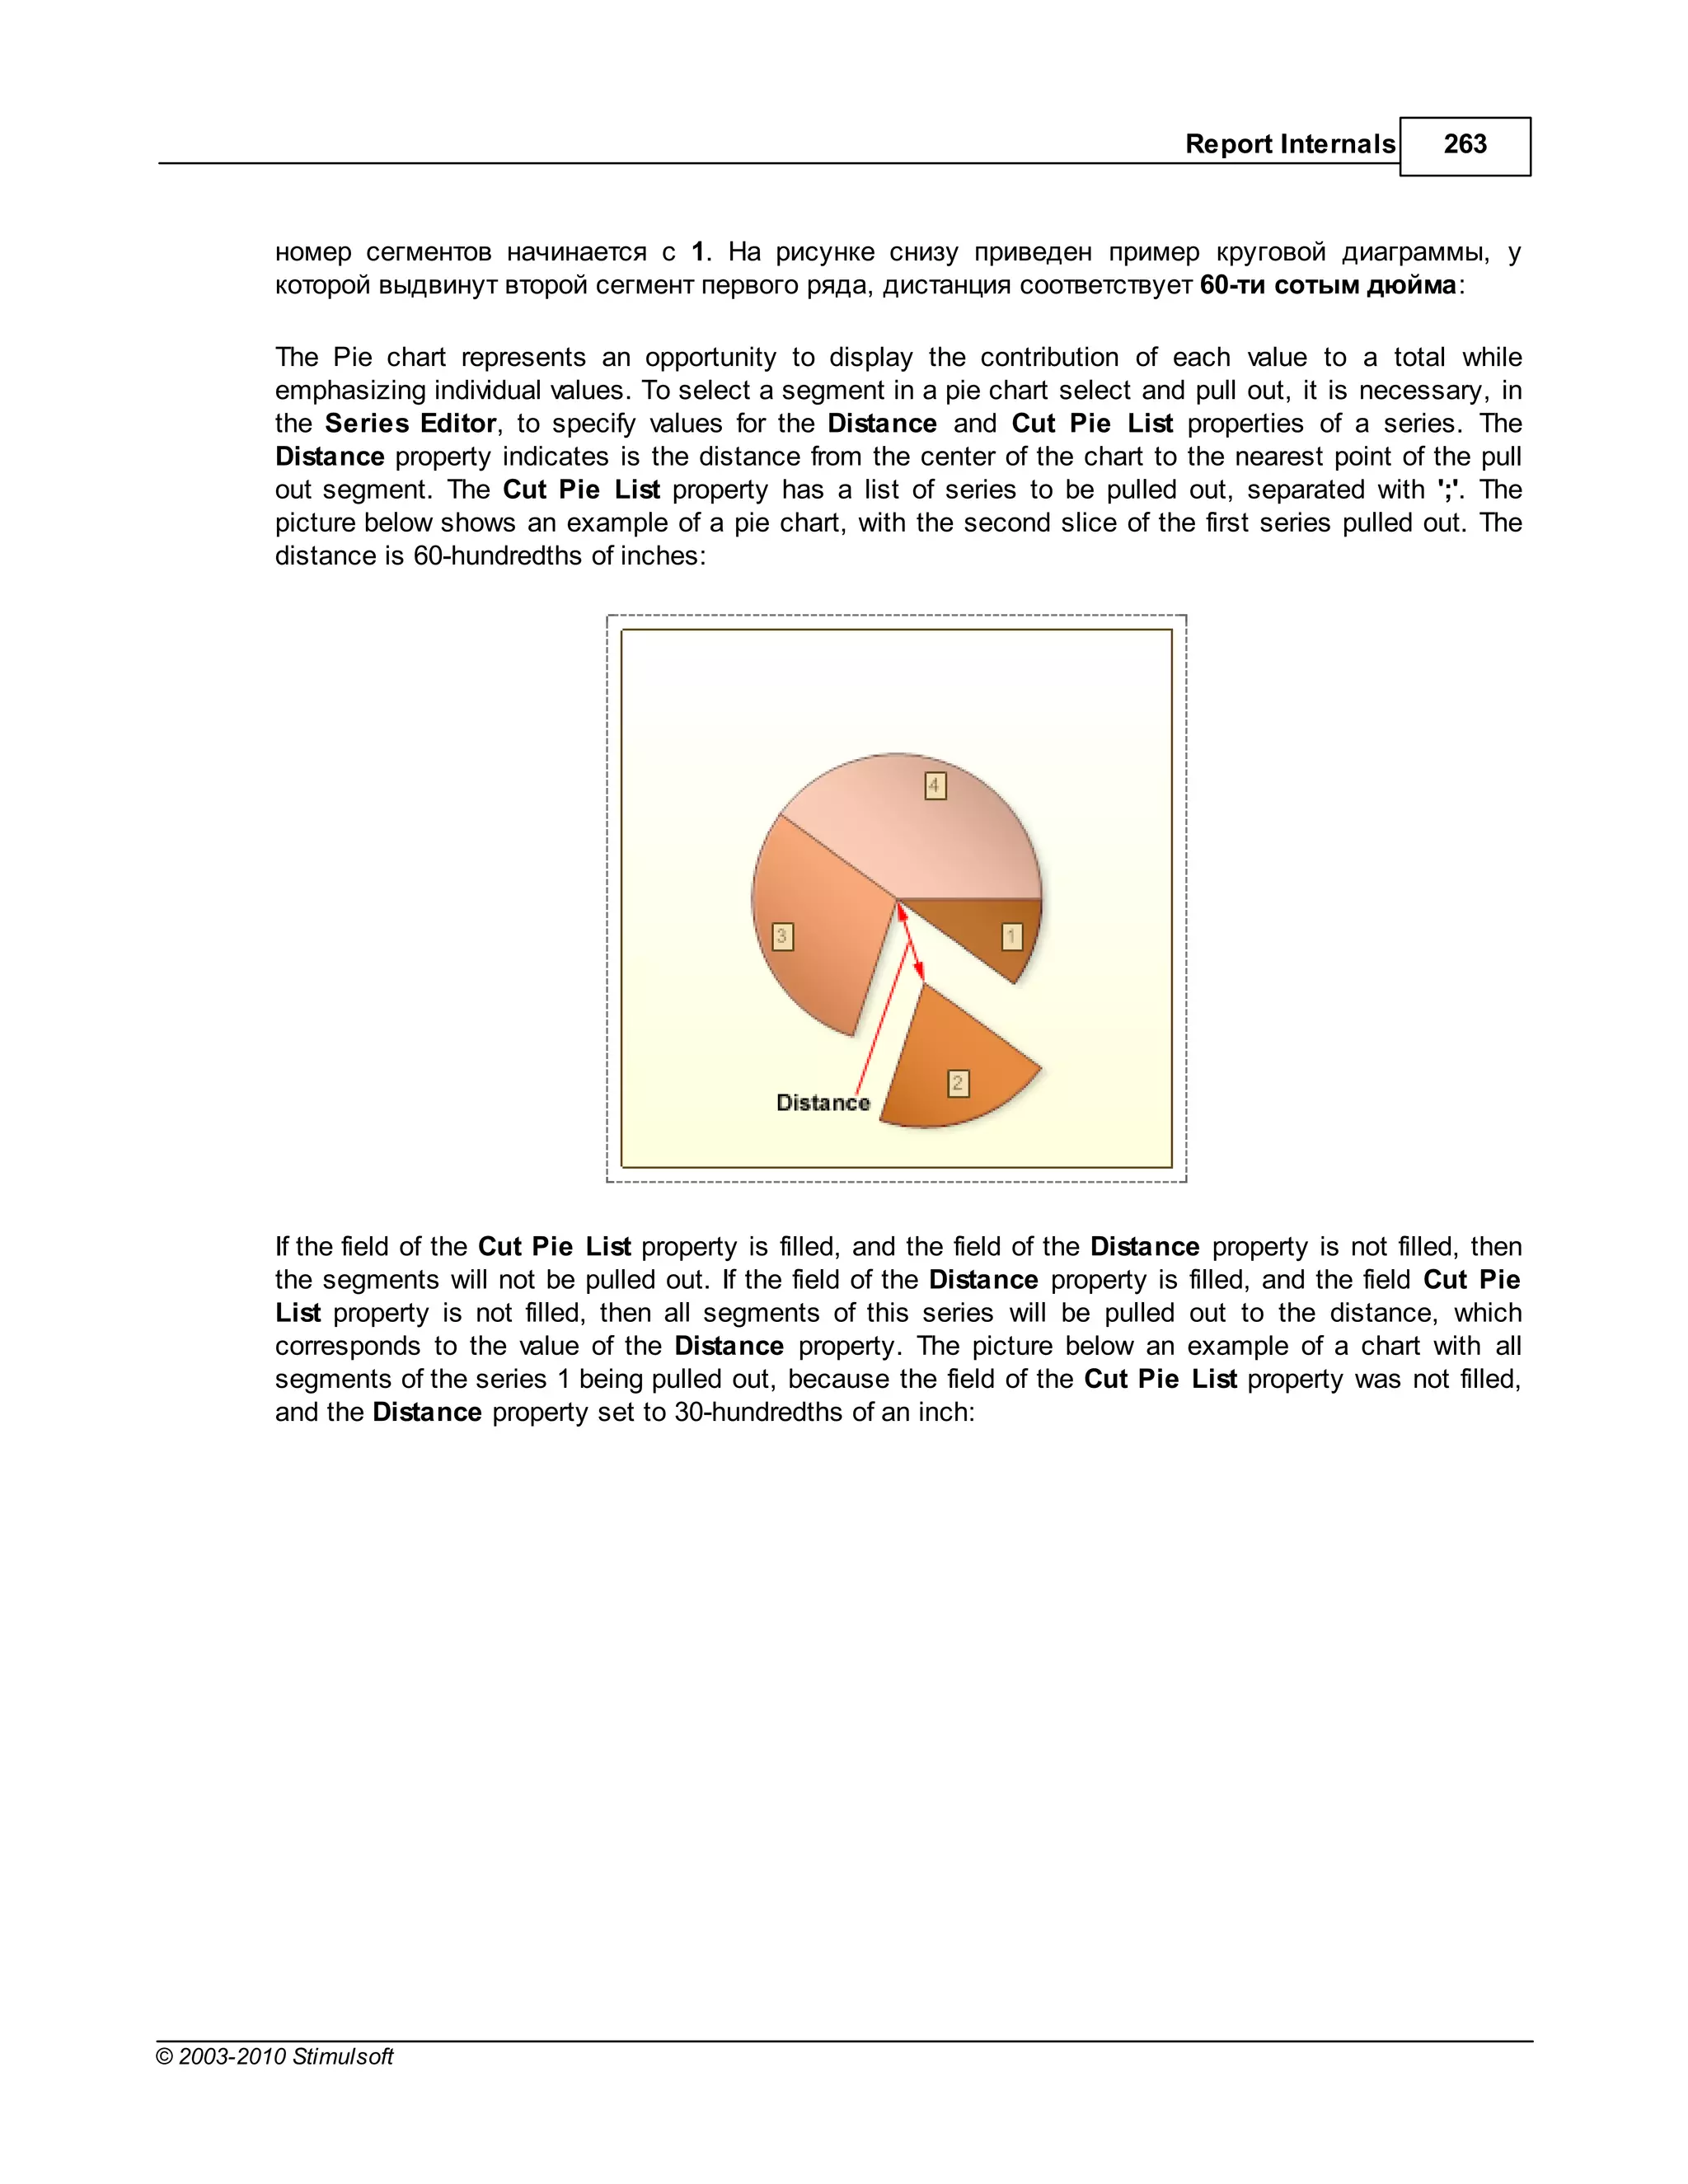
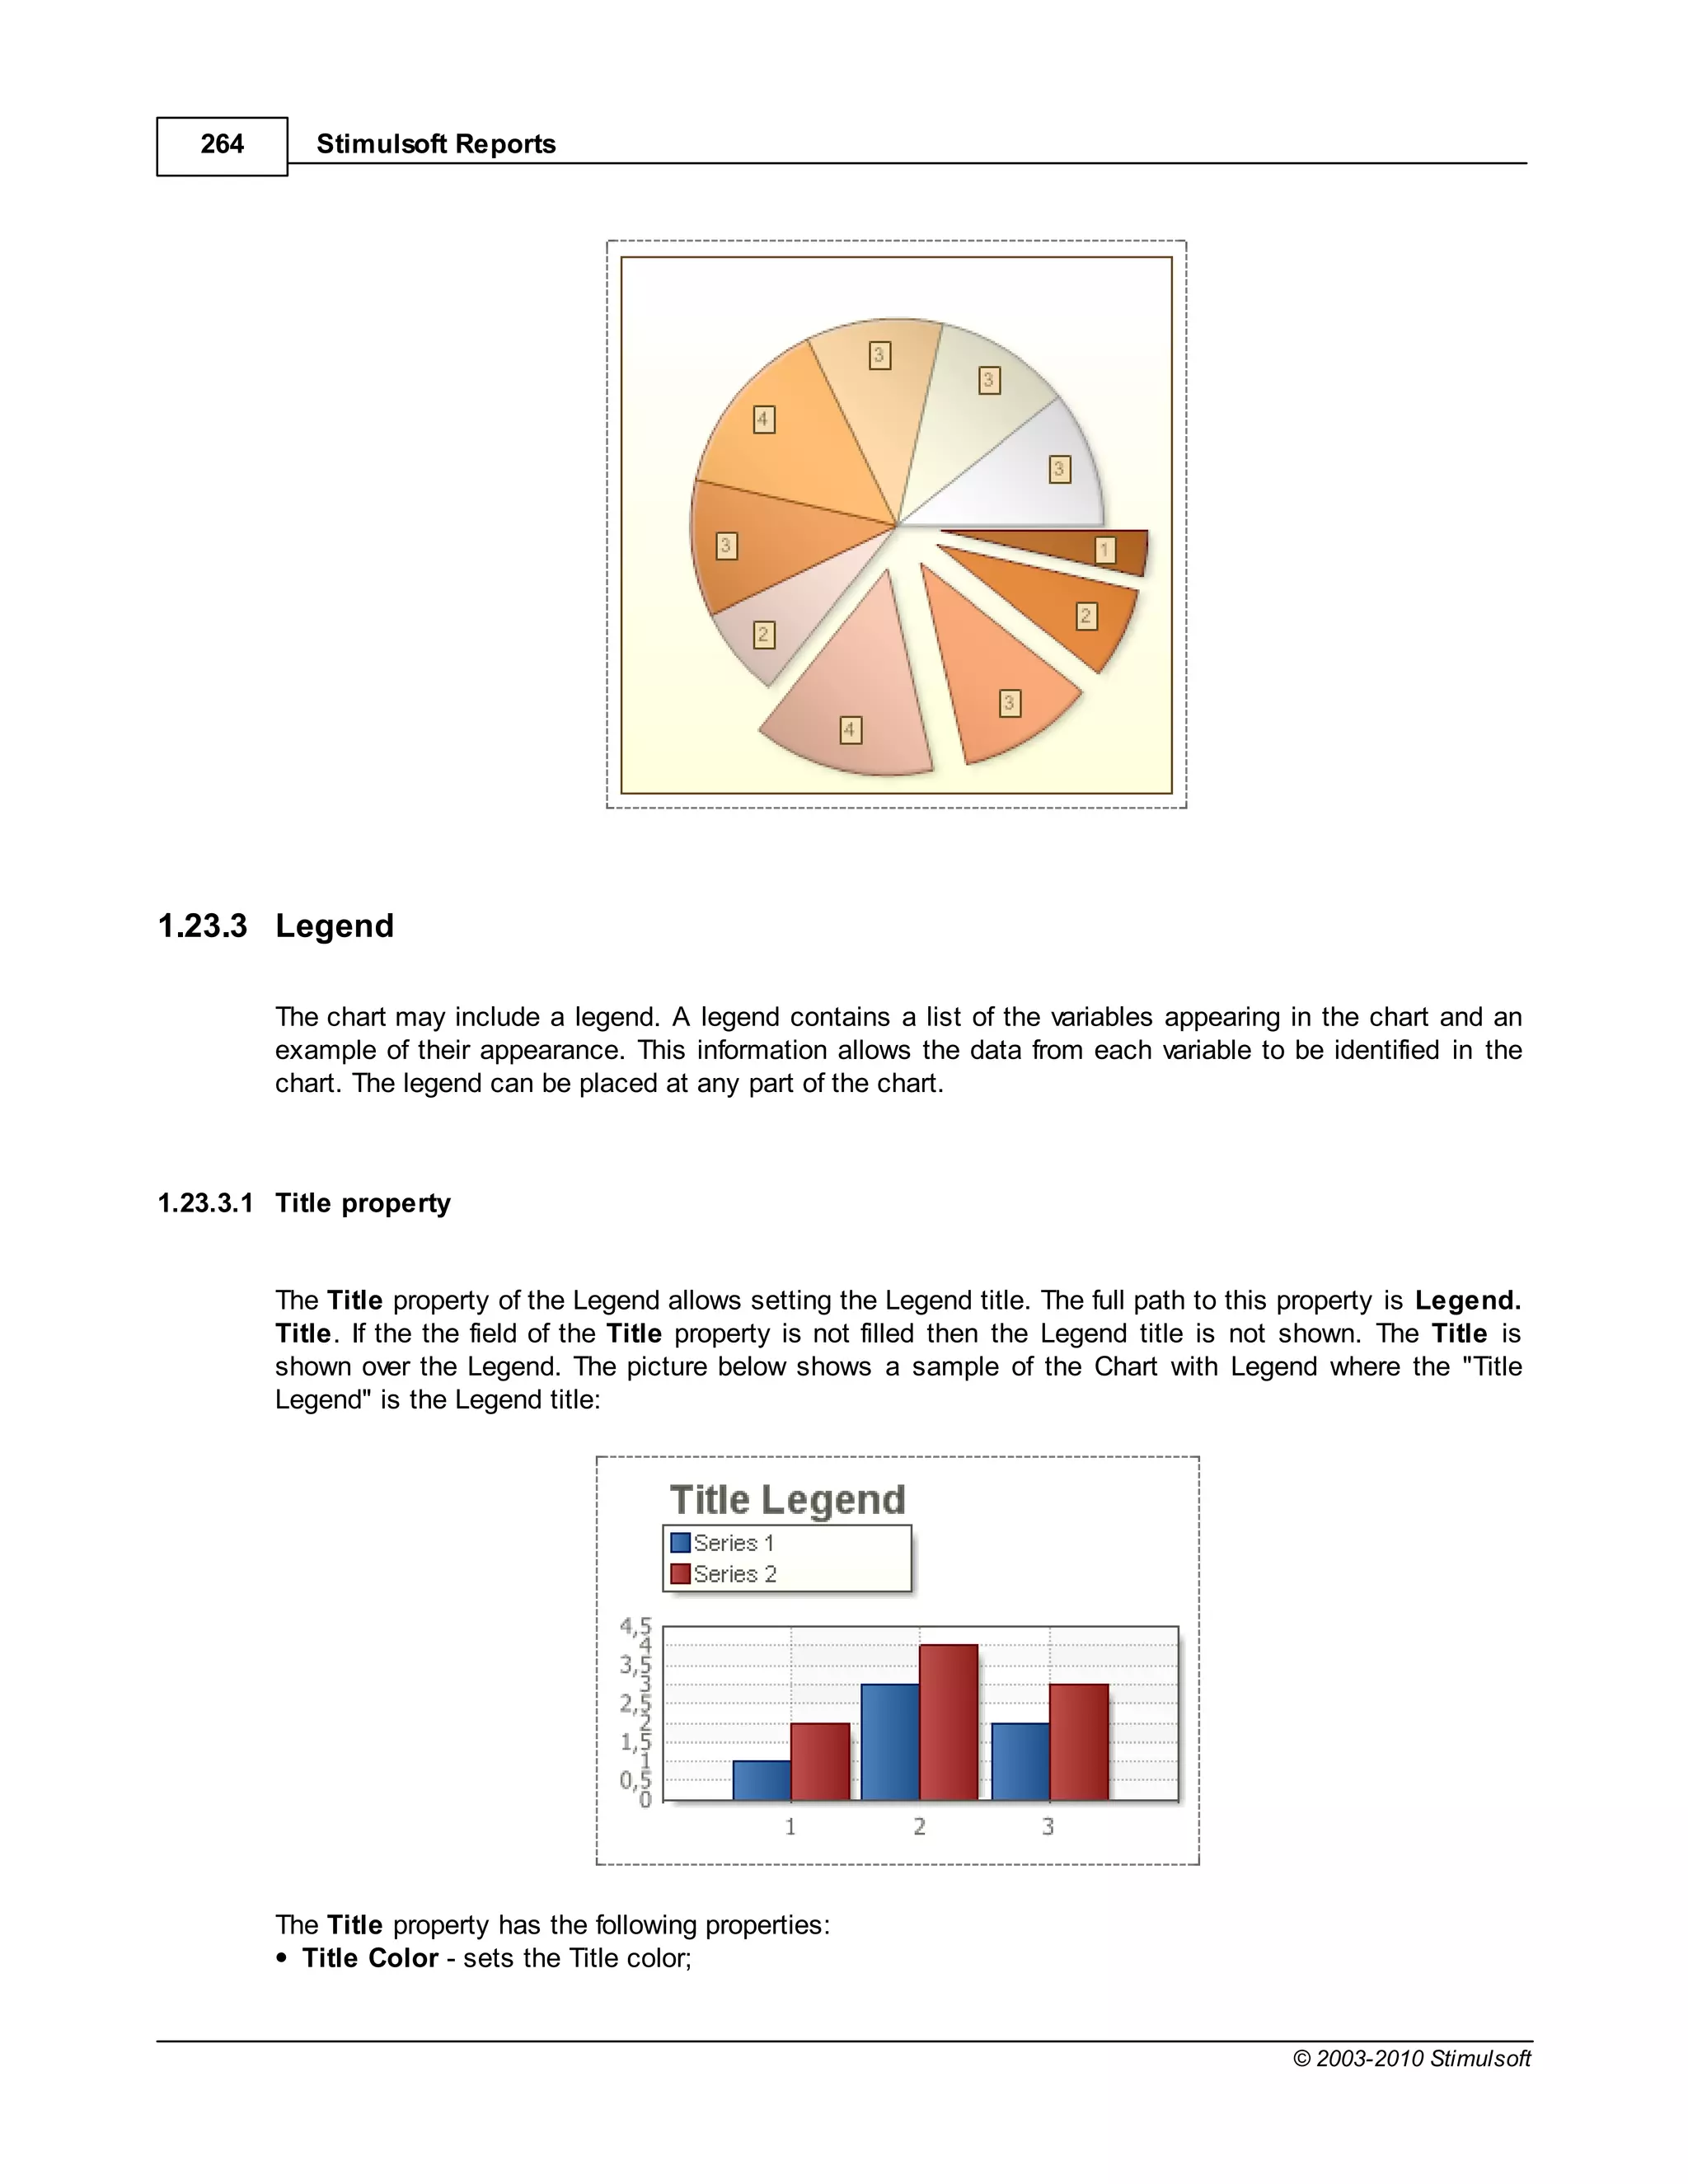
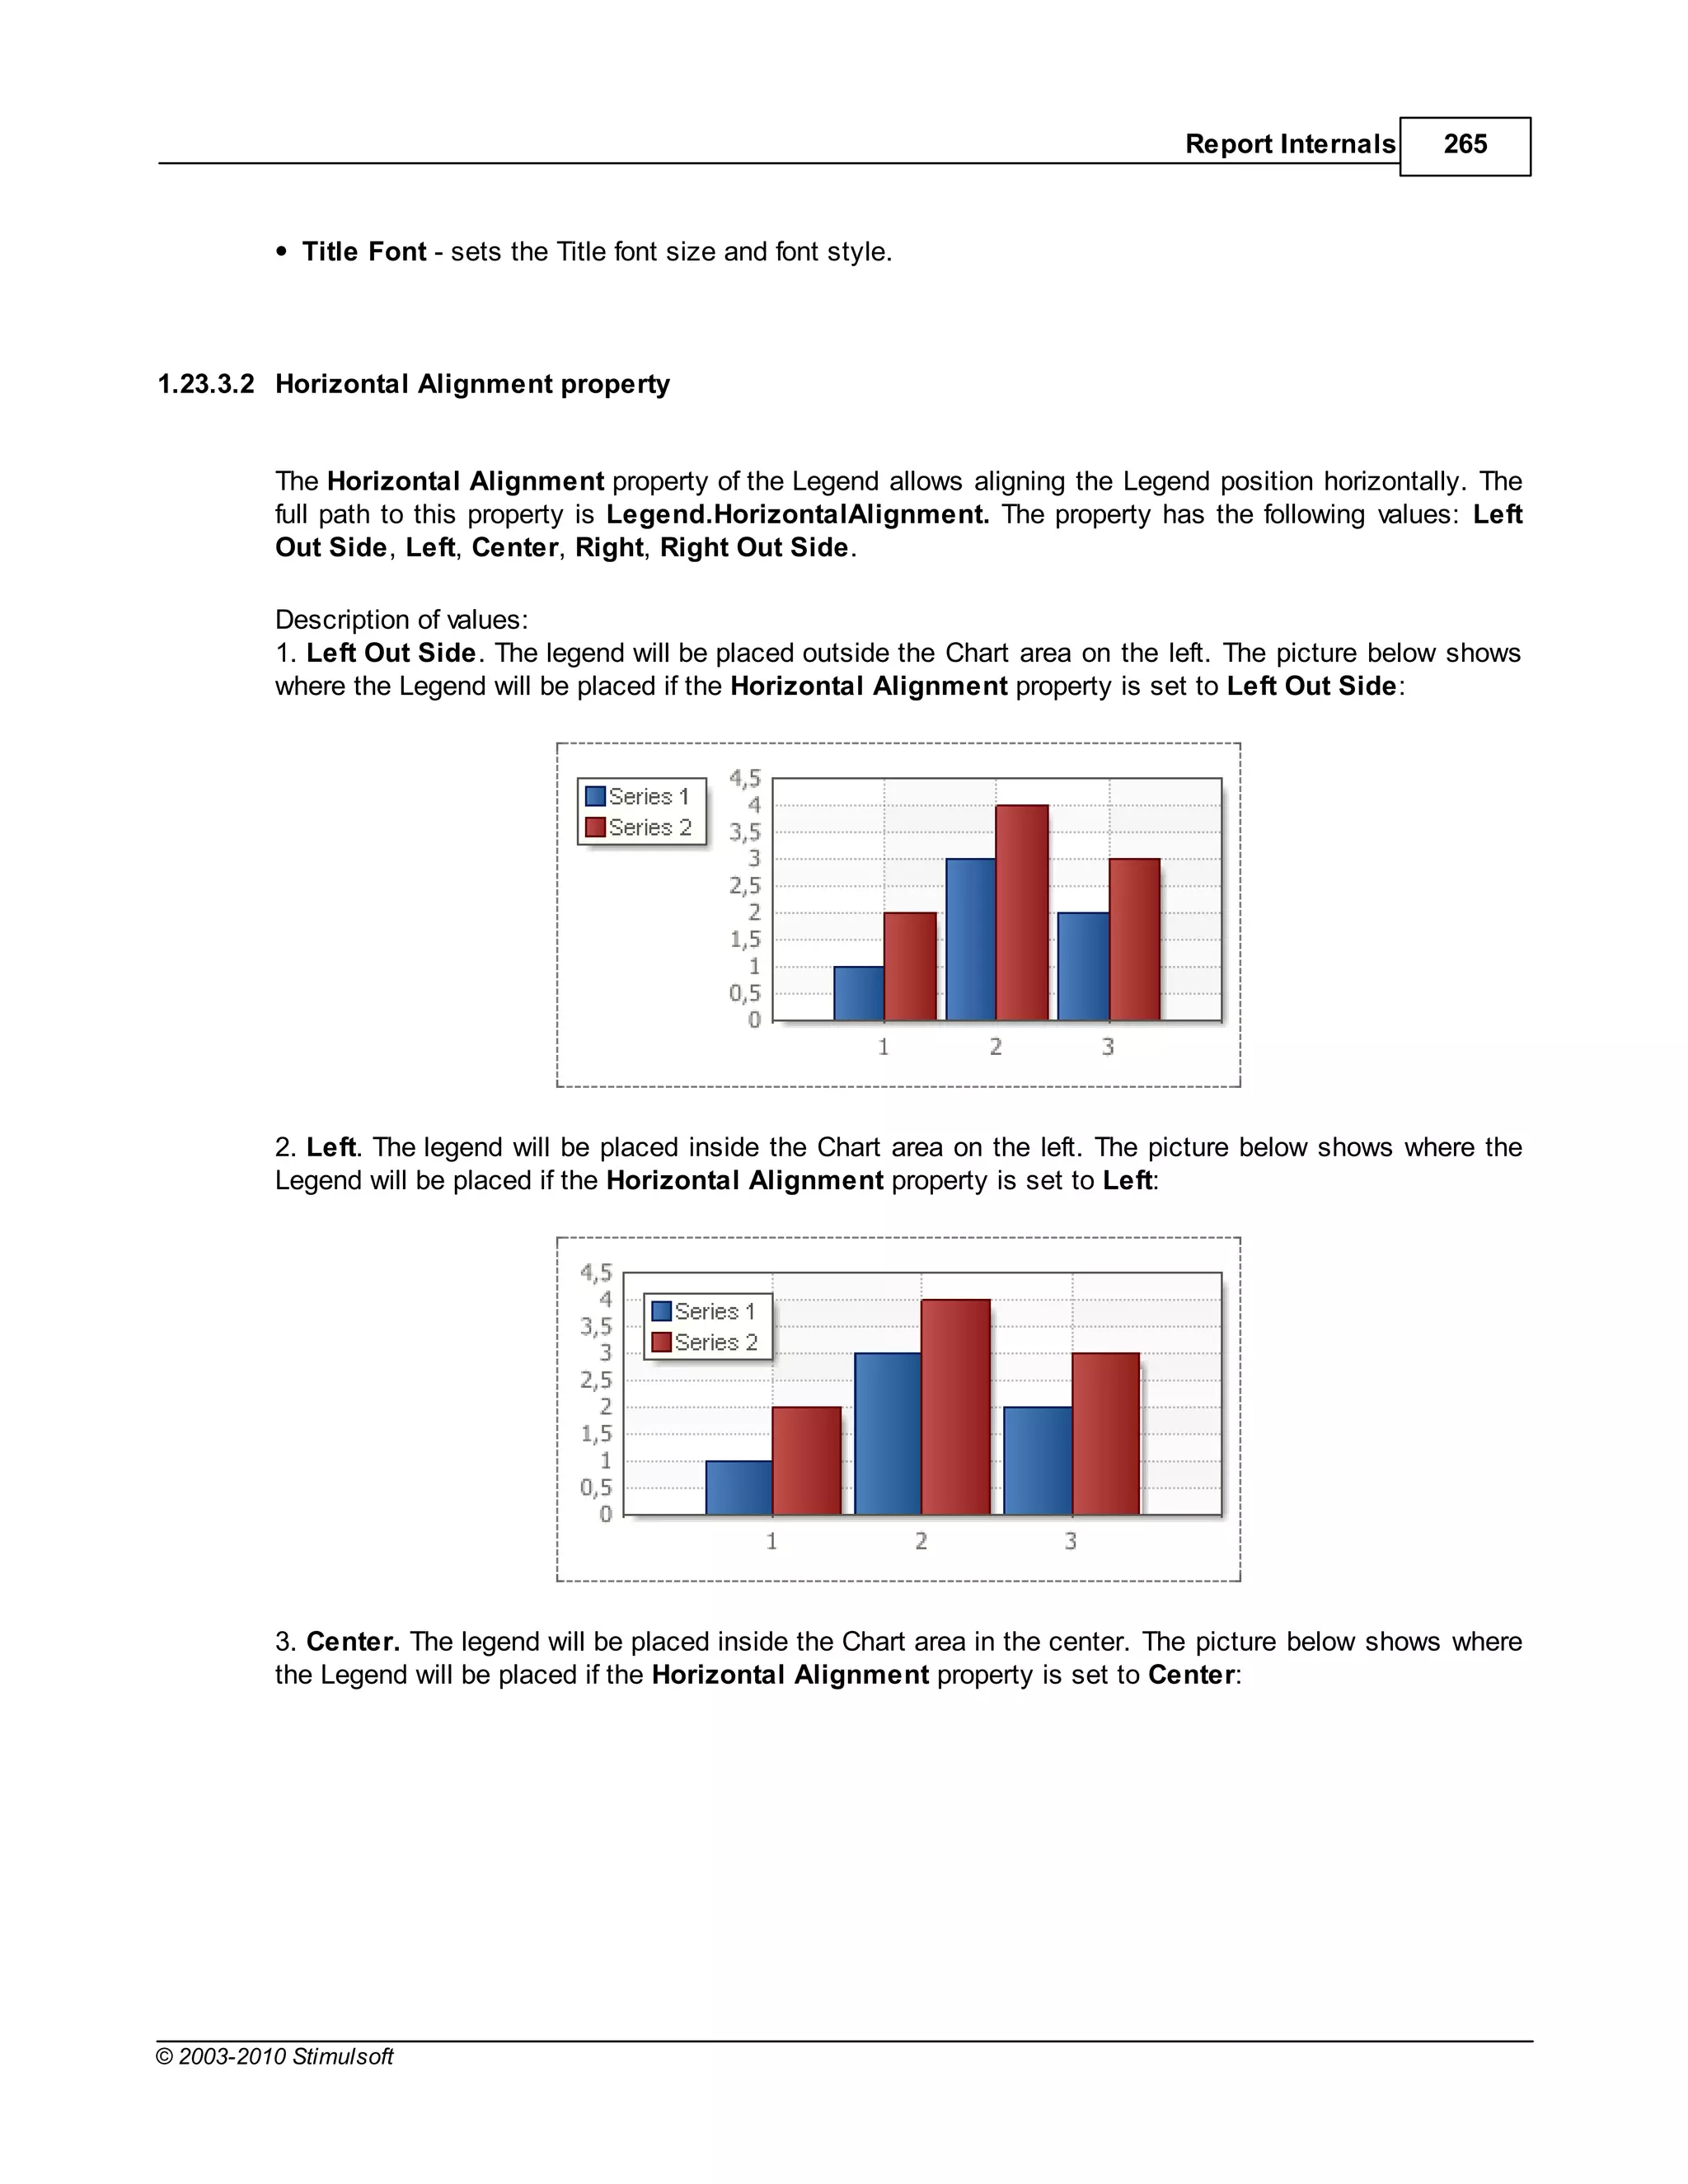
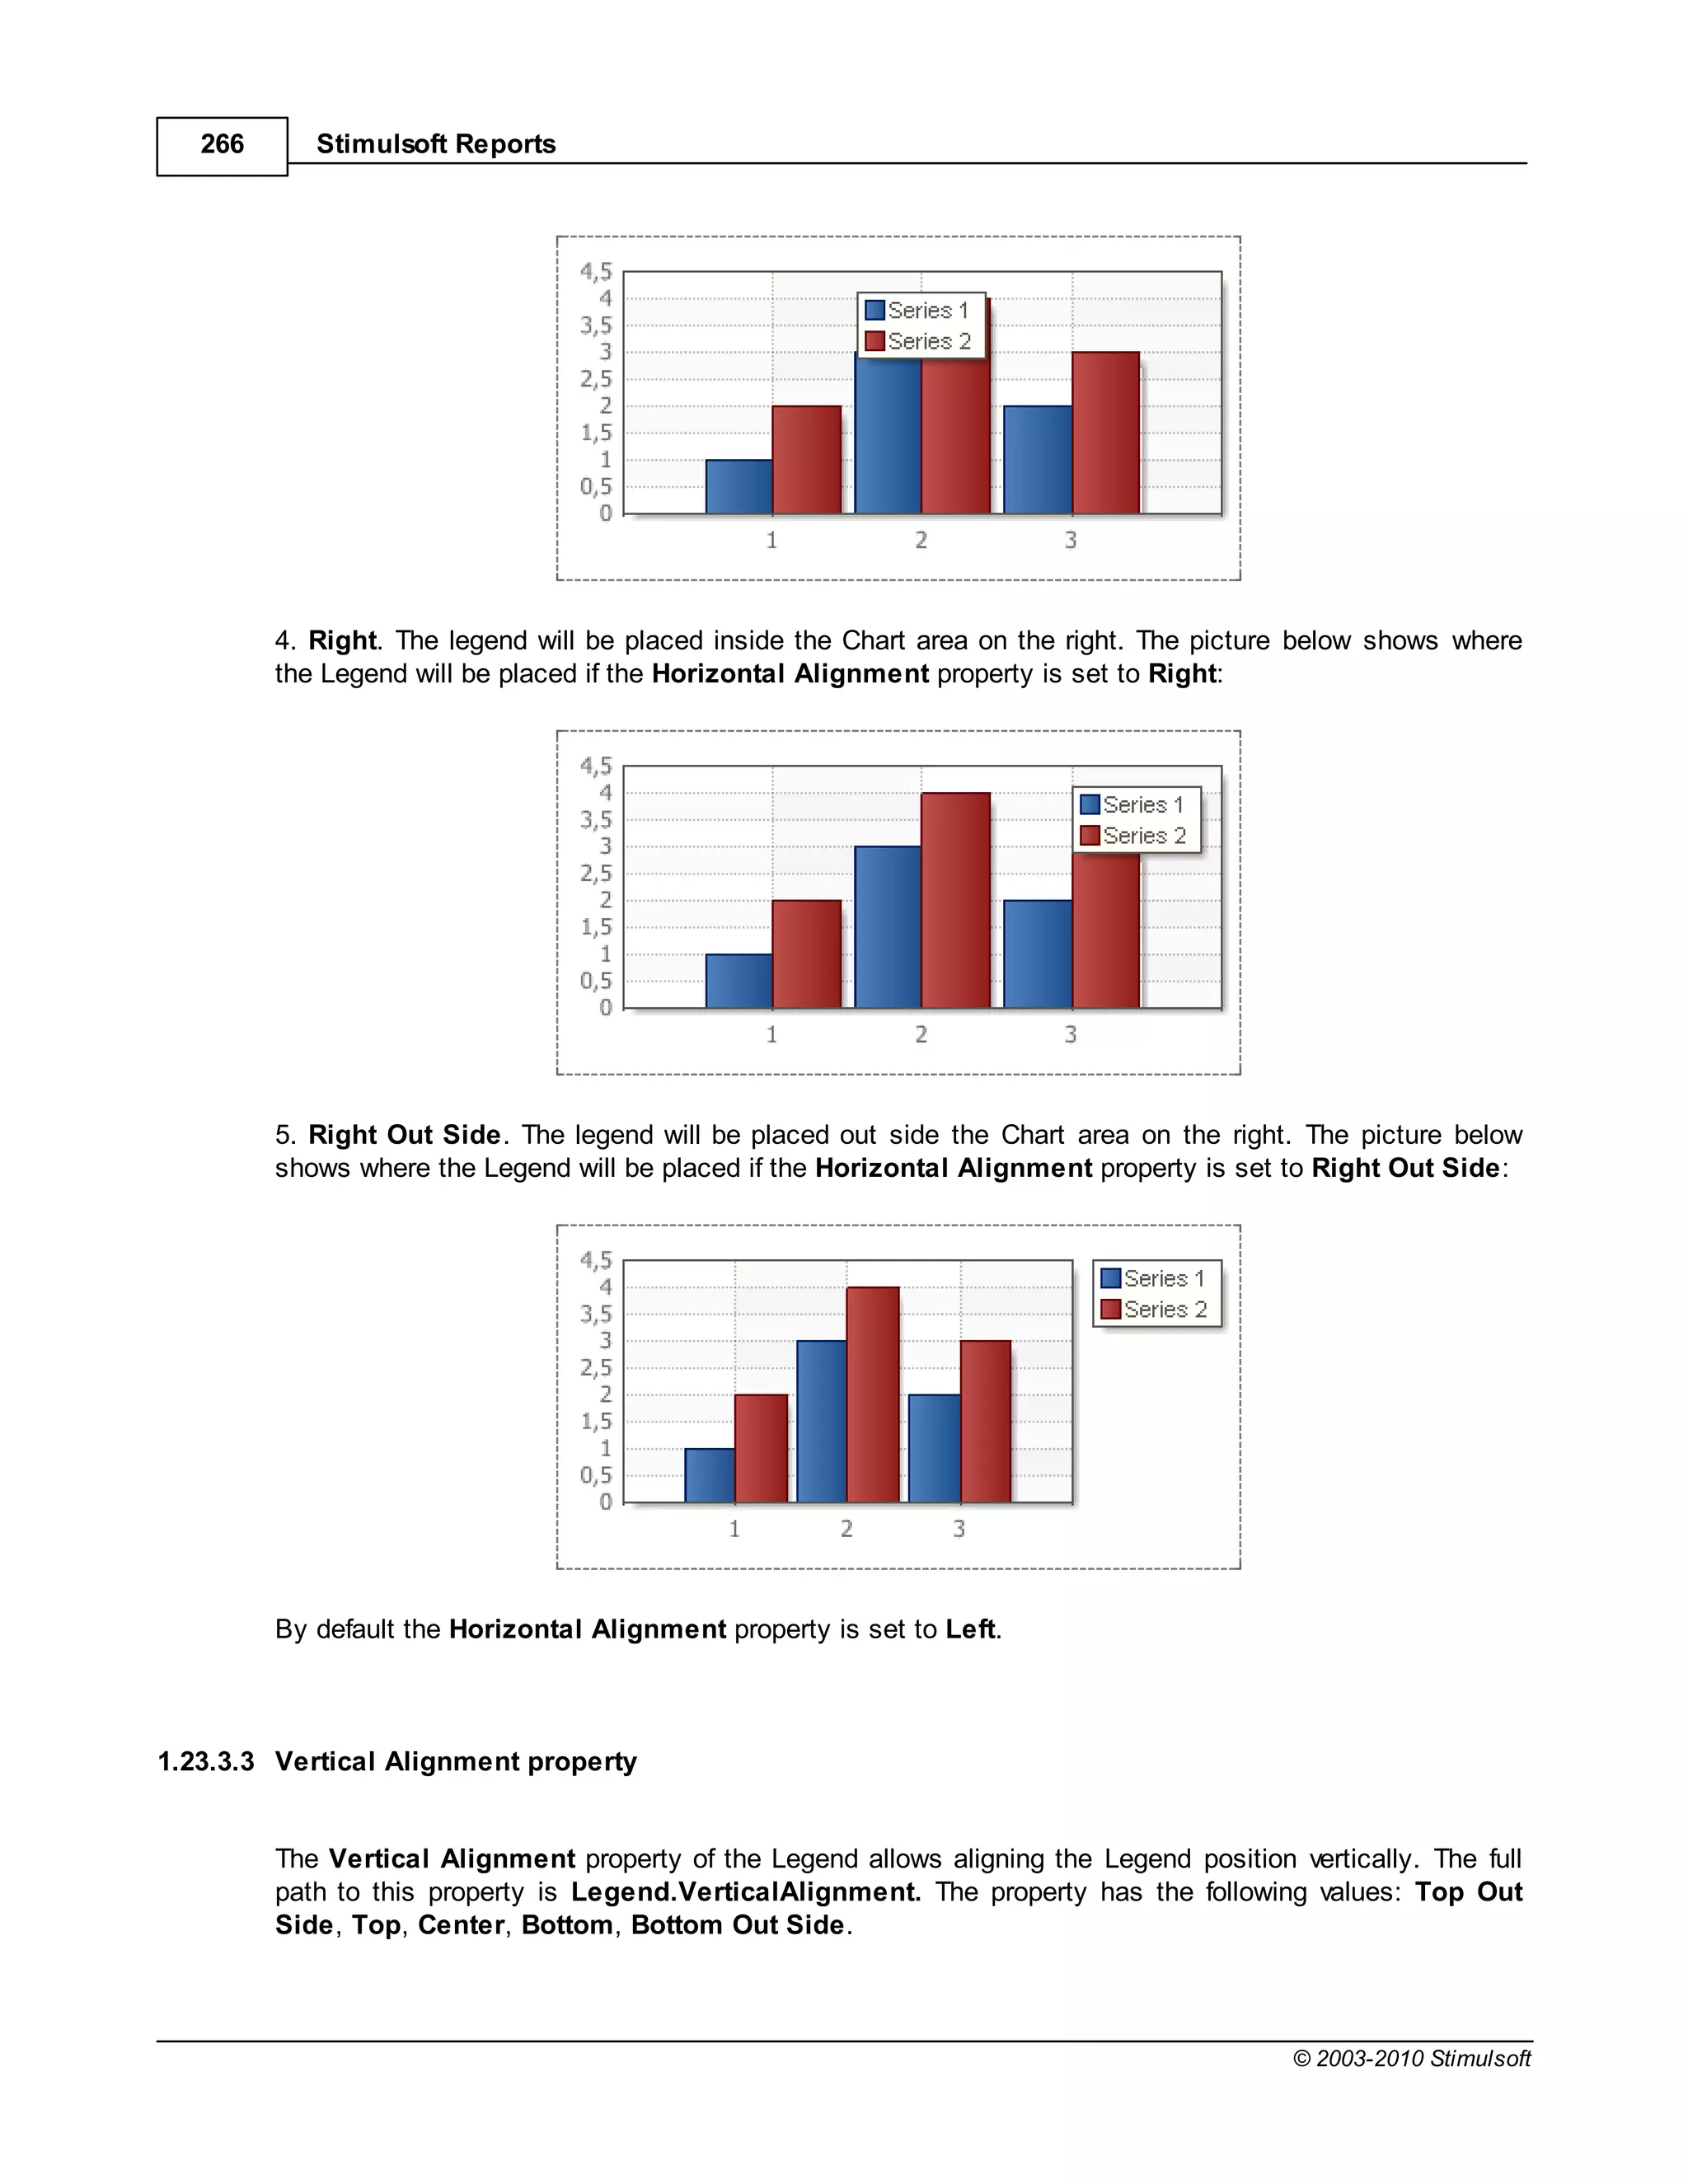
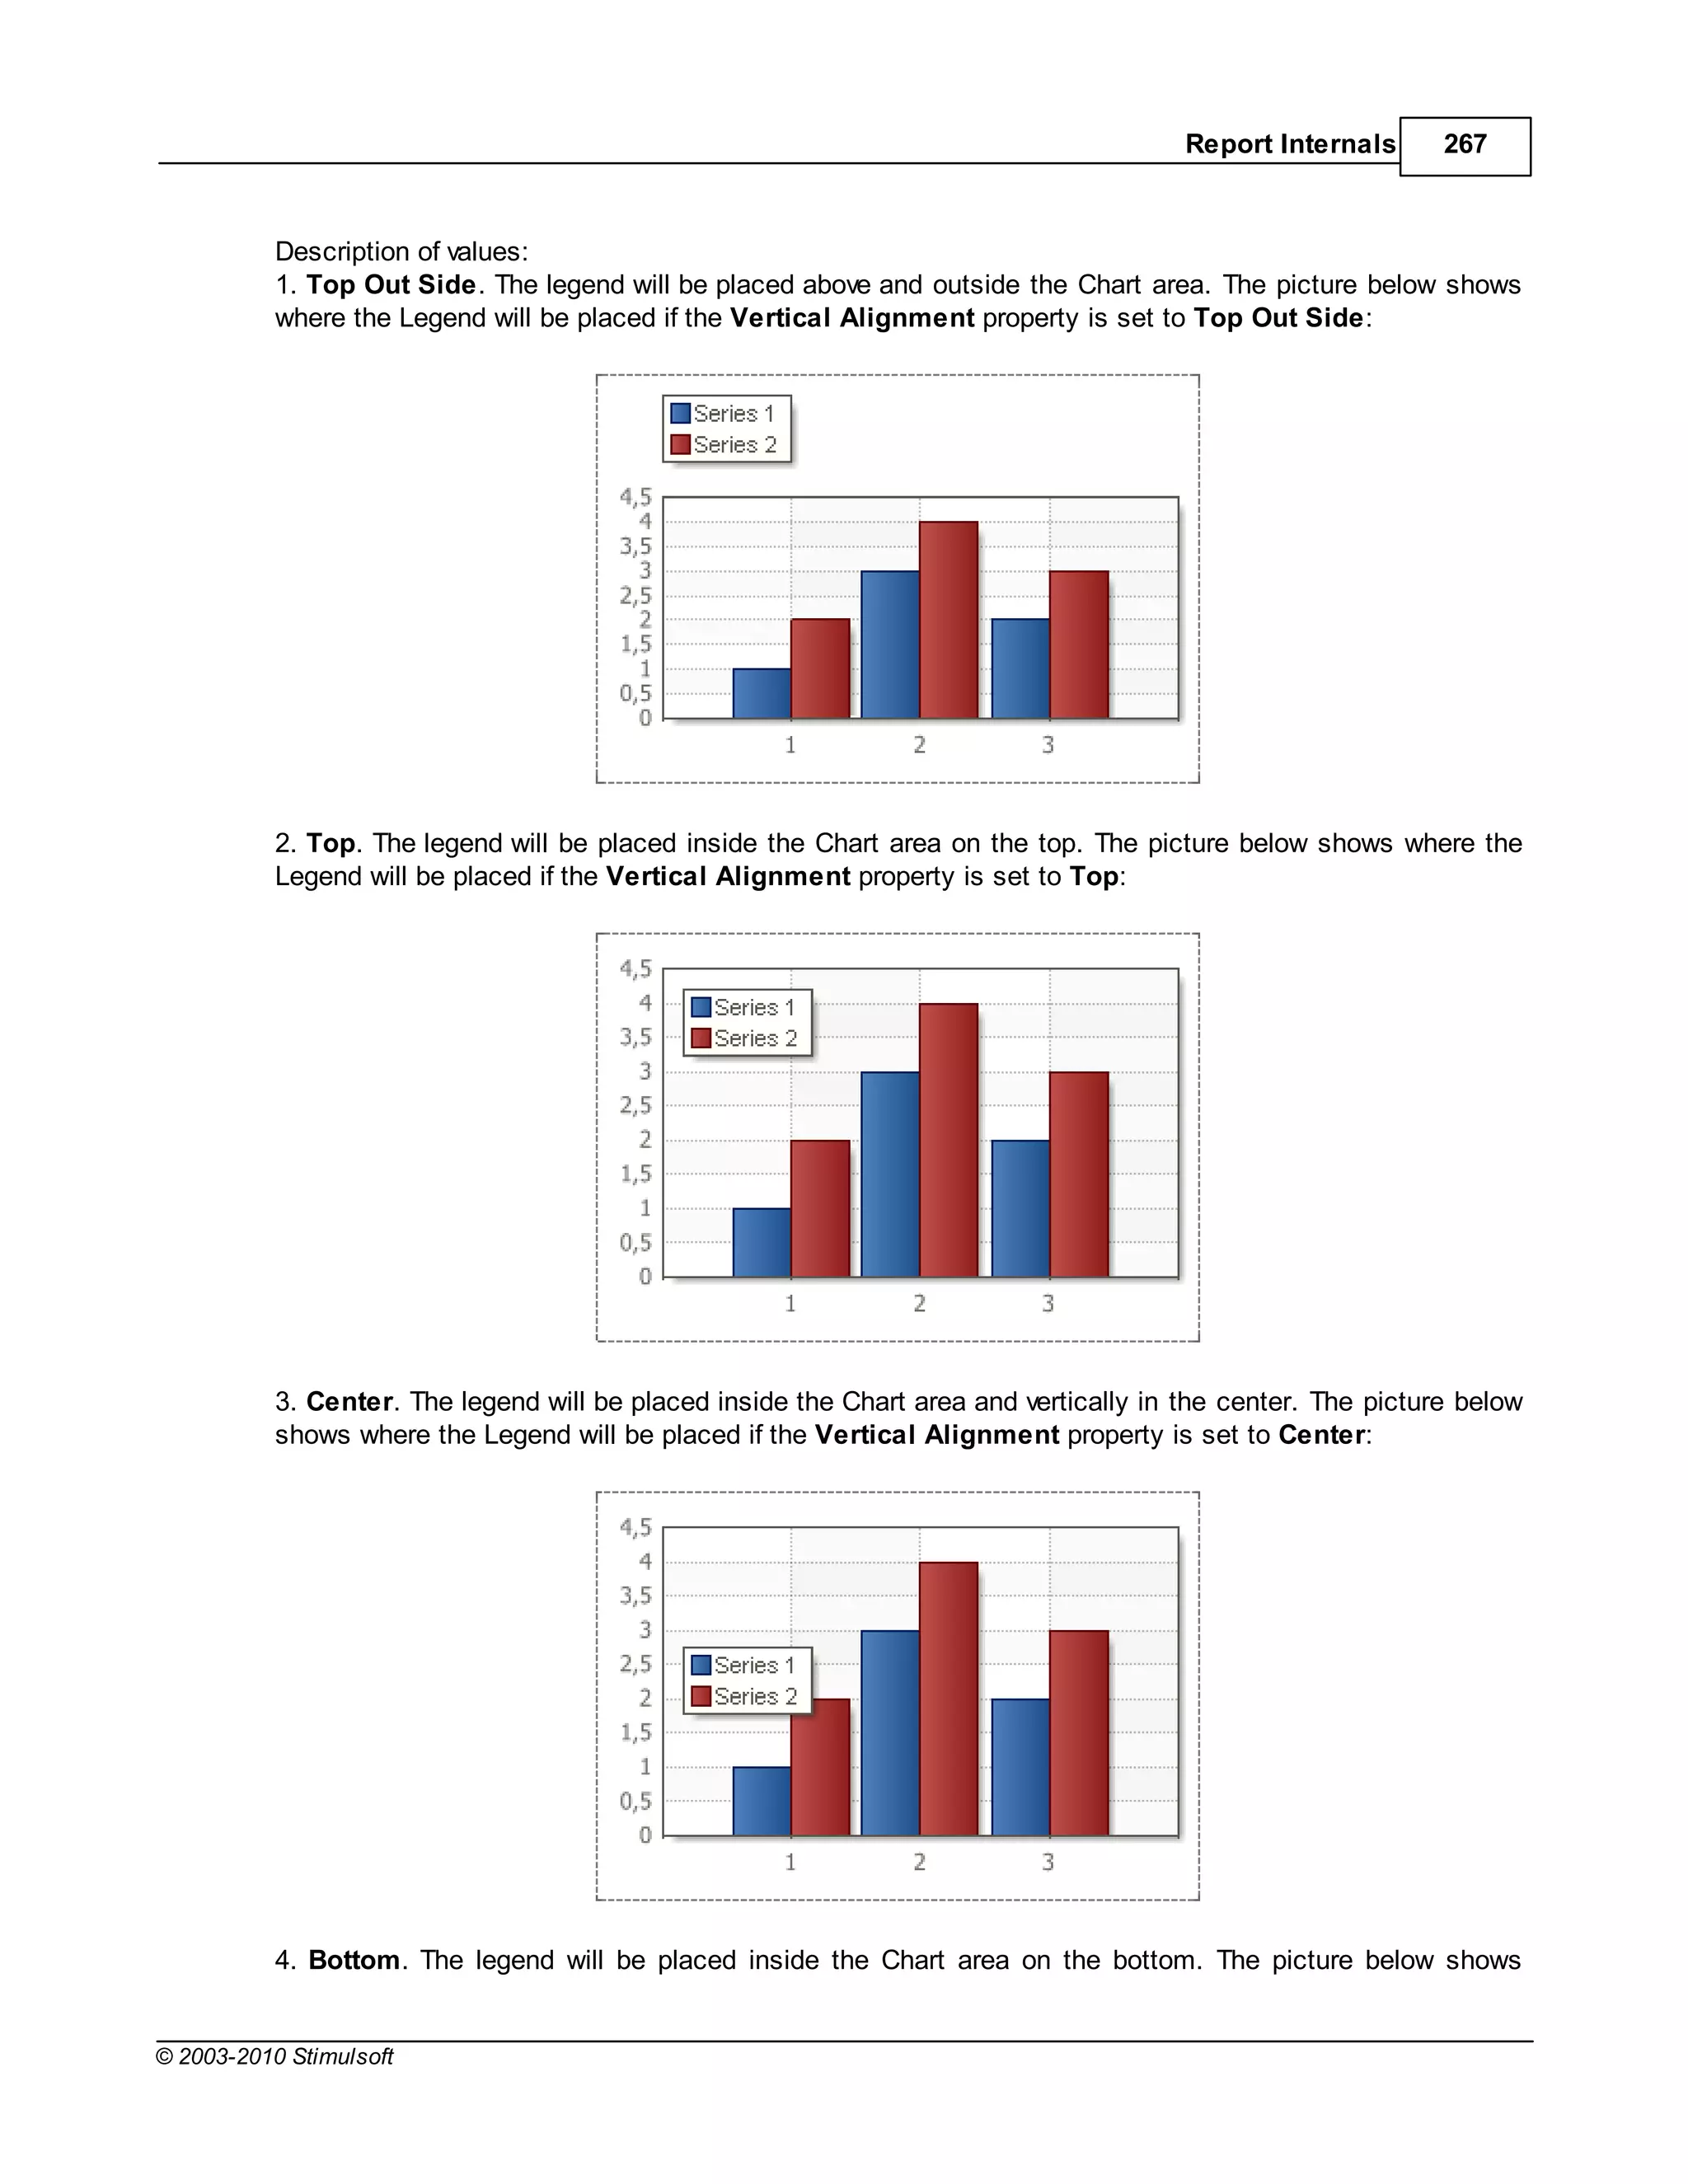
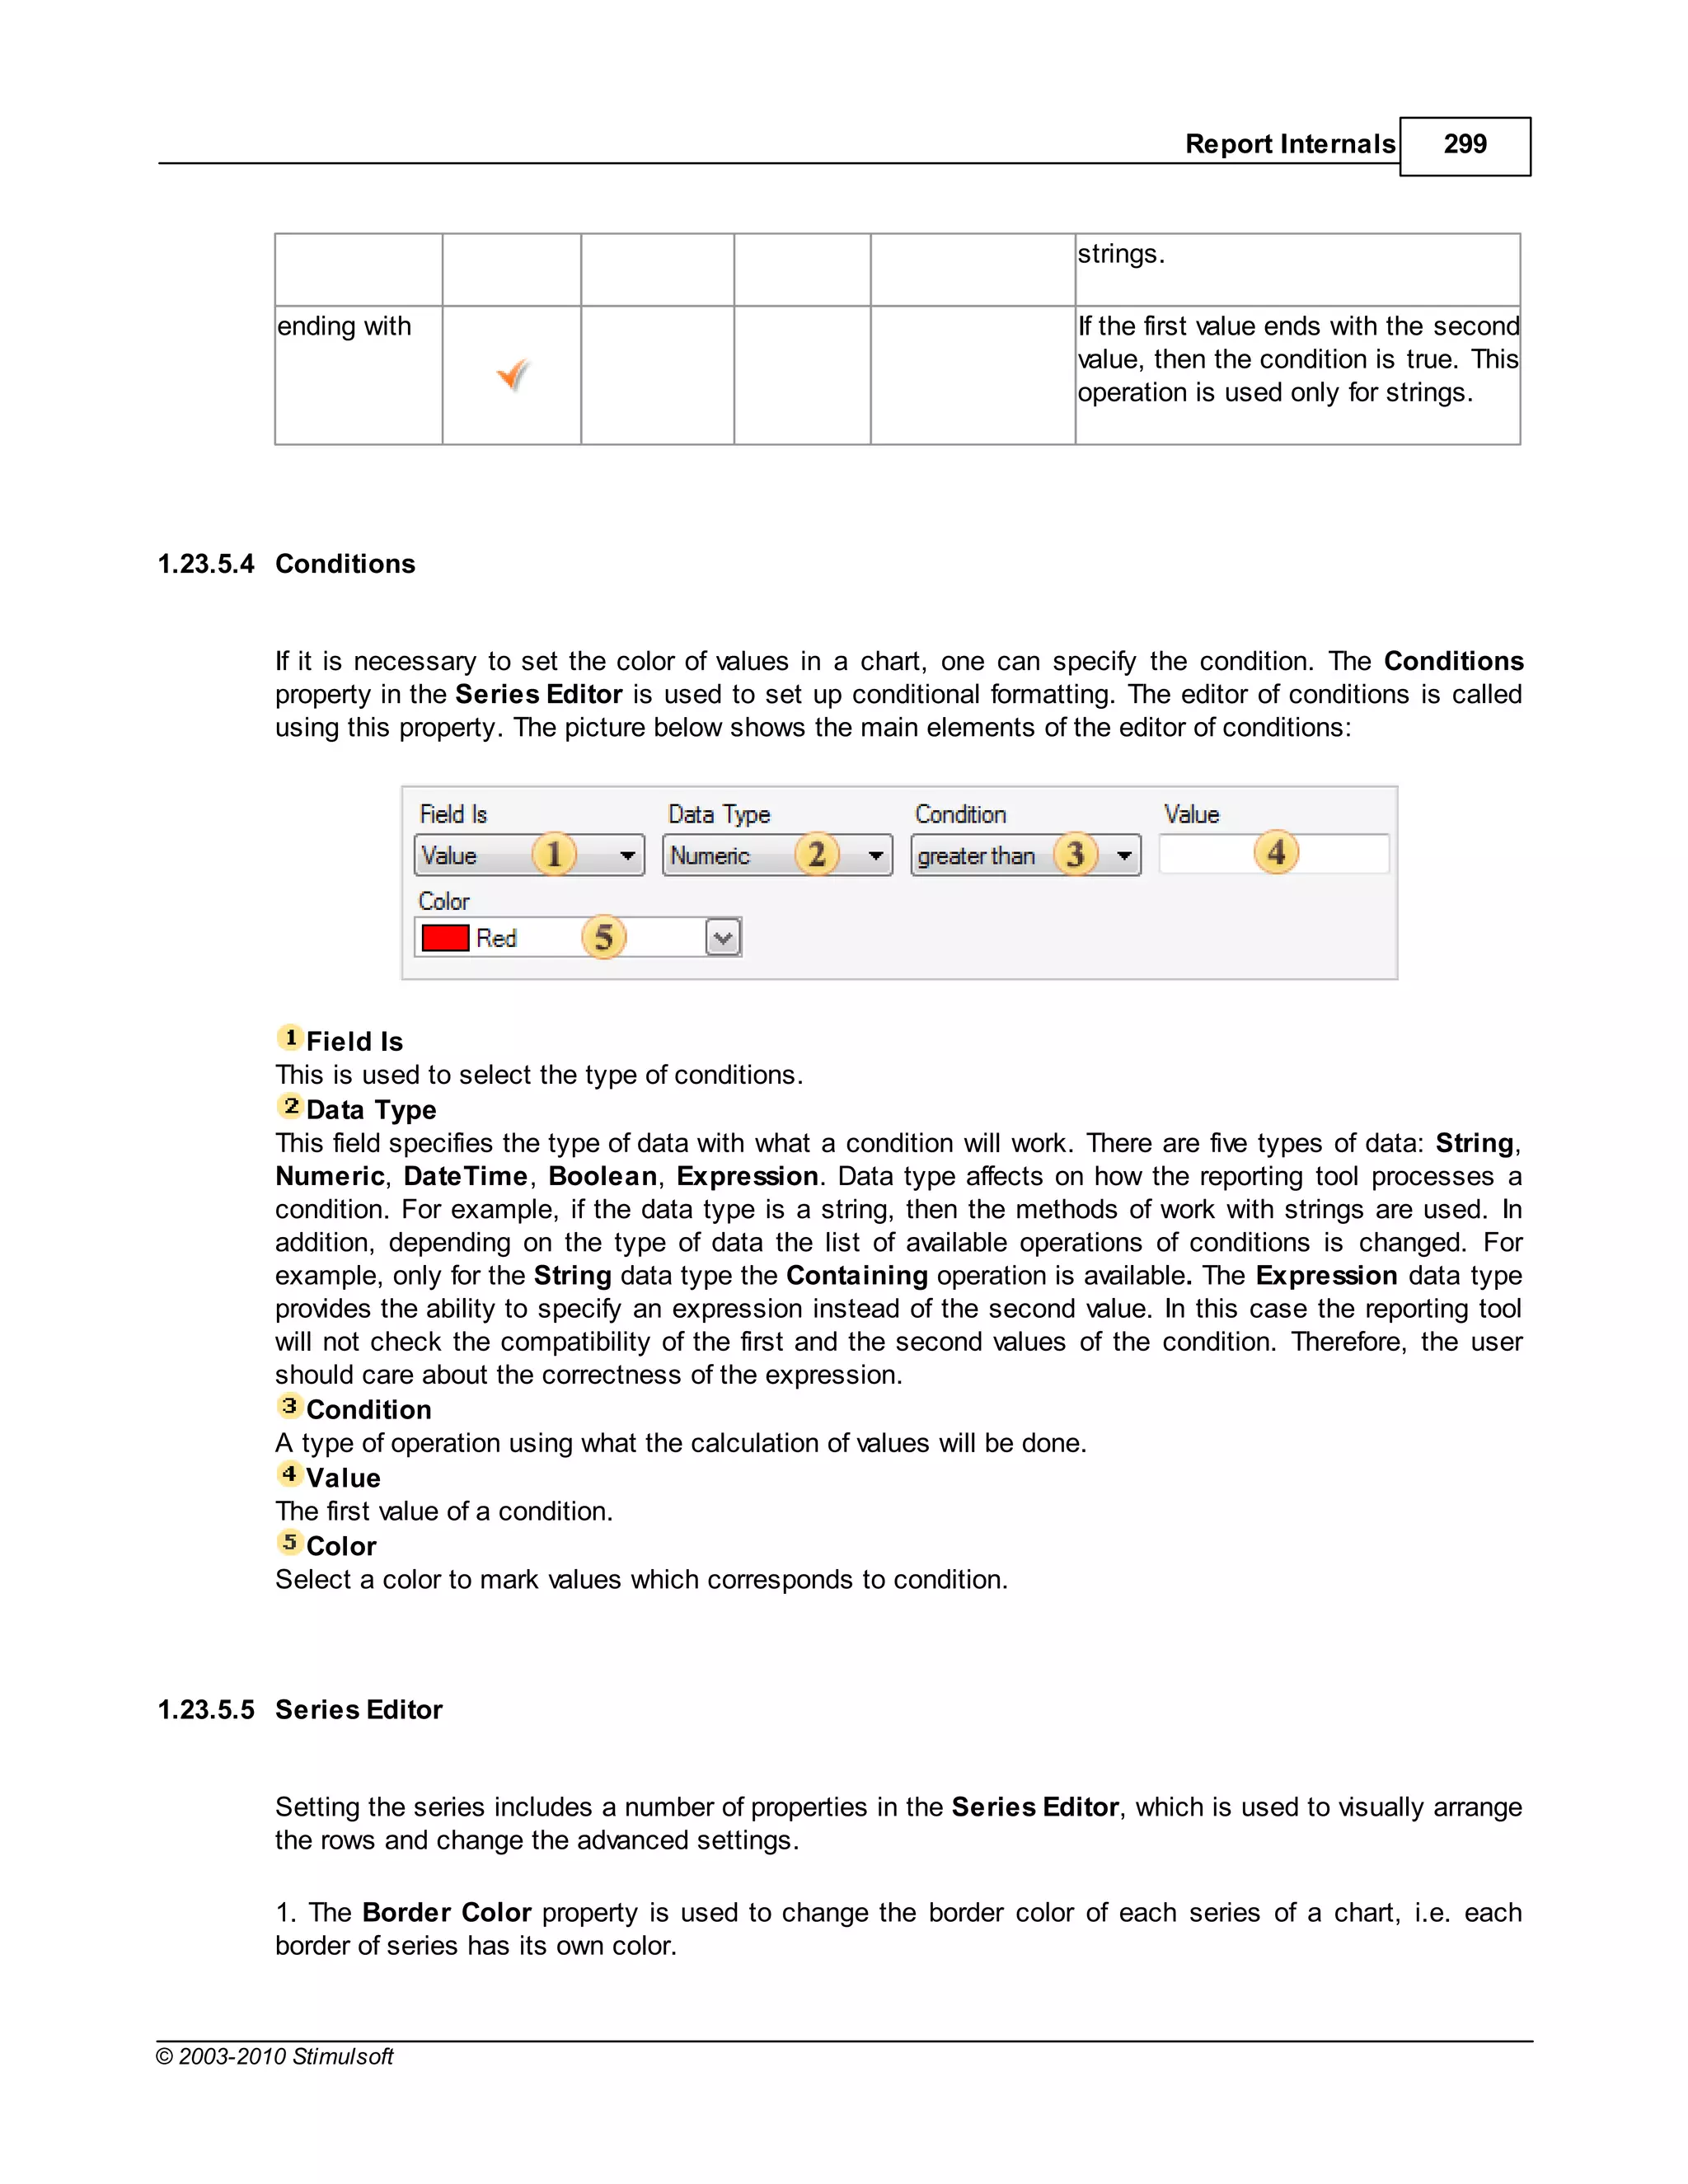
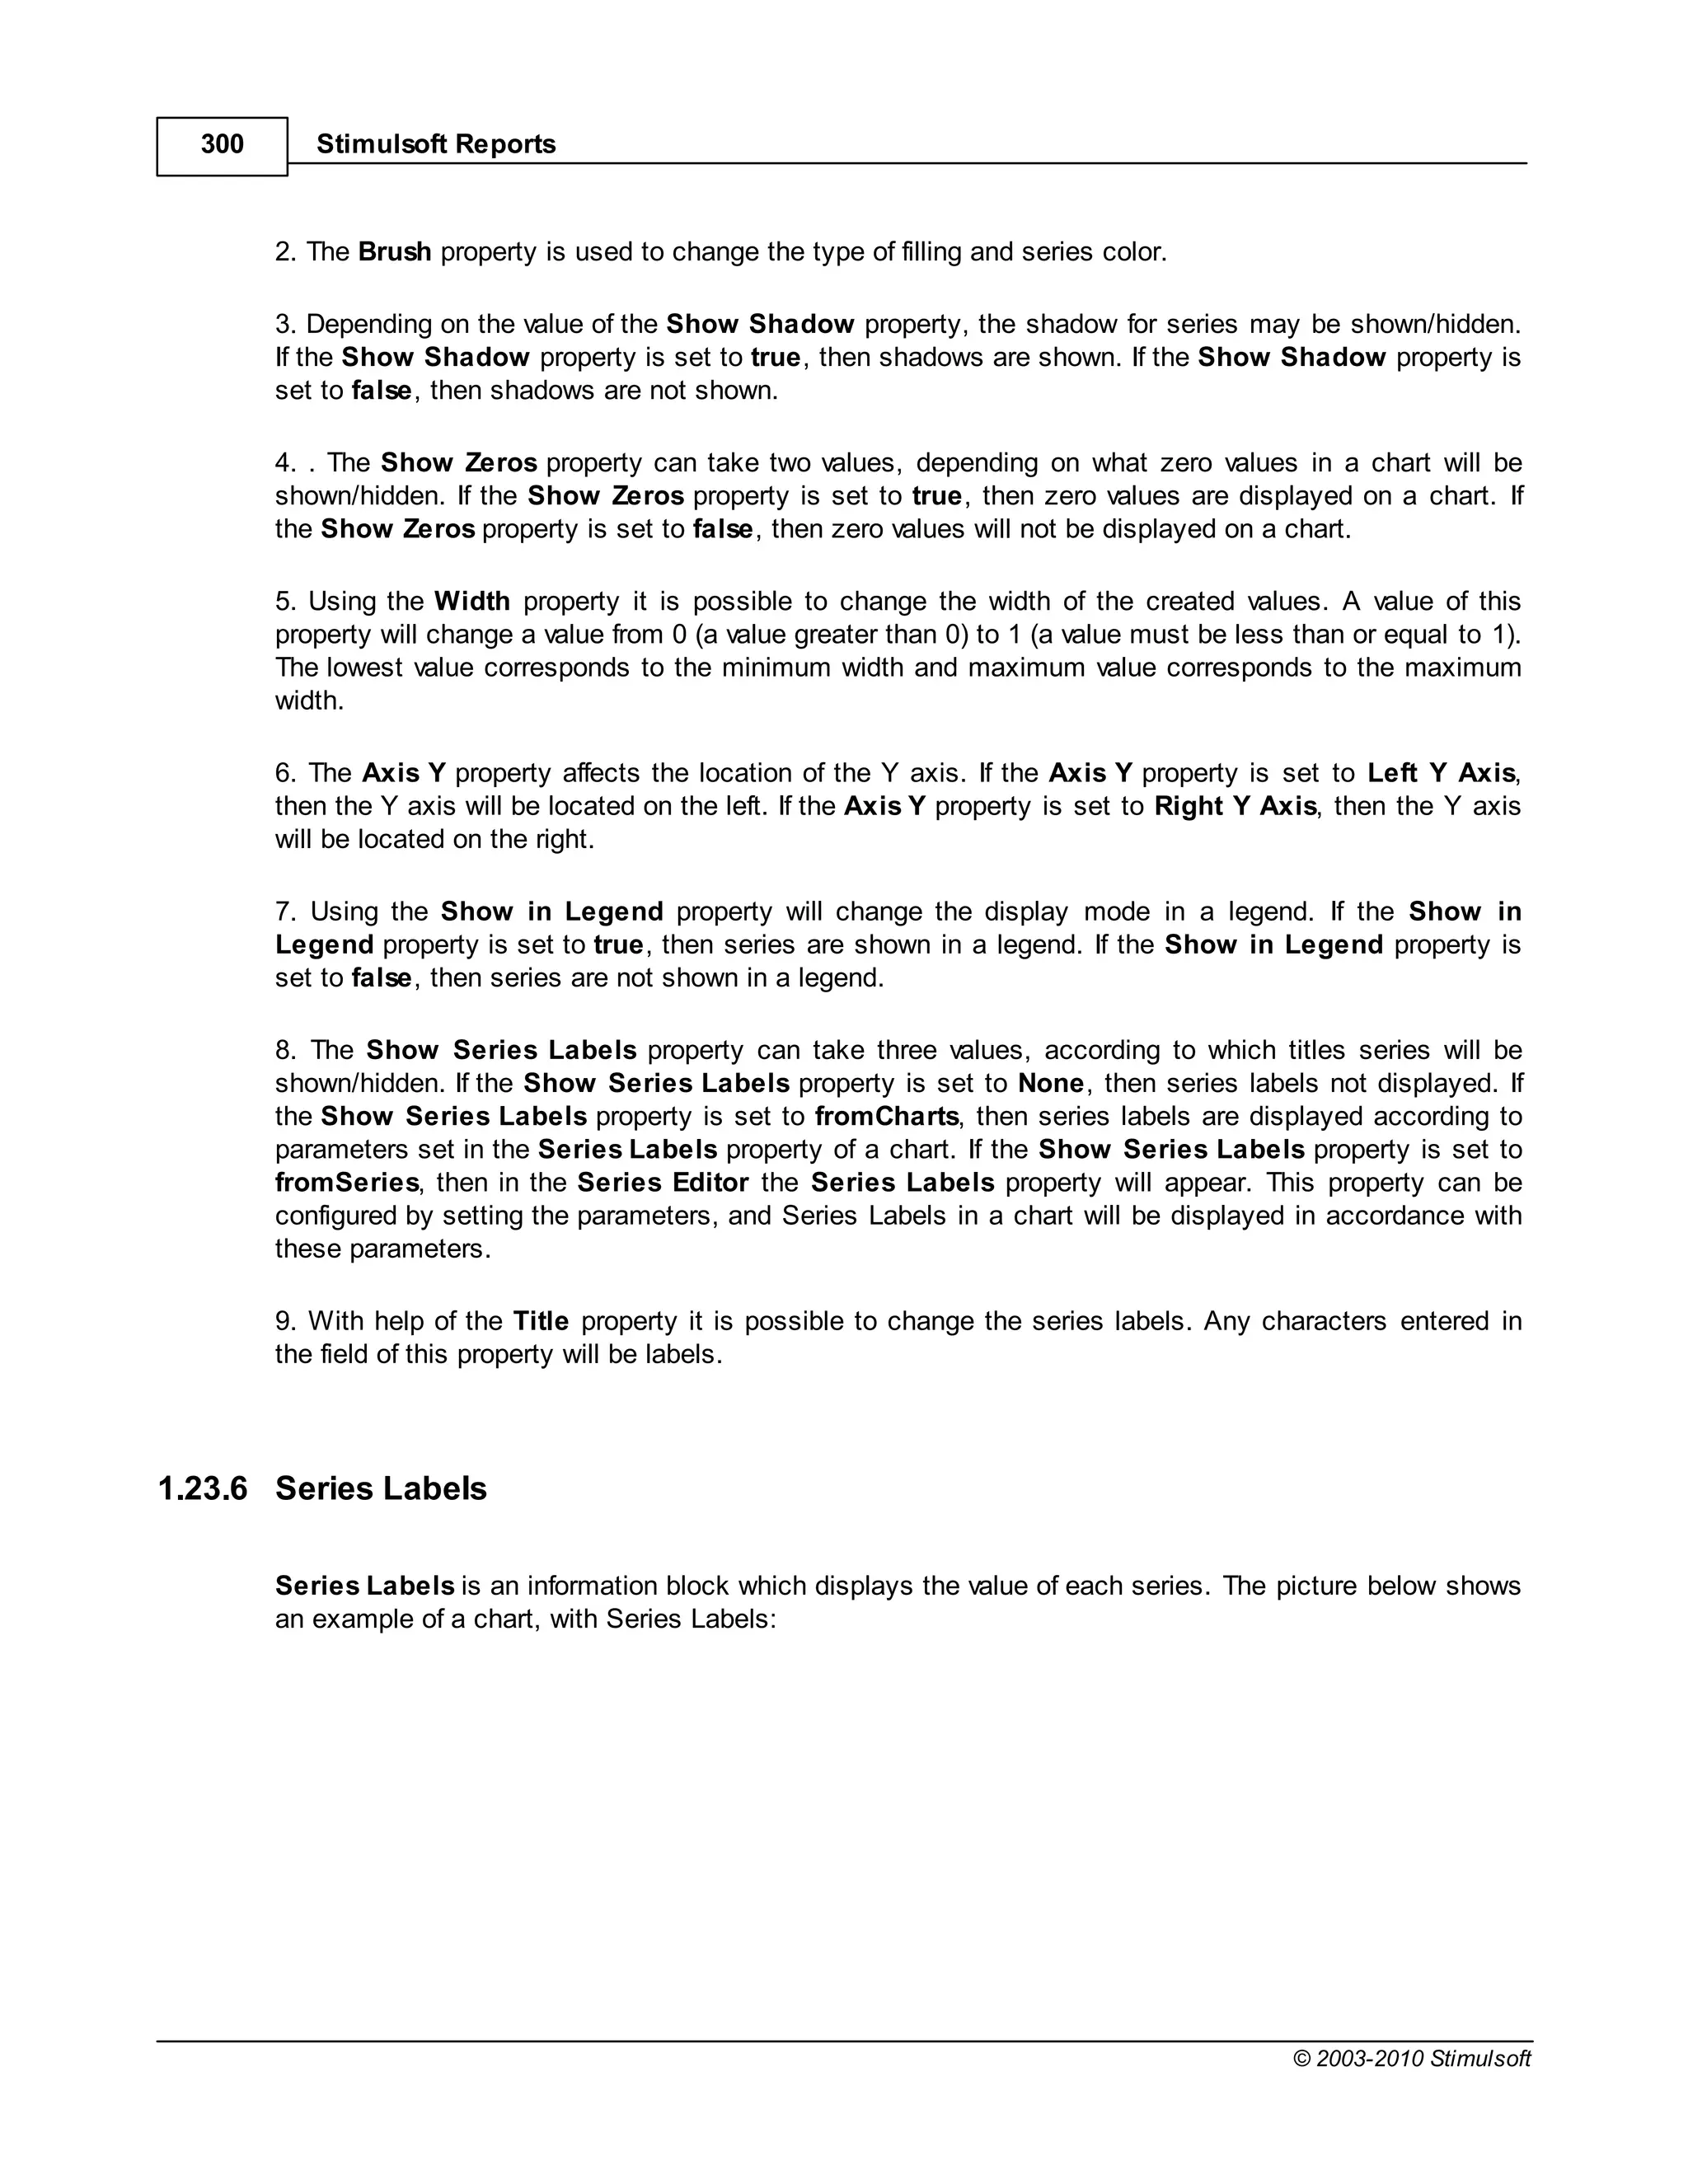
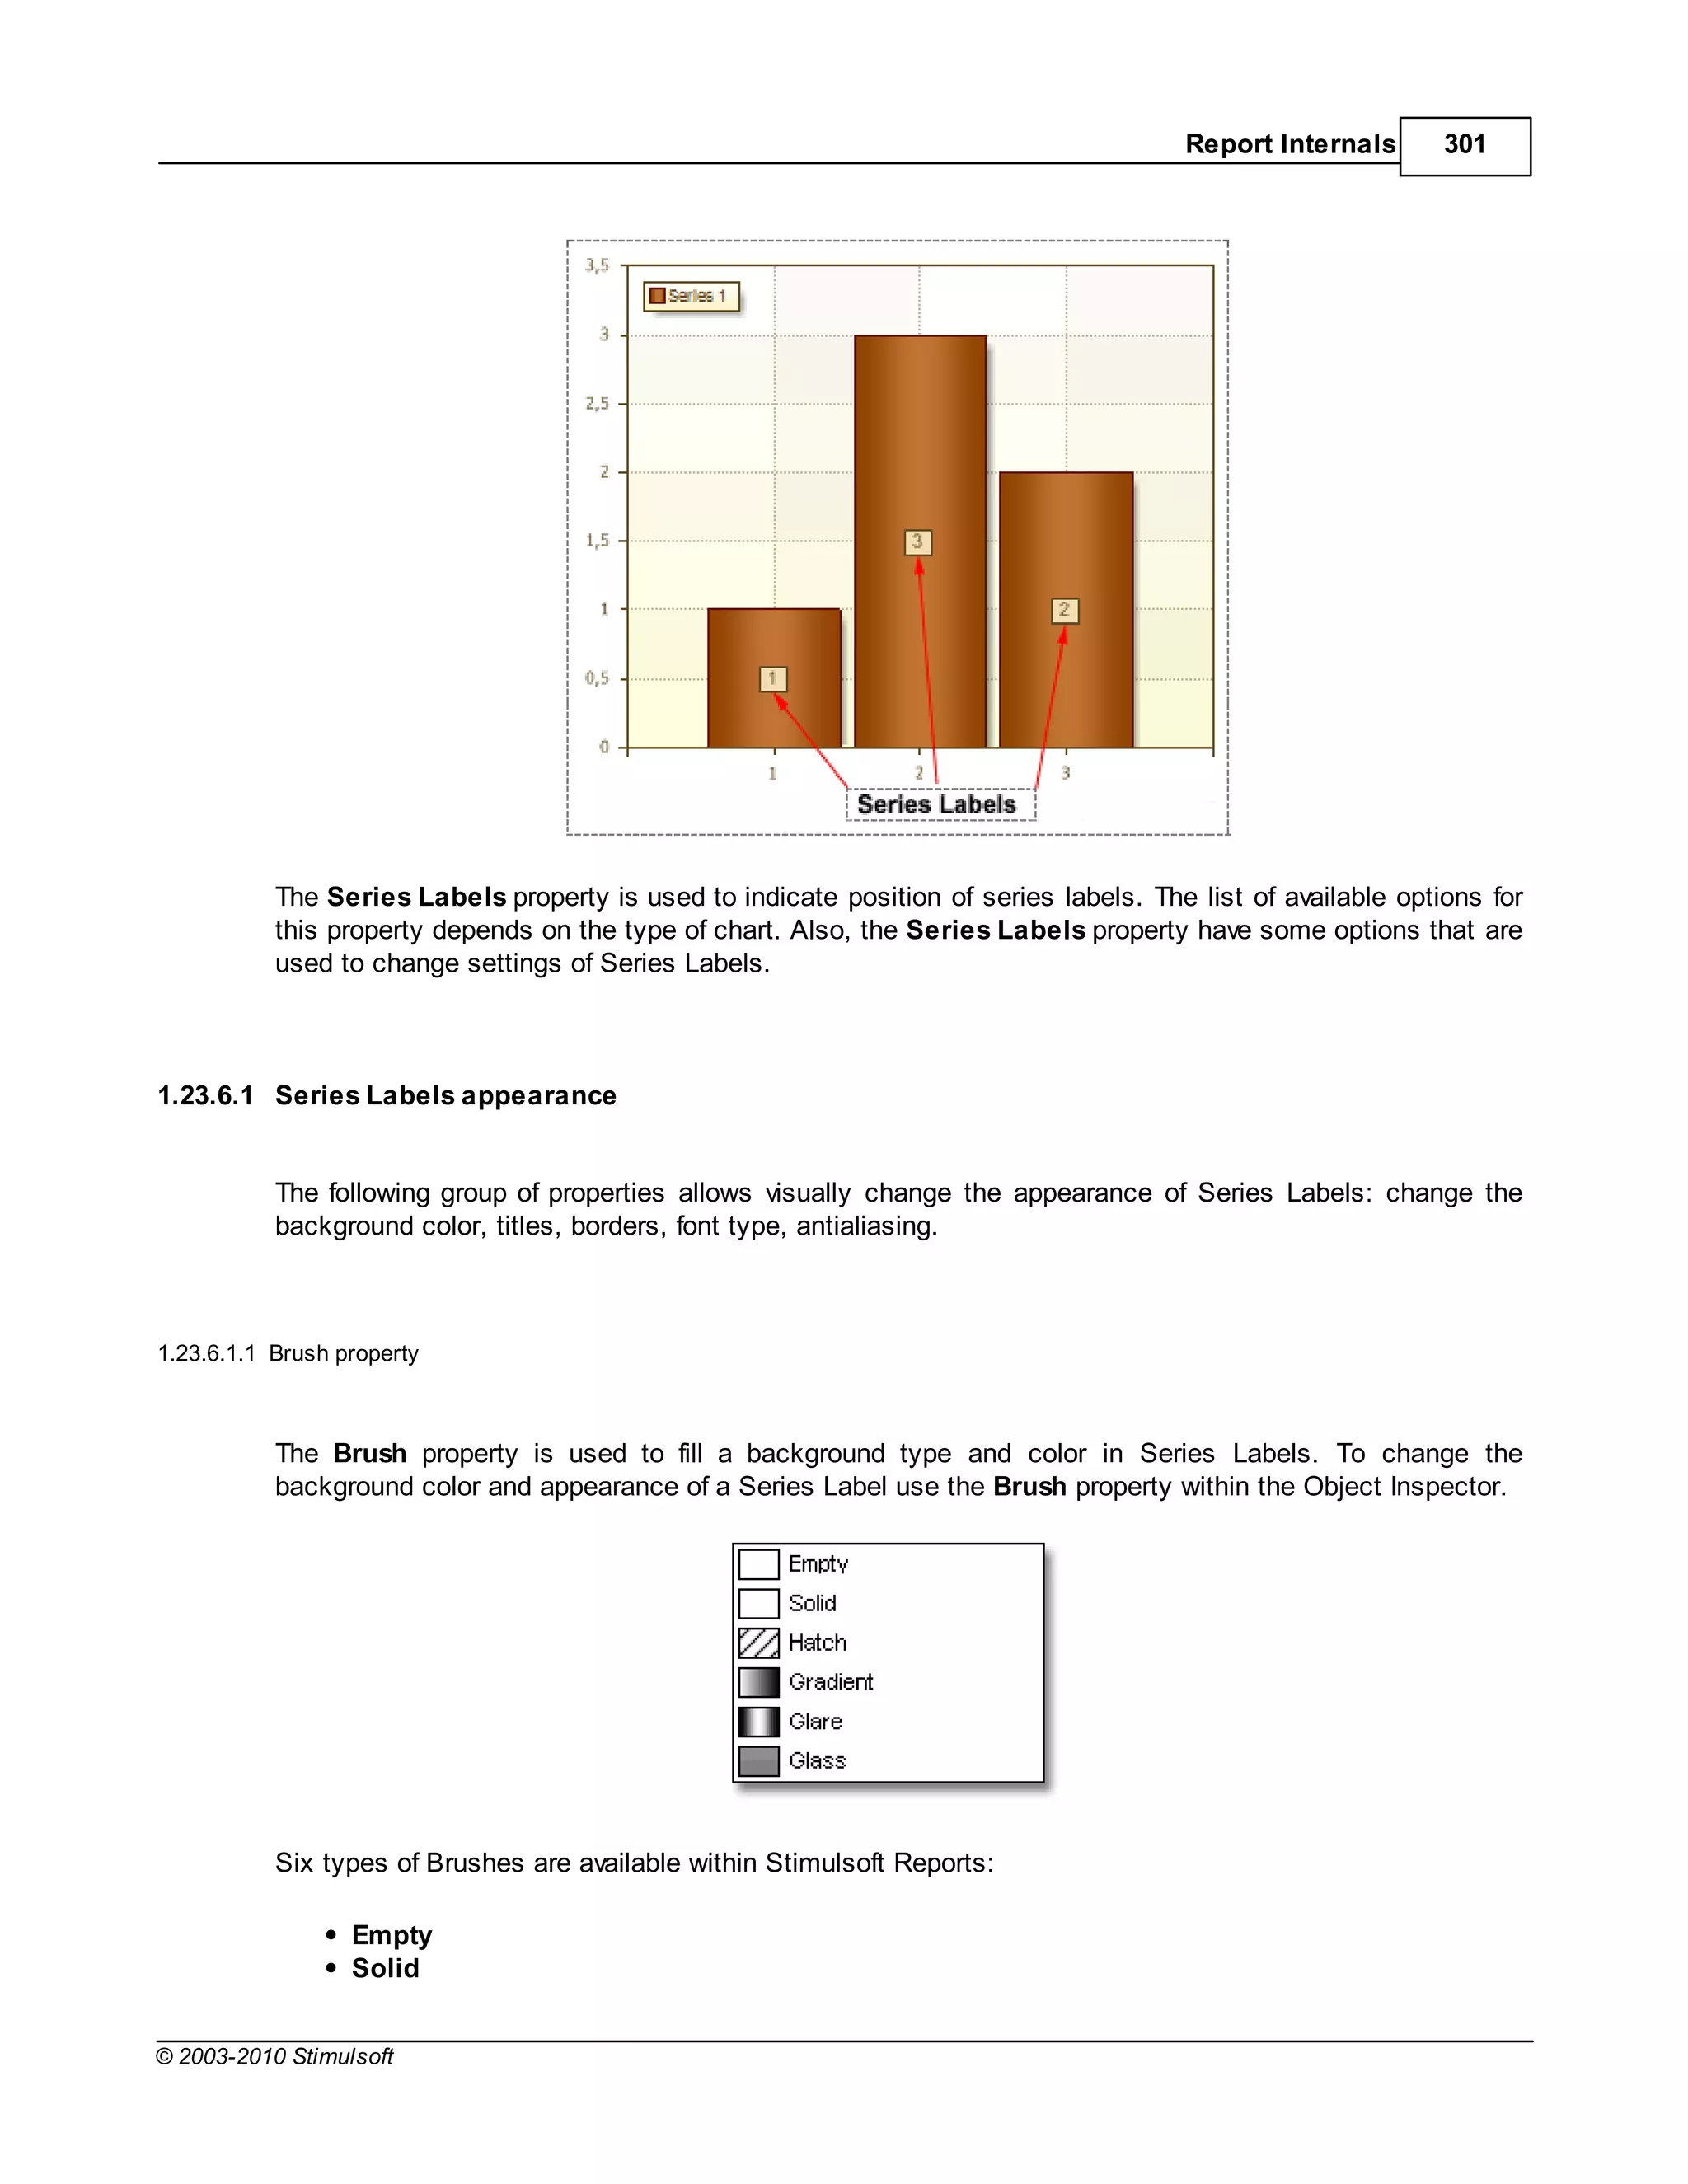
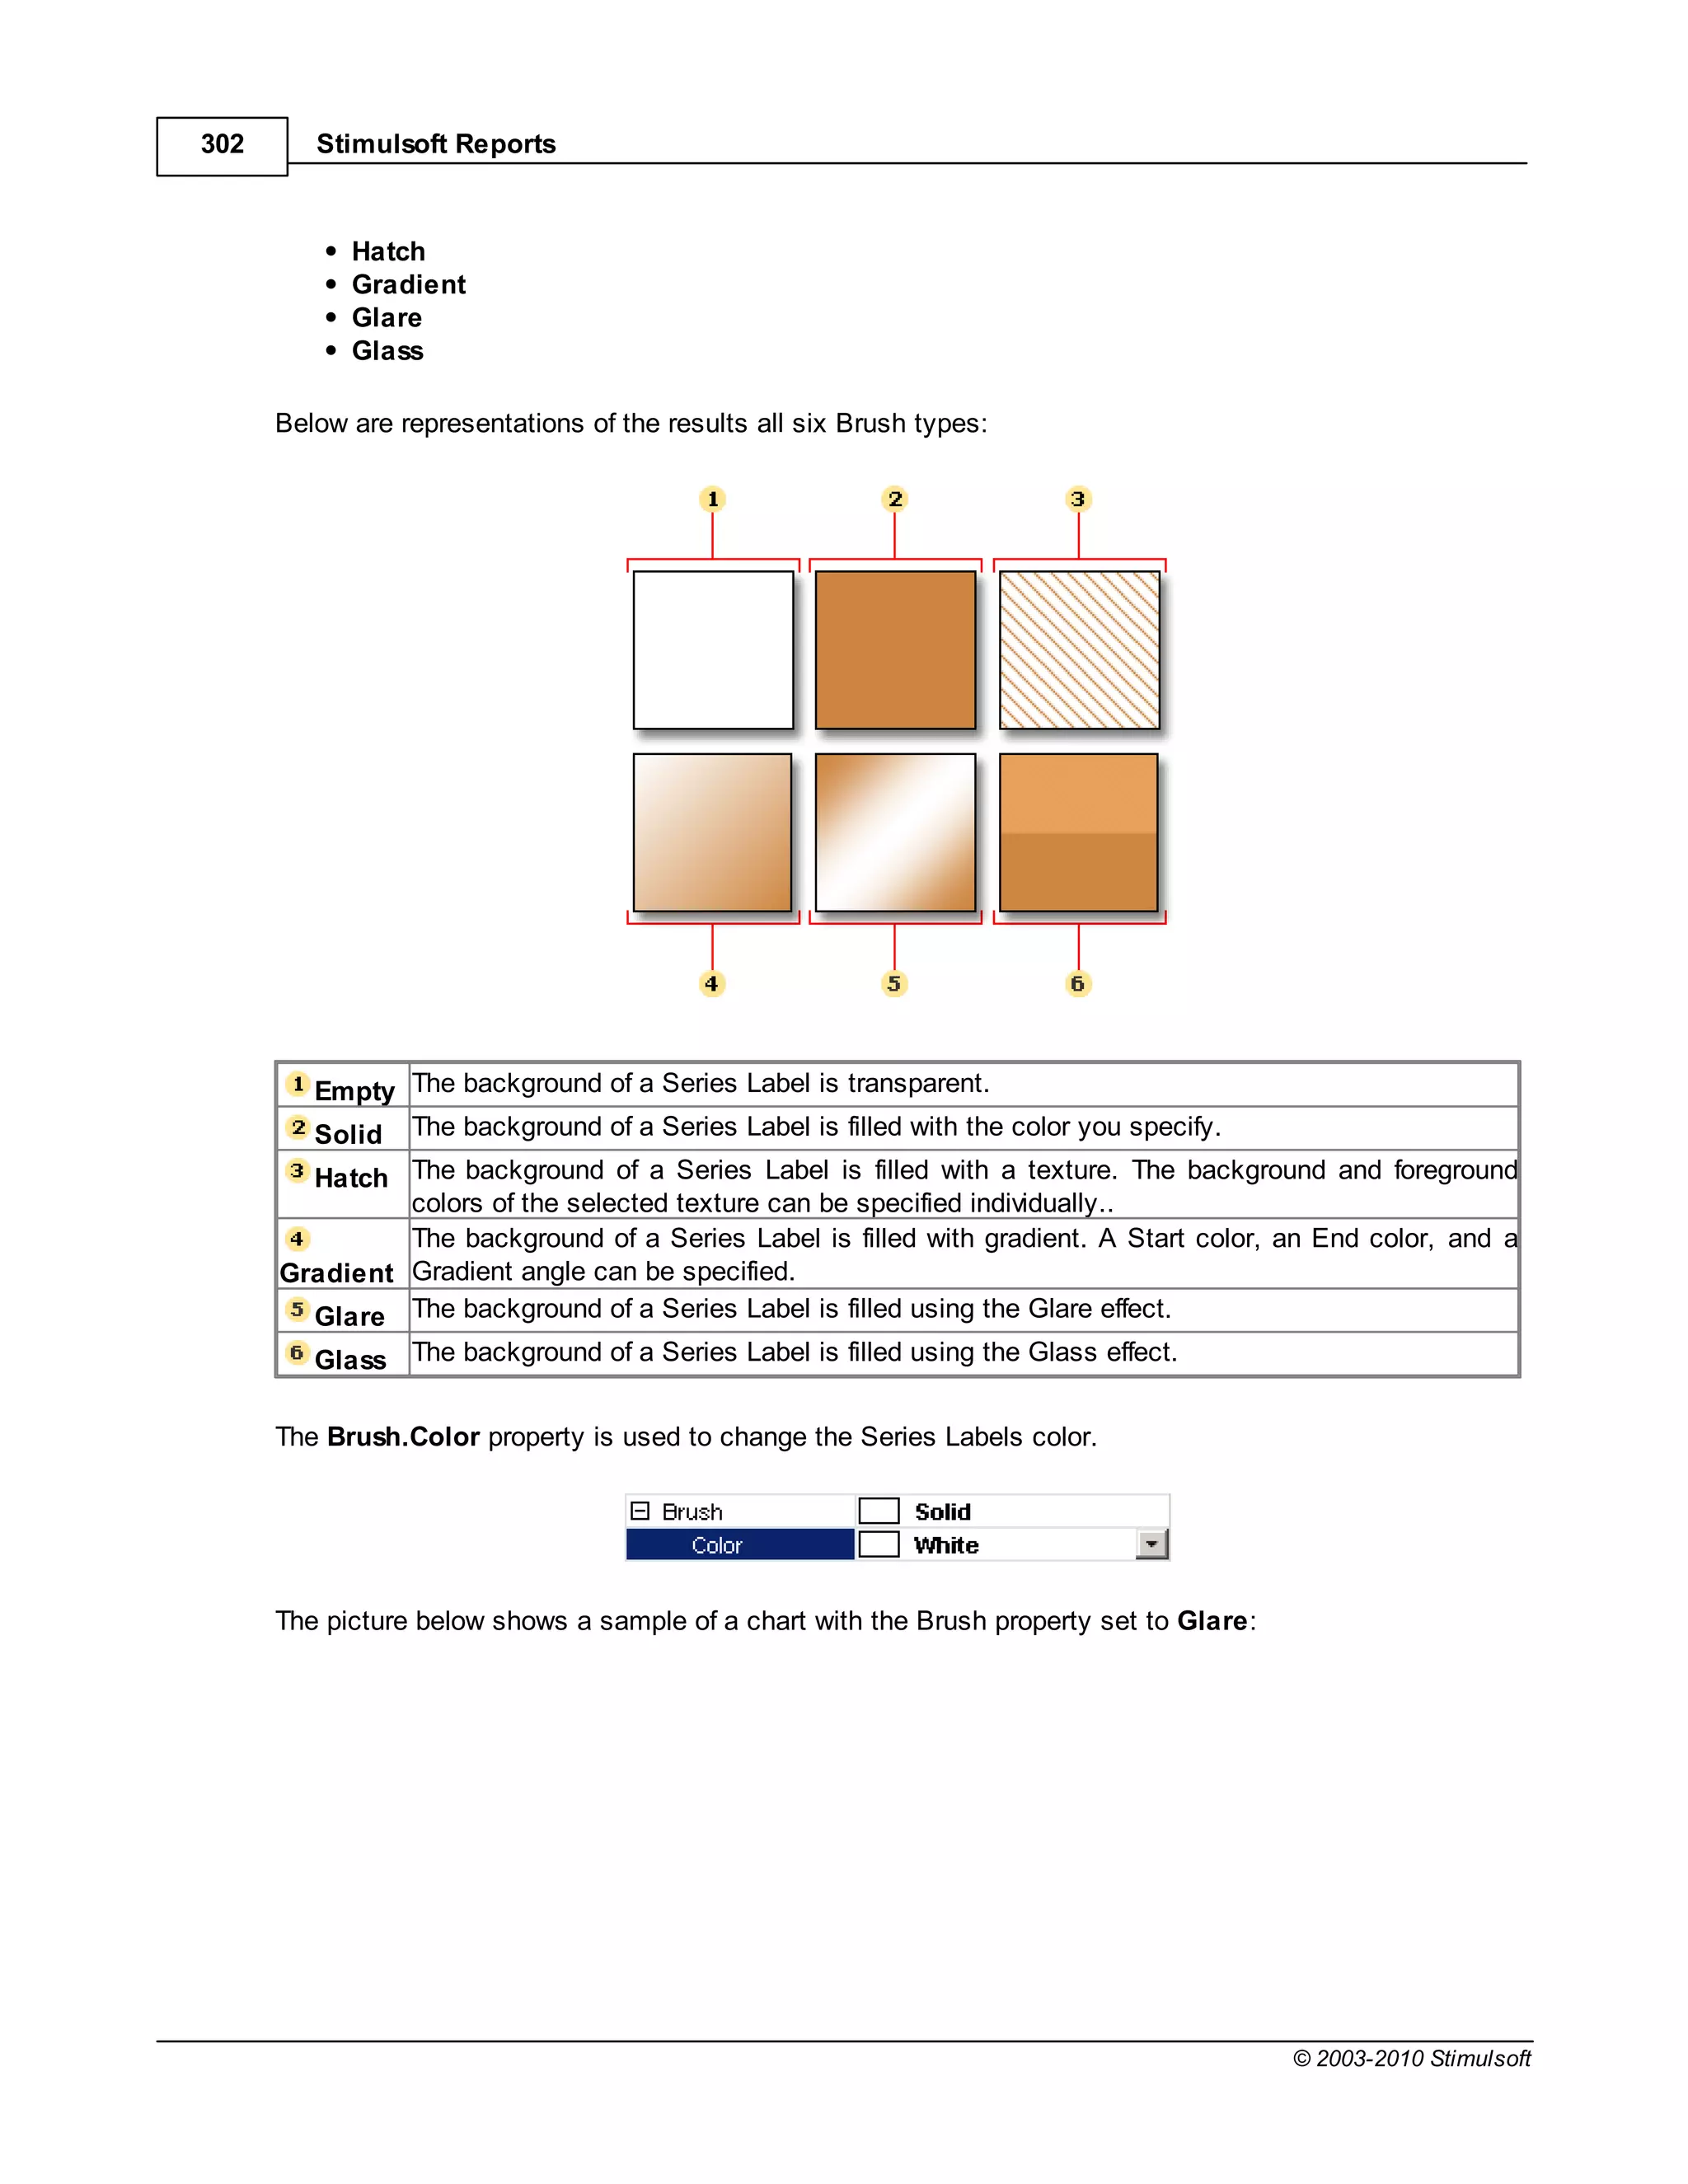
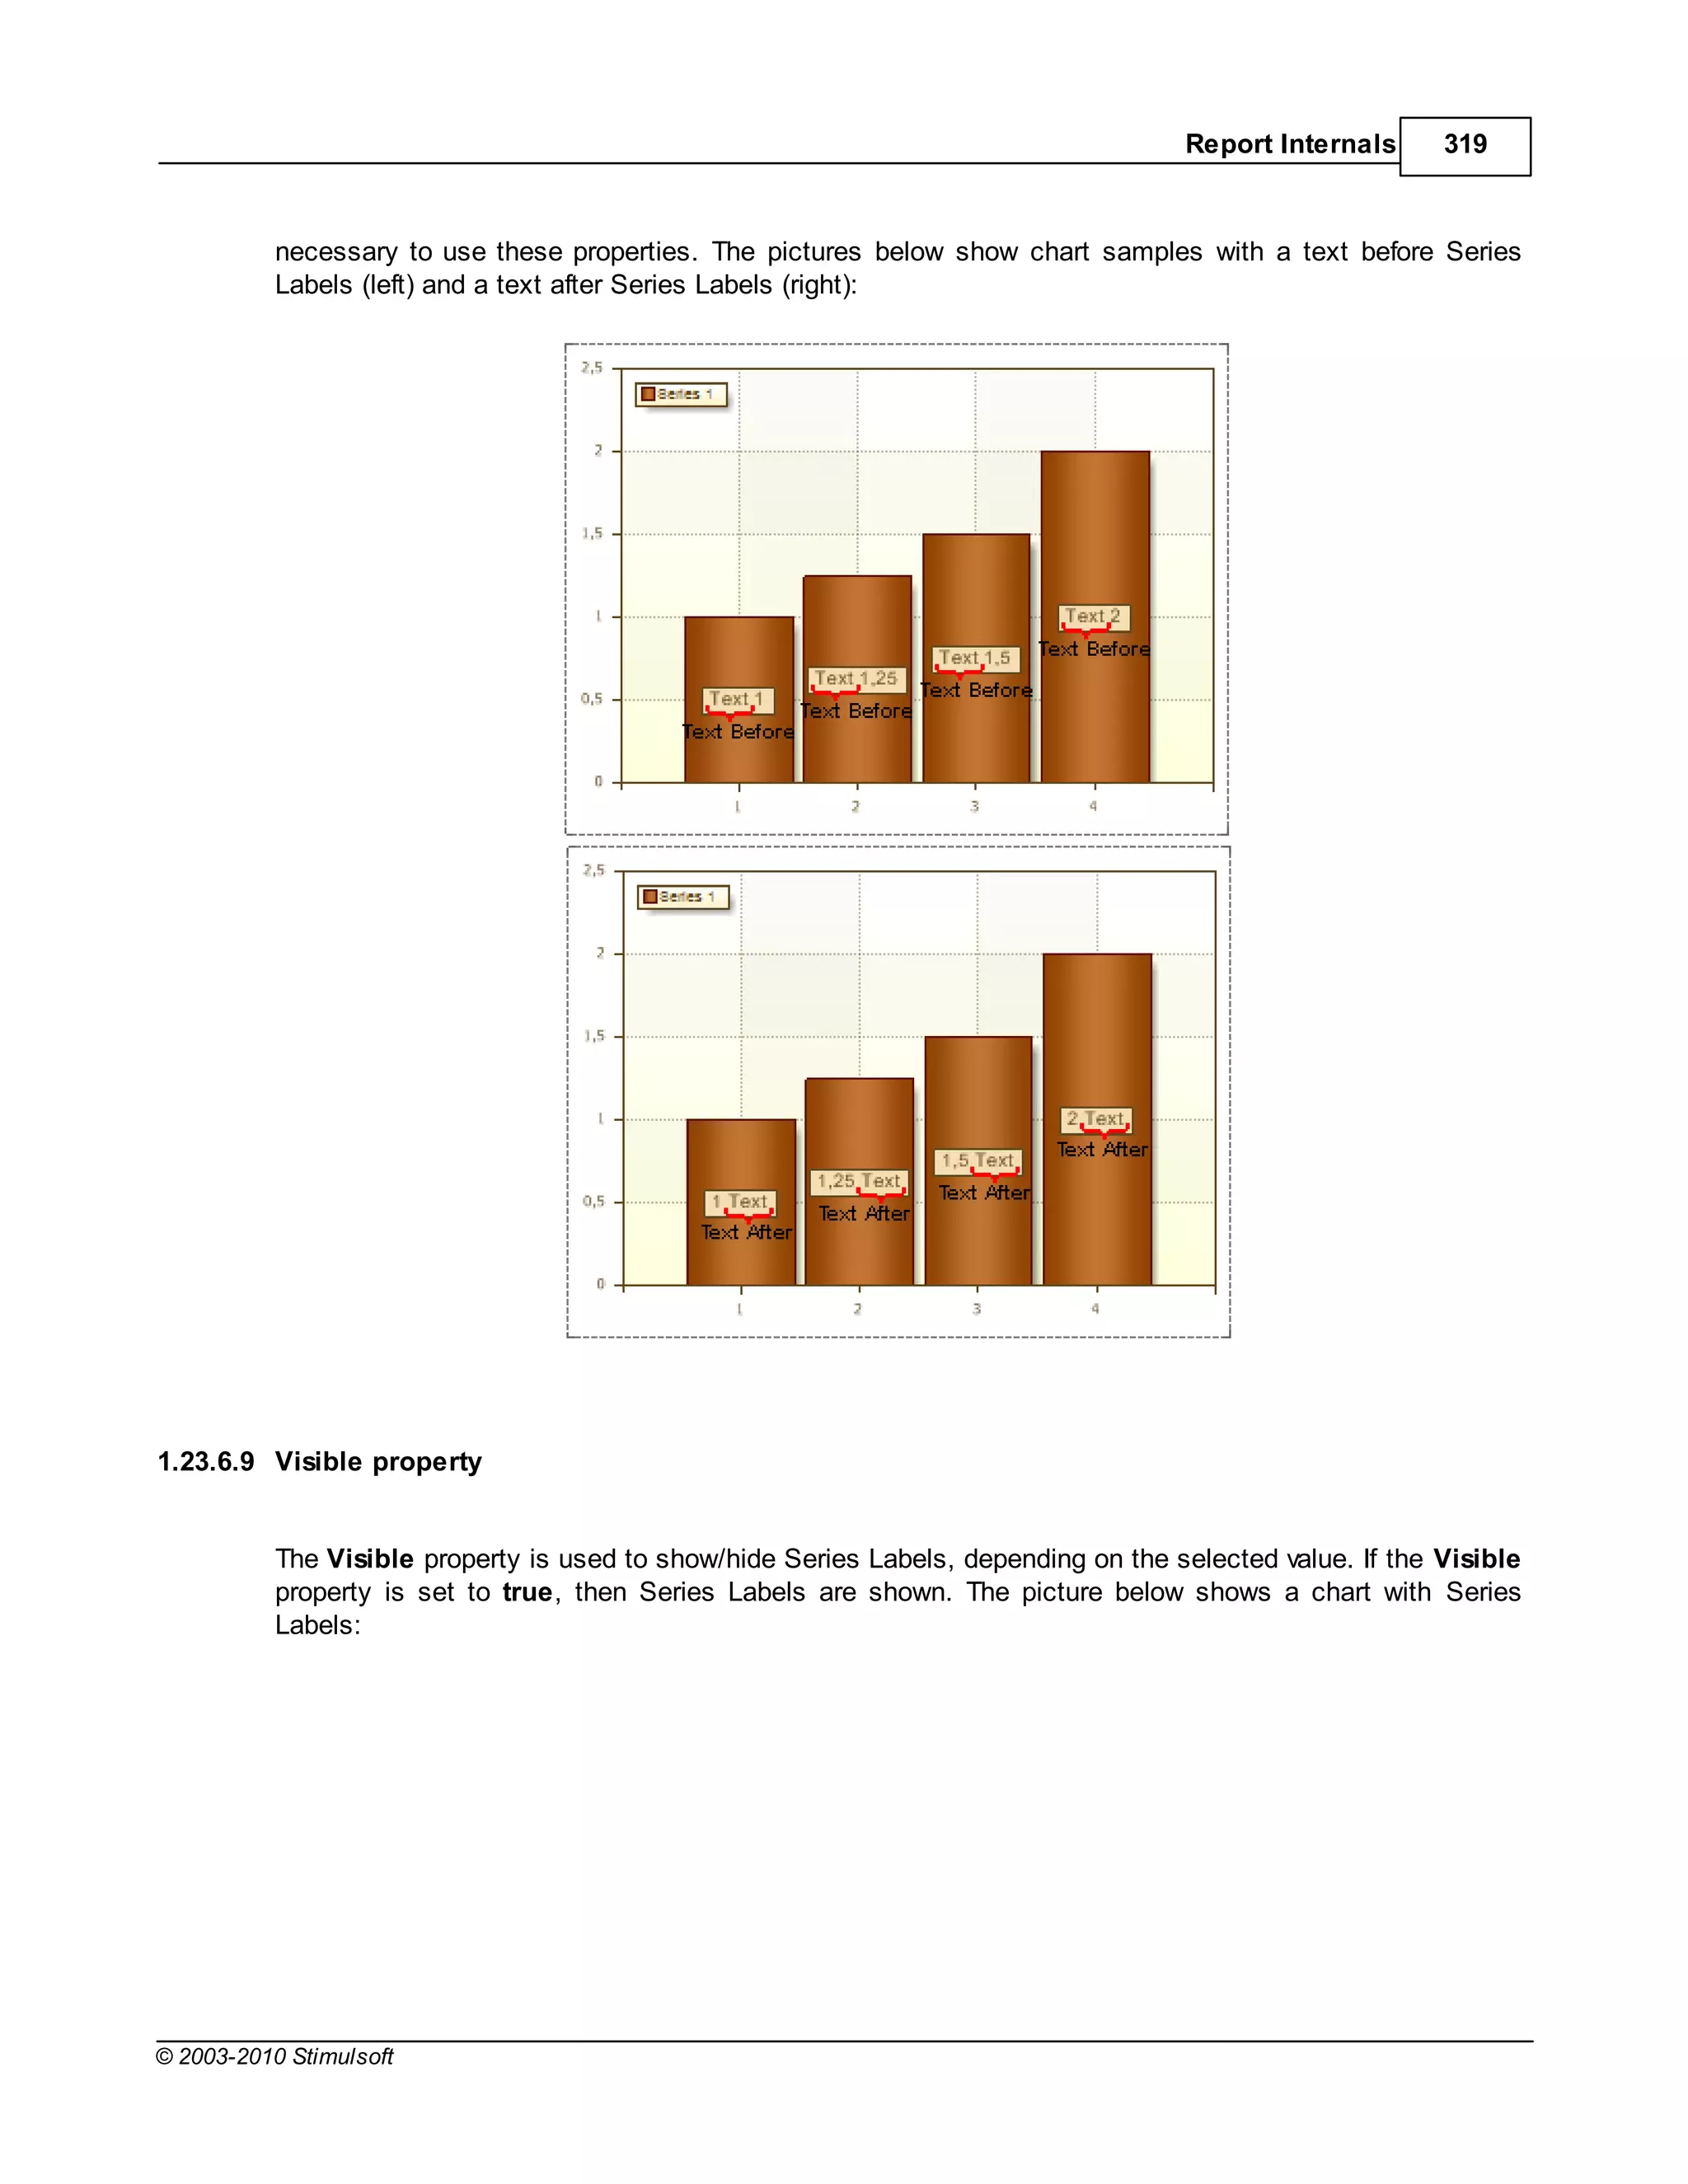
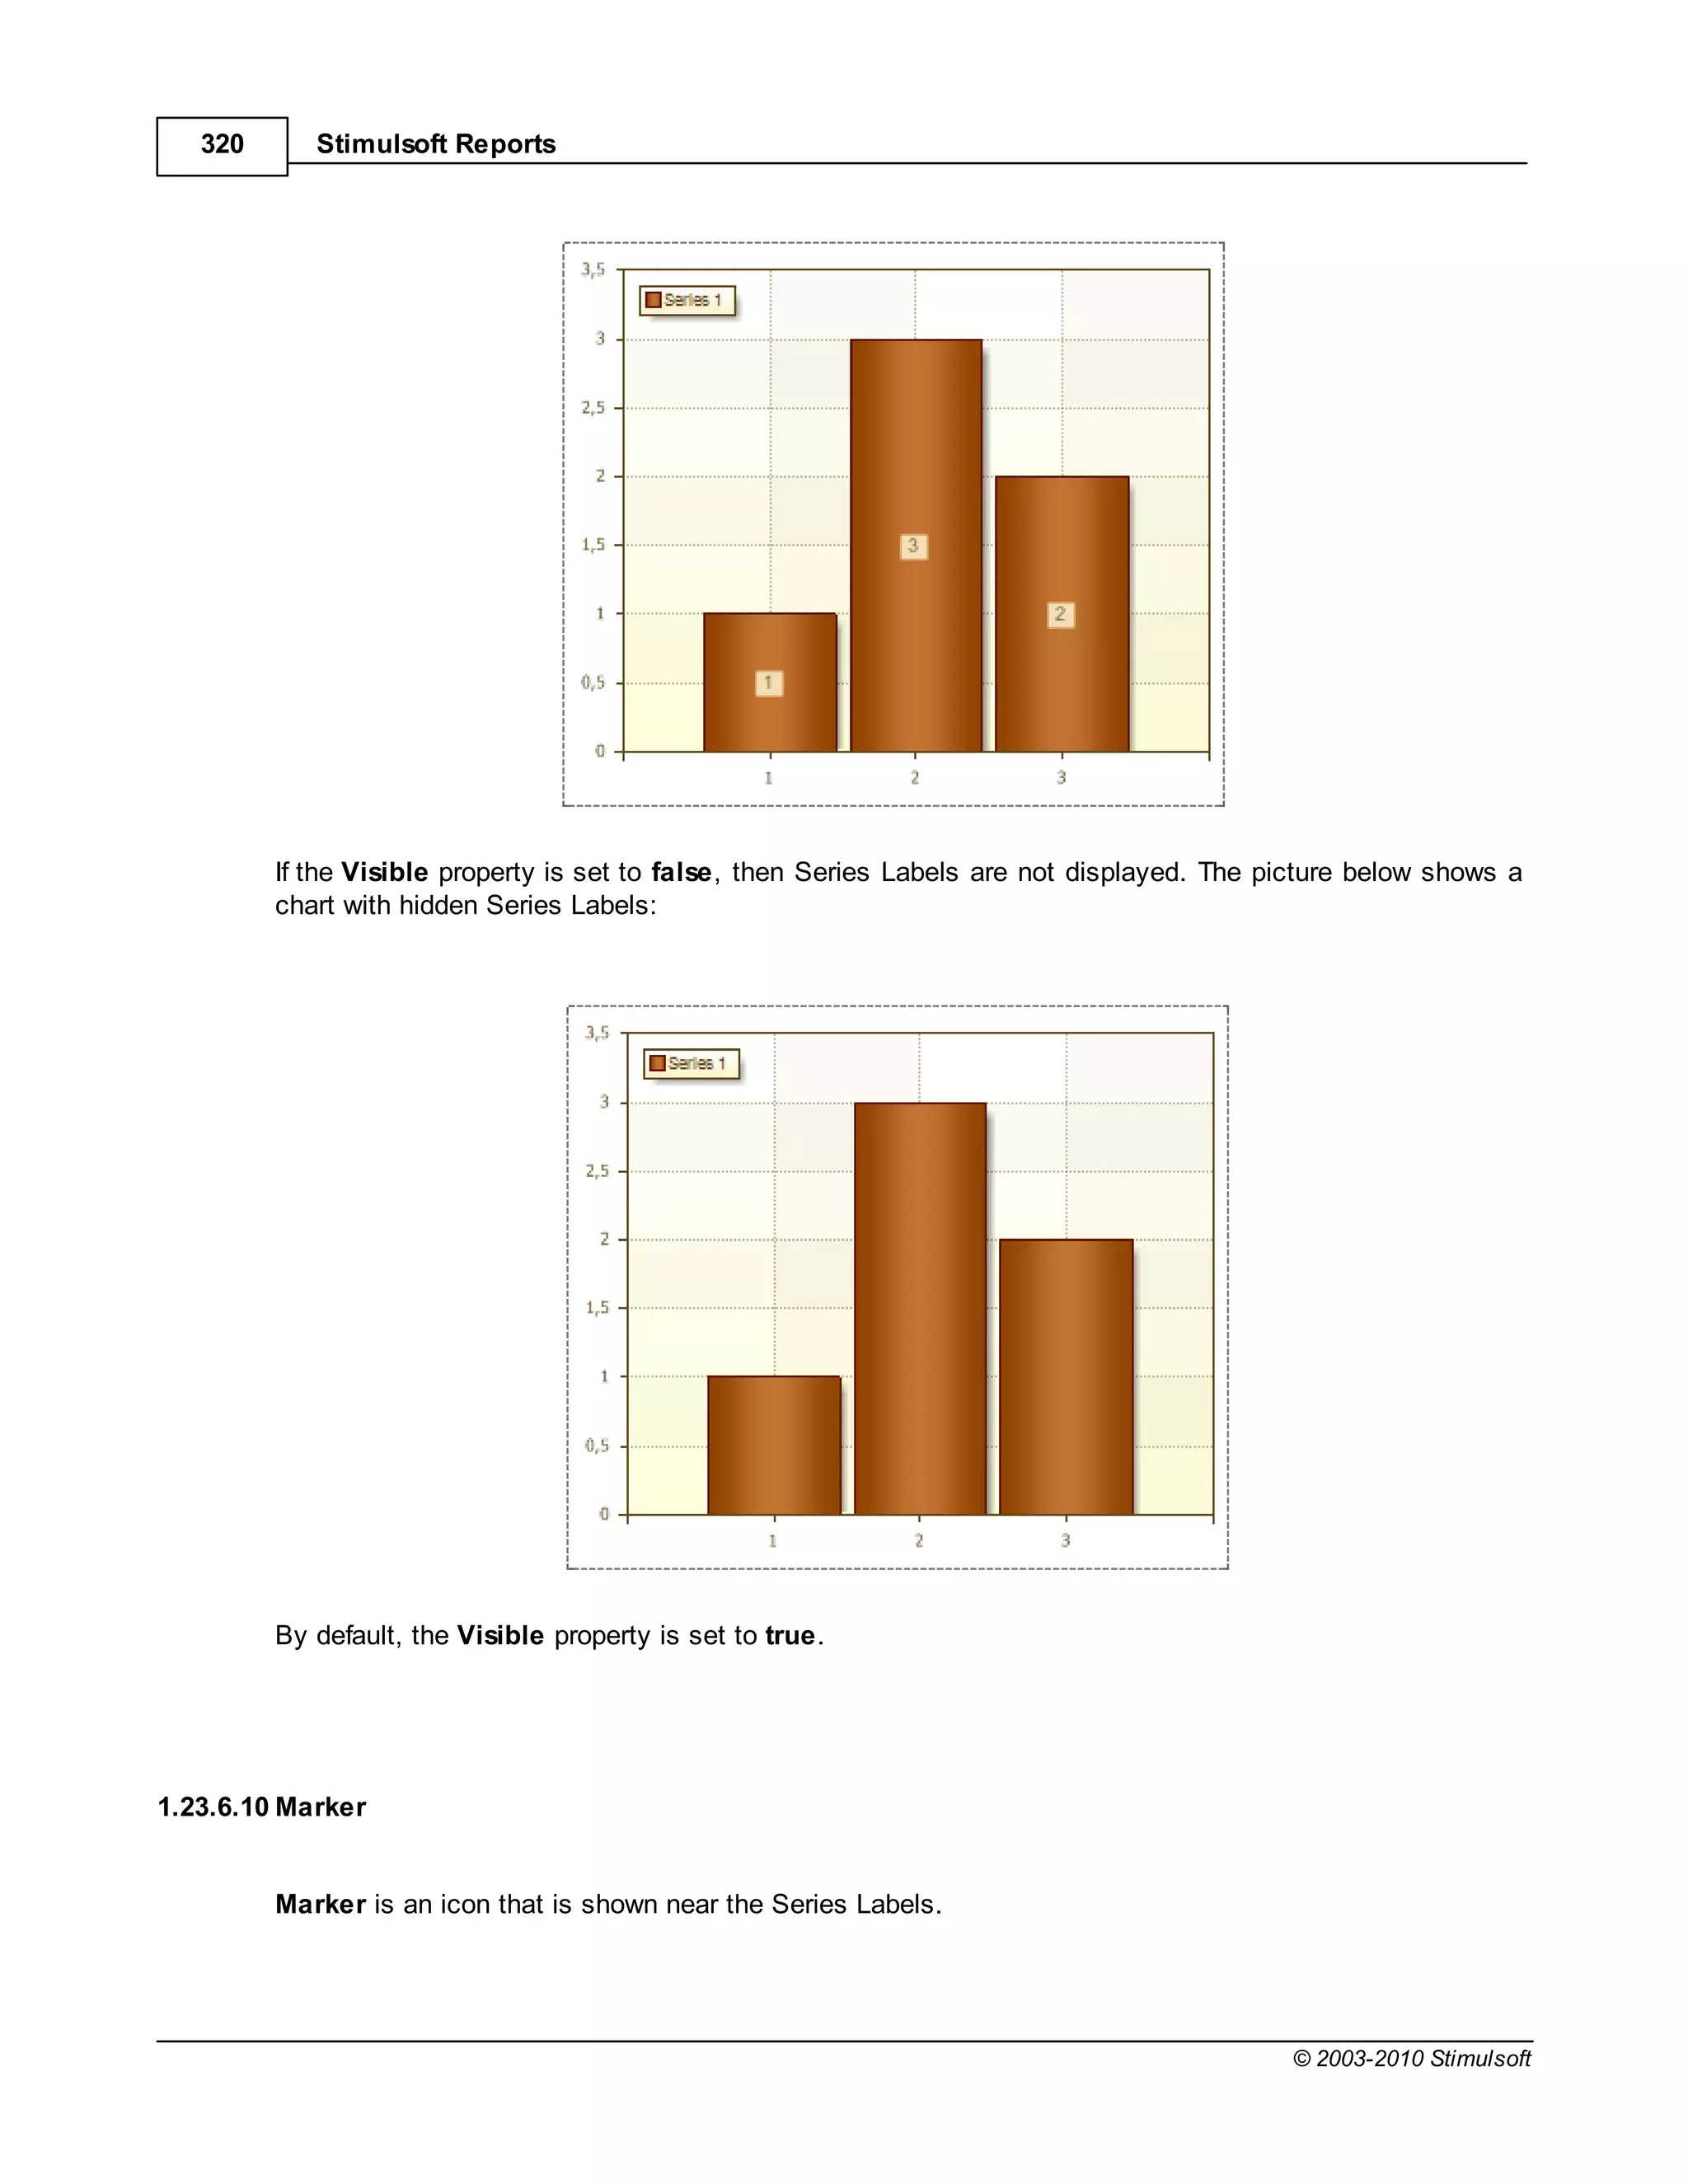
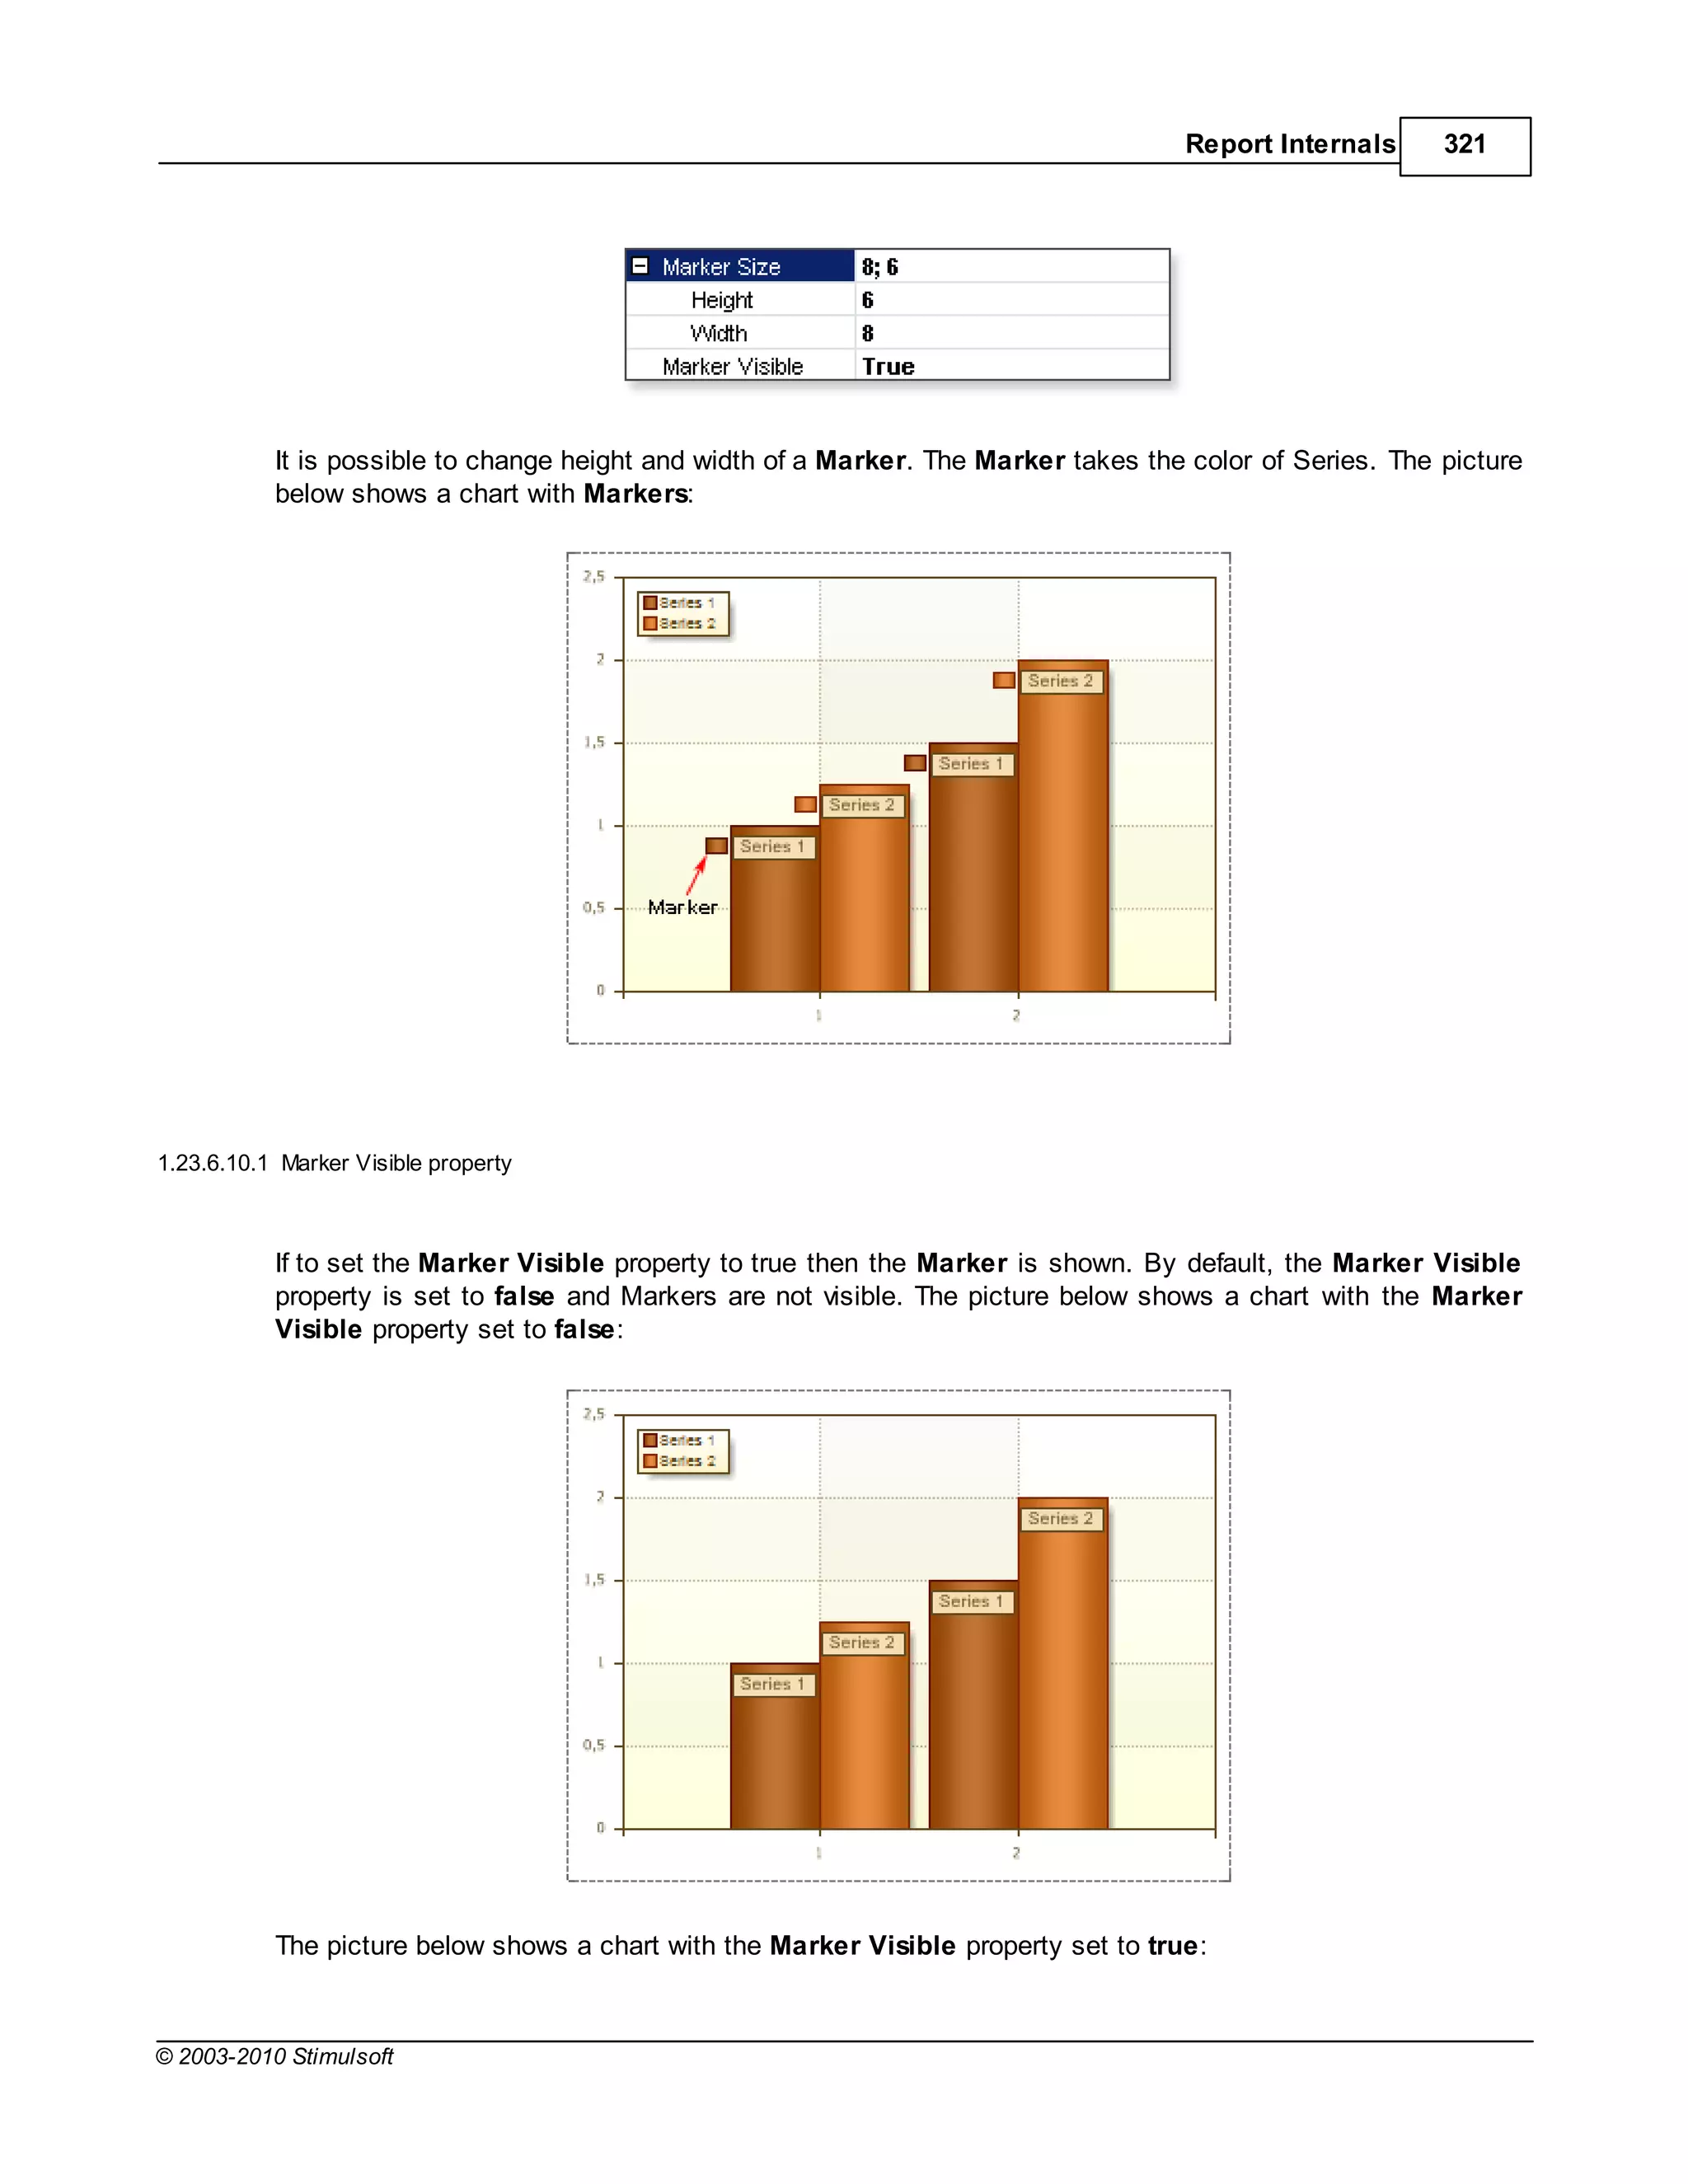
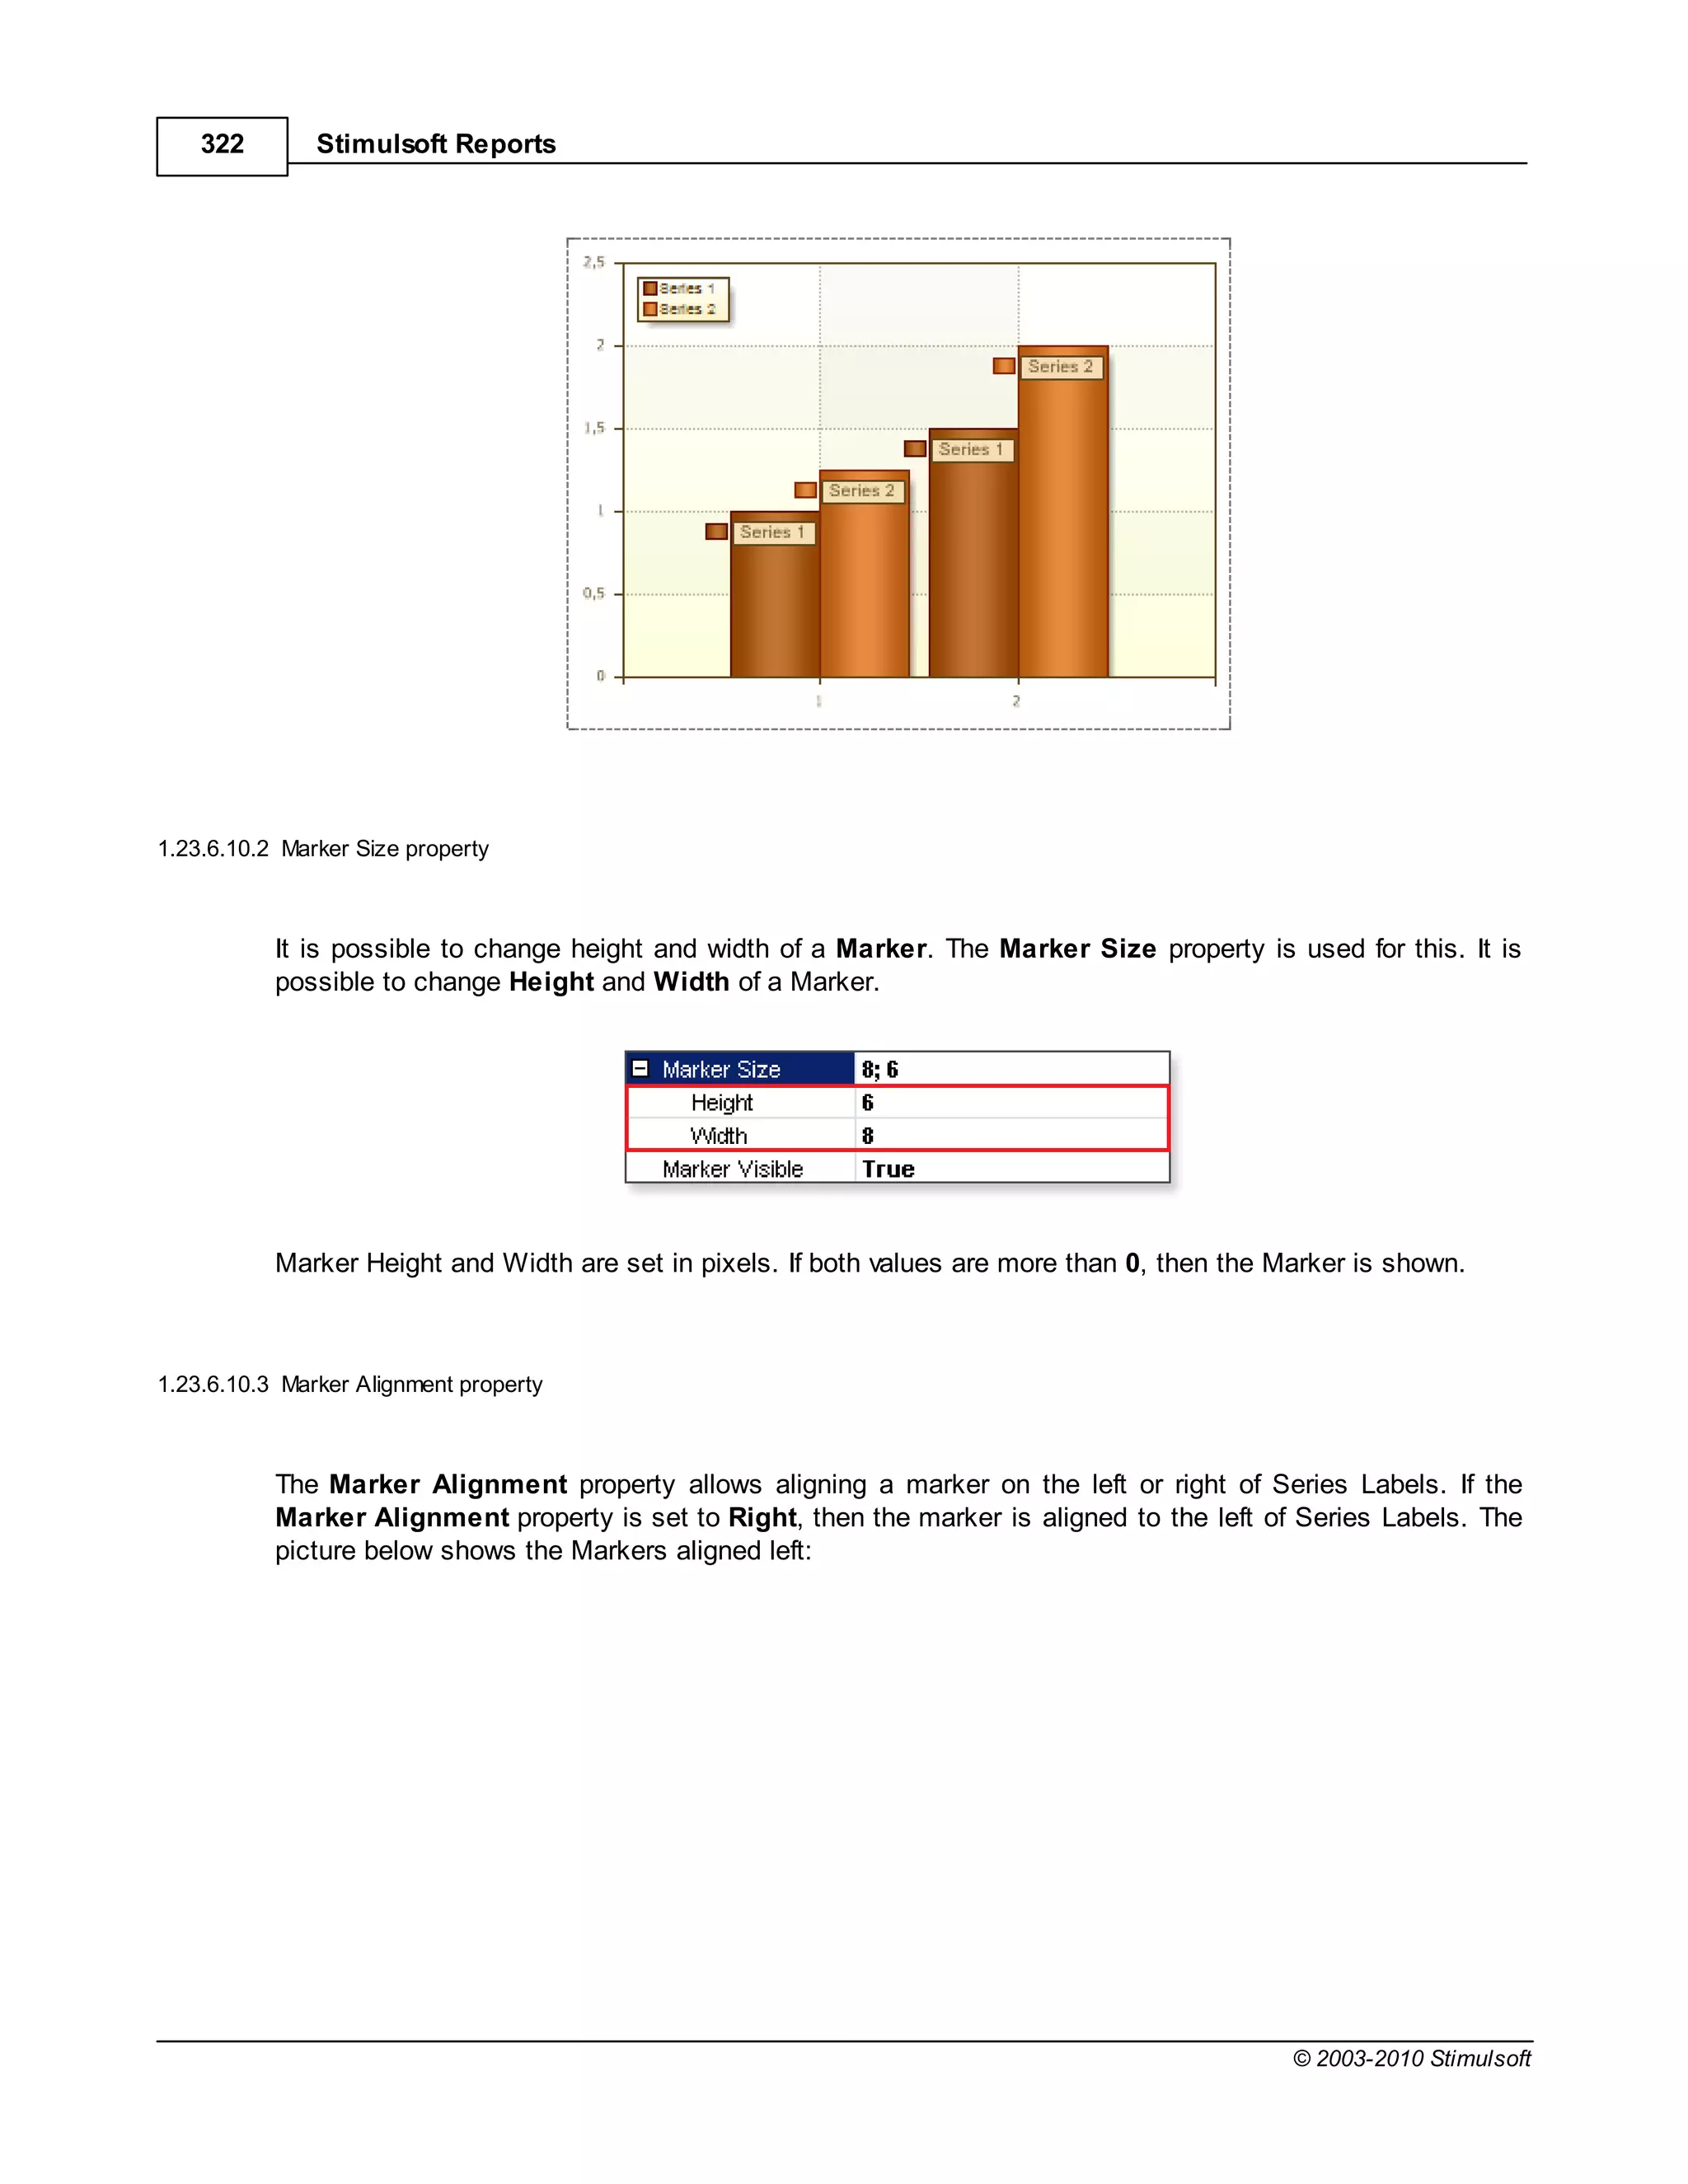
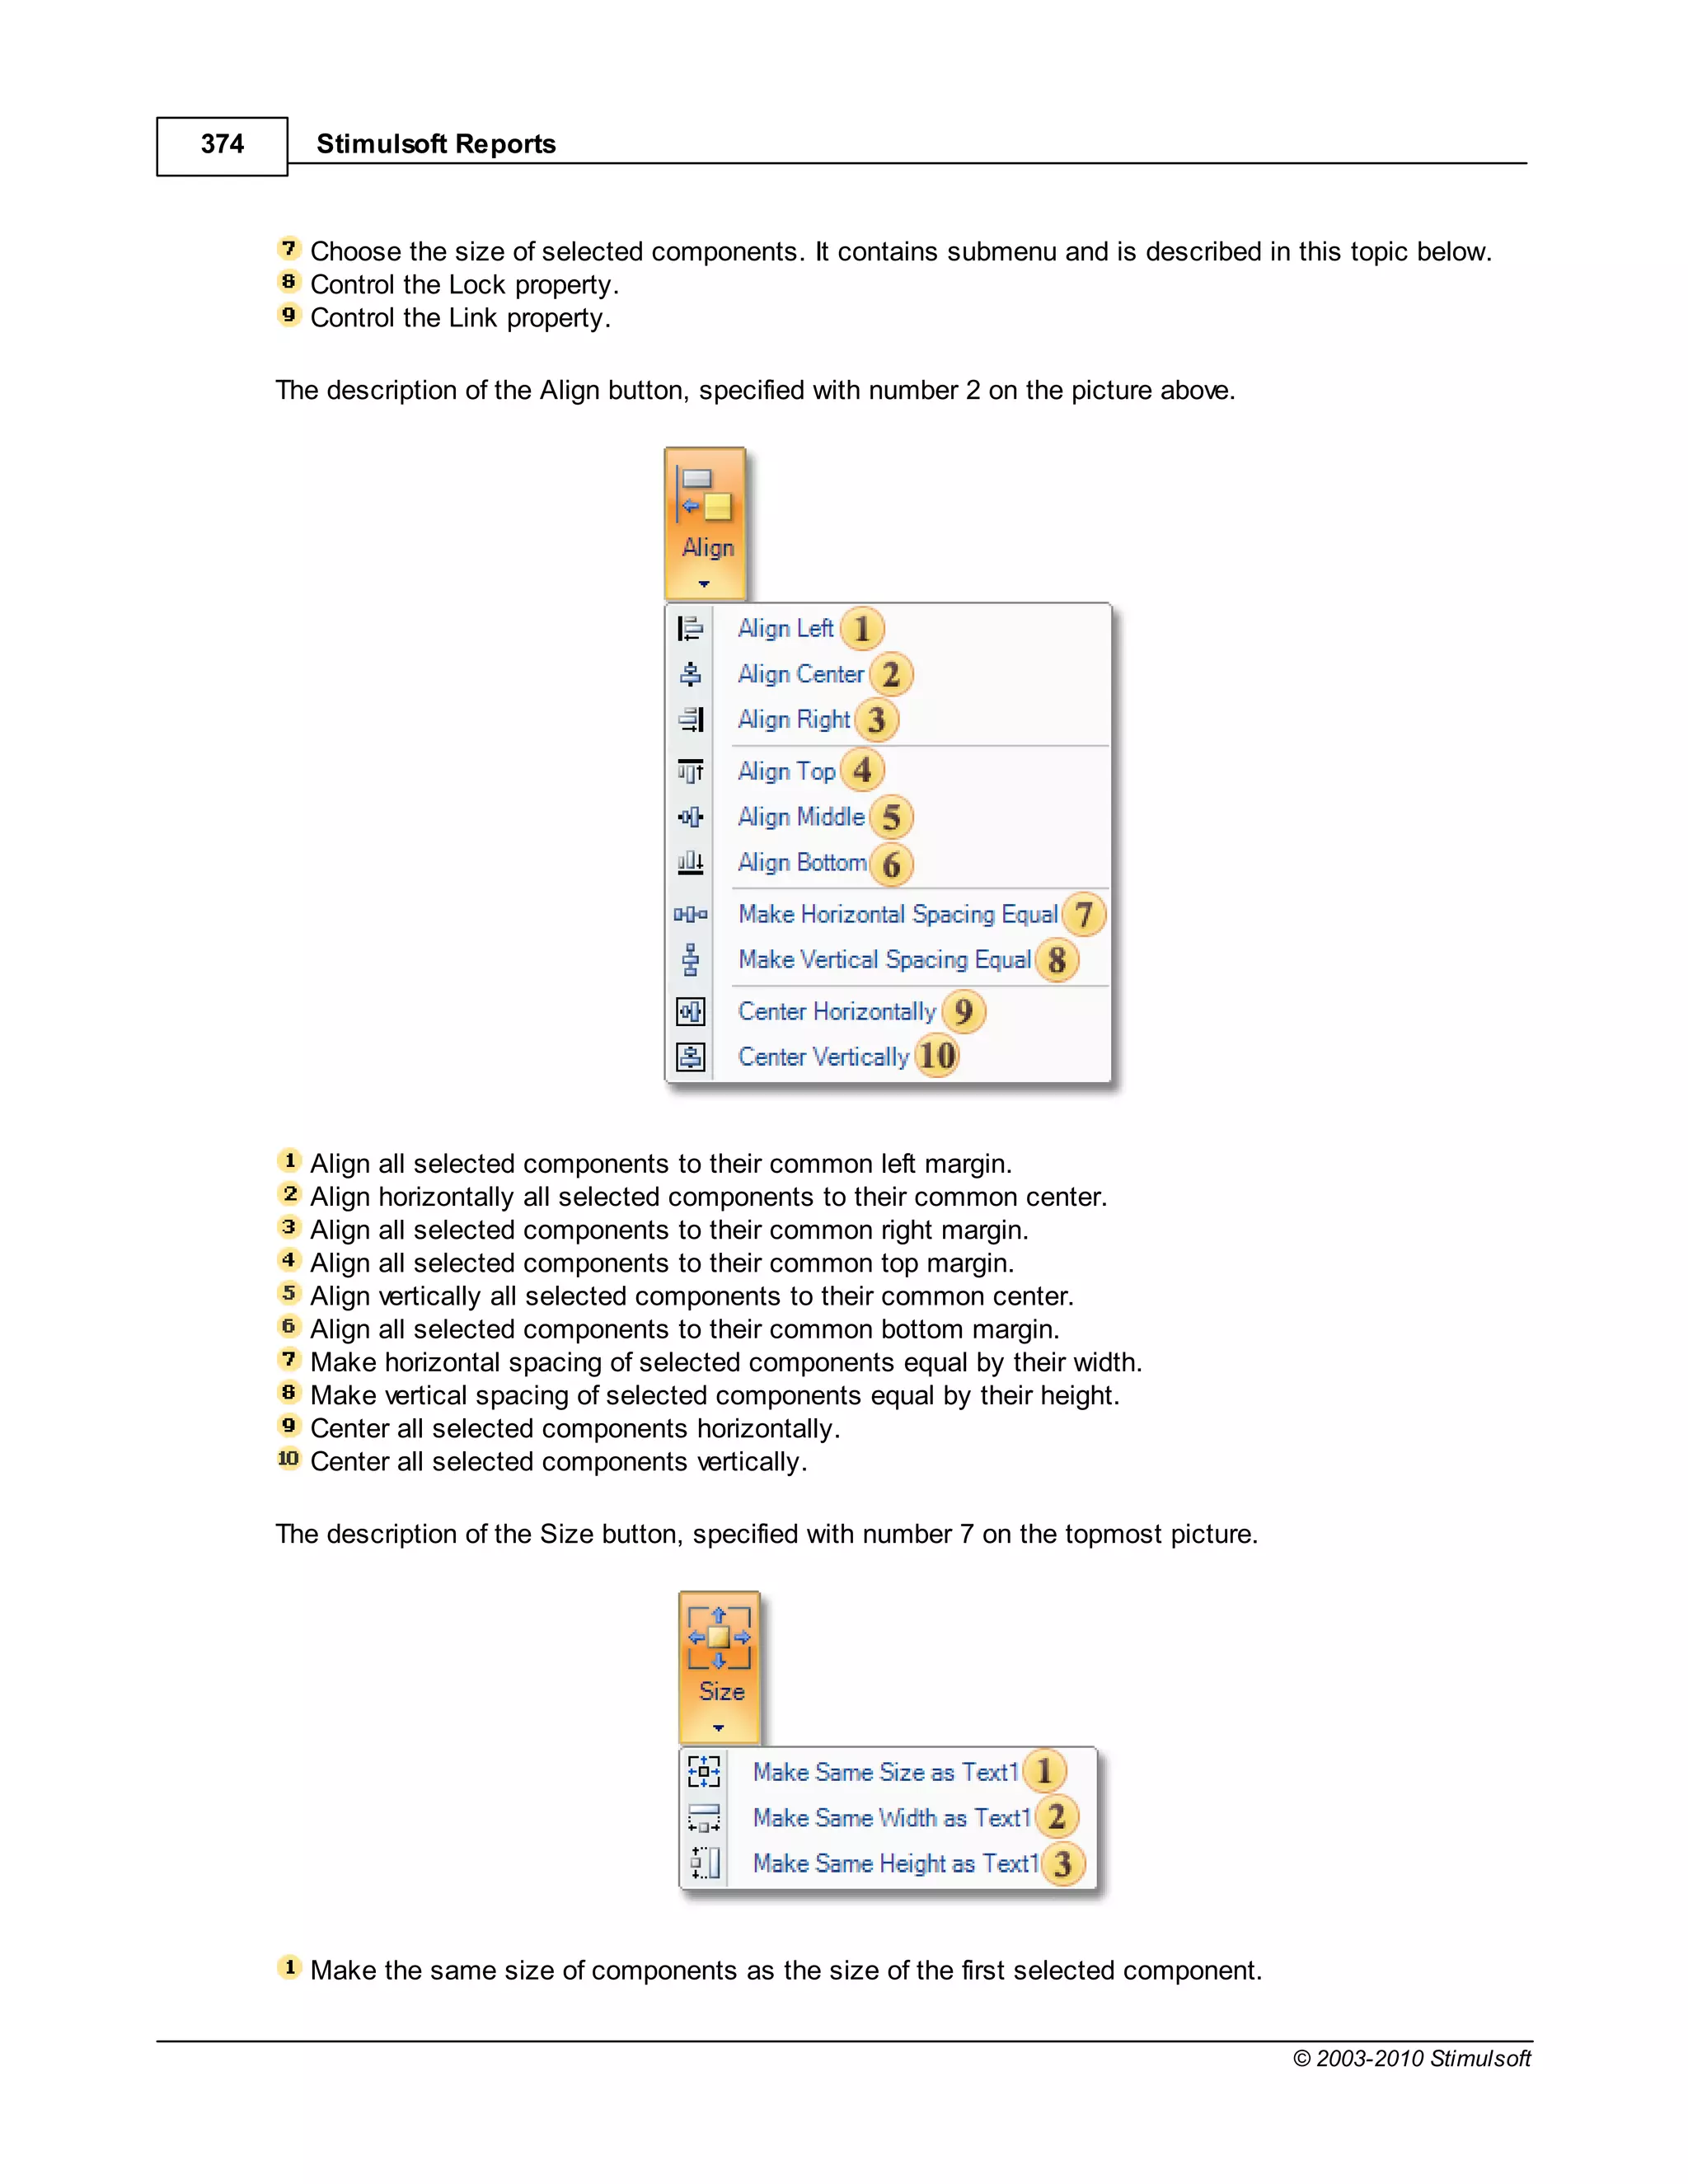
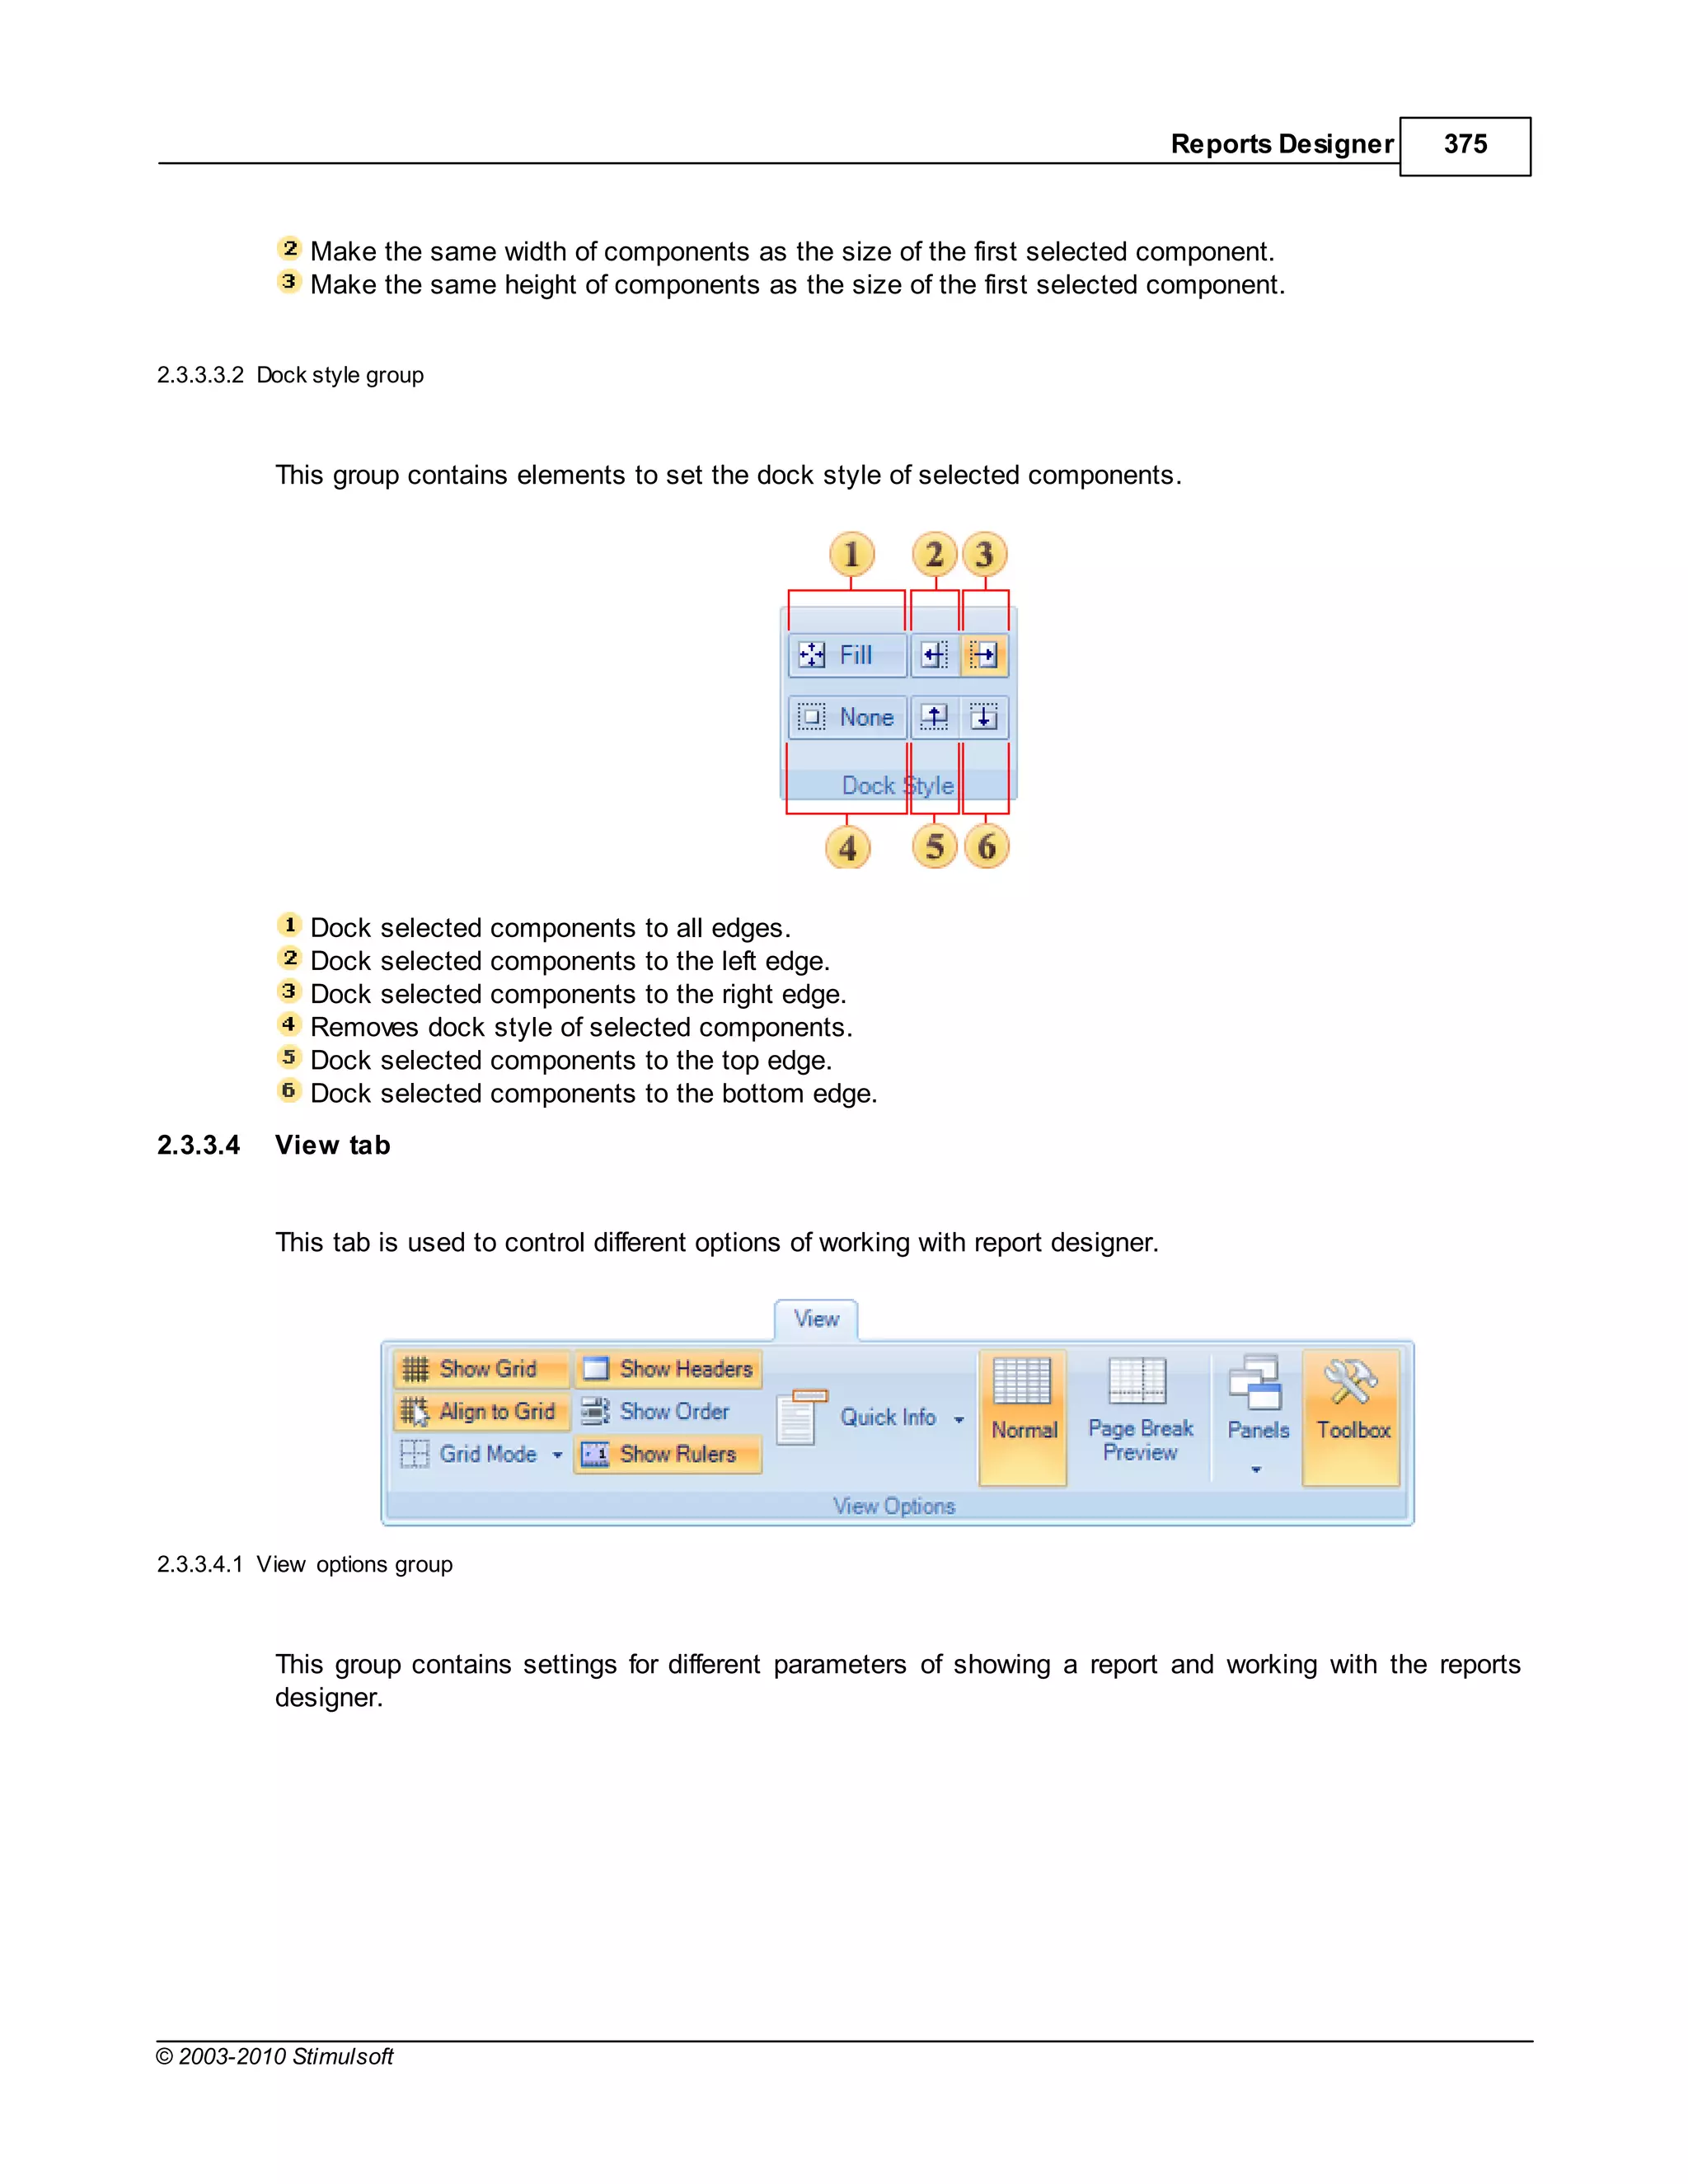
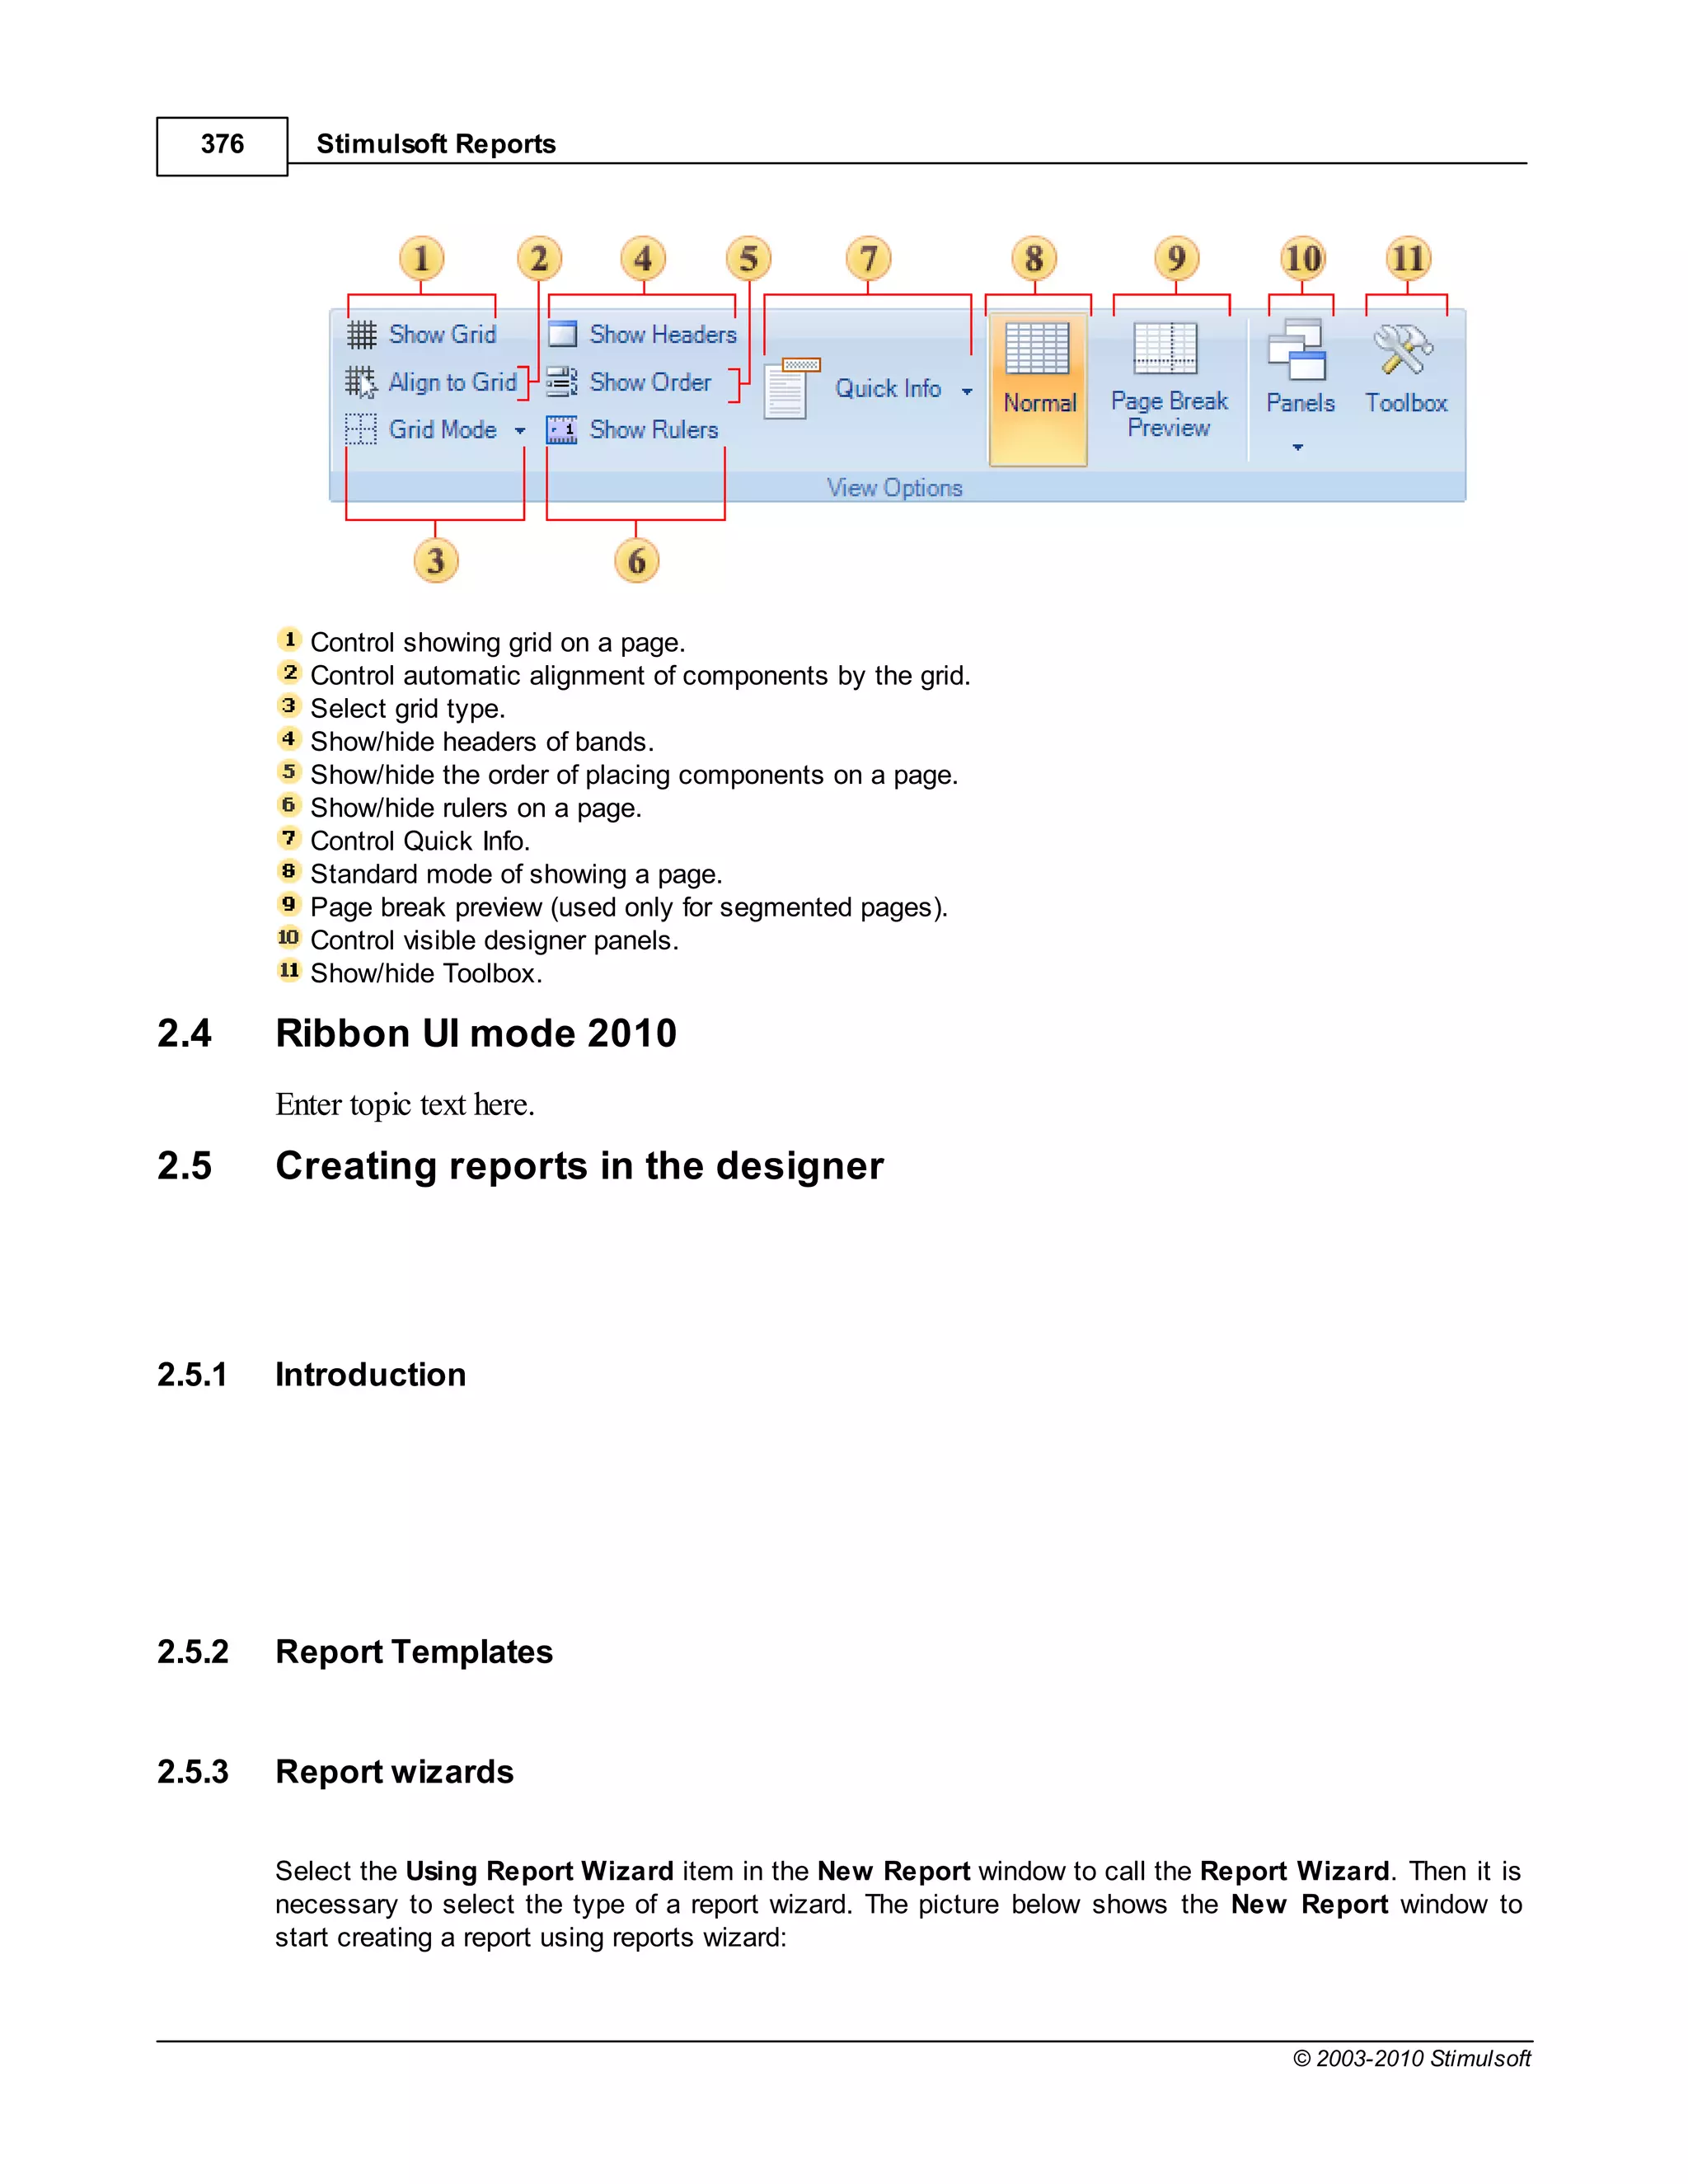
This document provides a table of contents for a report internals guide. The table of contents outlines topics related to expressions, appearance, conditional formatting, output text parameters, text formatting, HTML tags, RTF text, graphics, autosizing, barcodes, bands, lists, groups, page elements, columns, page numbering, empty bands, watermarks, panels, cross tables, and charts in reports. It provides a high-level overview of the structural and formatting elements that can be included in a report.
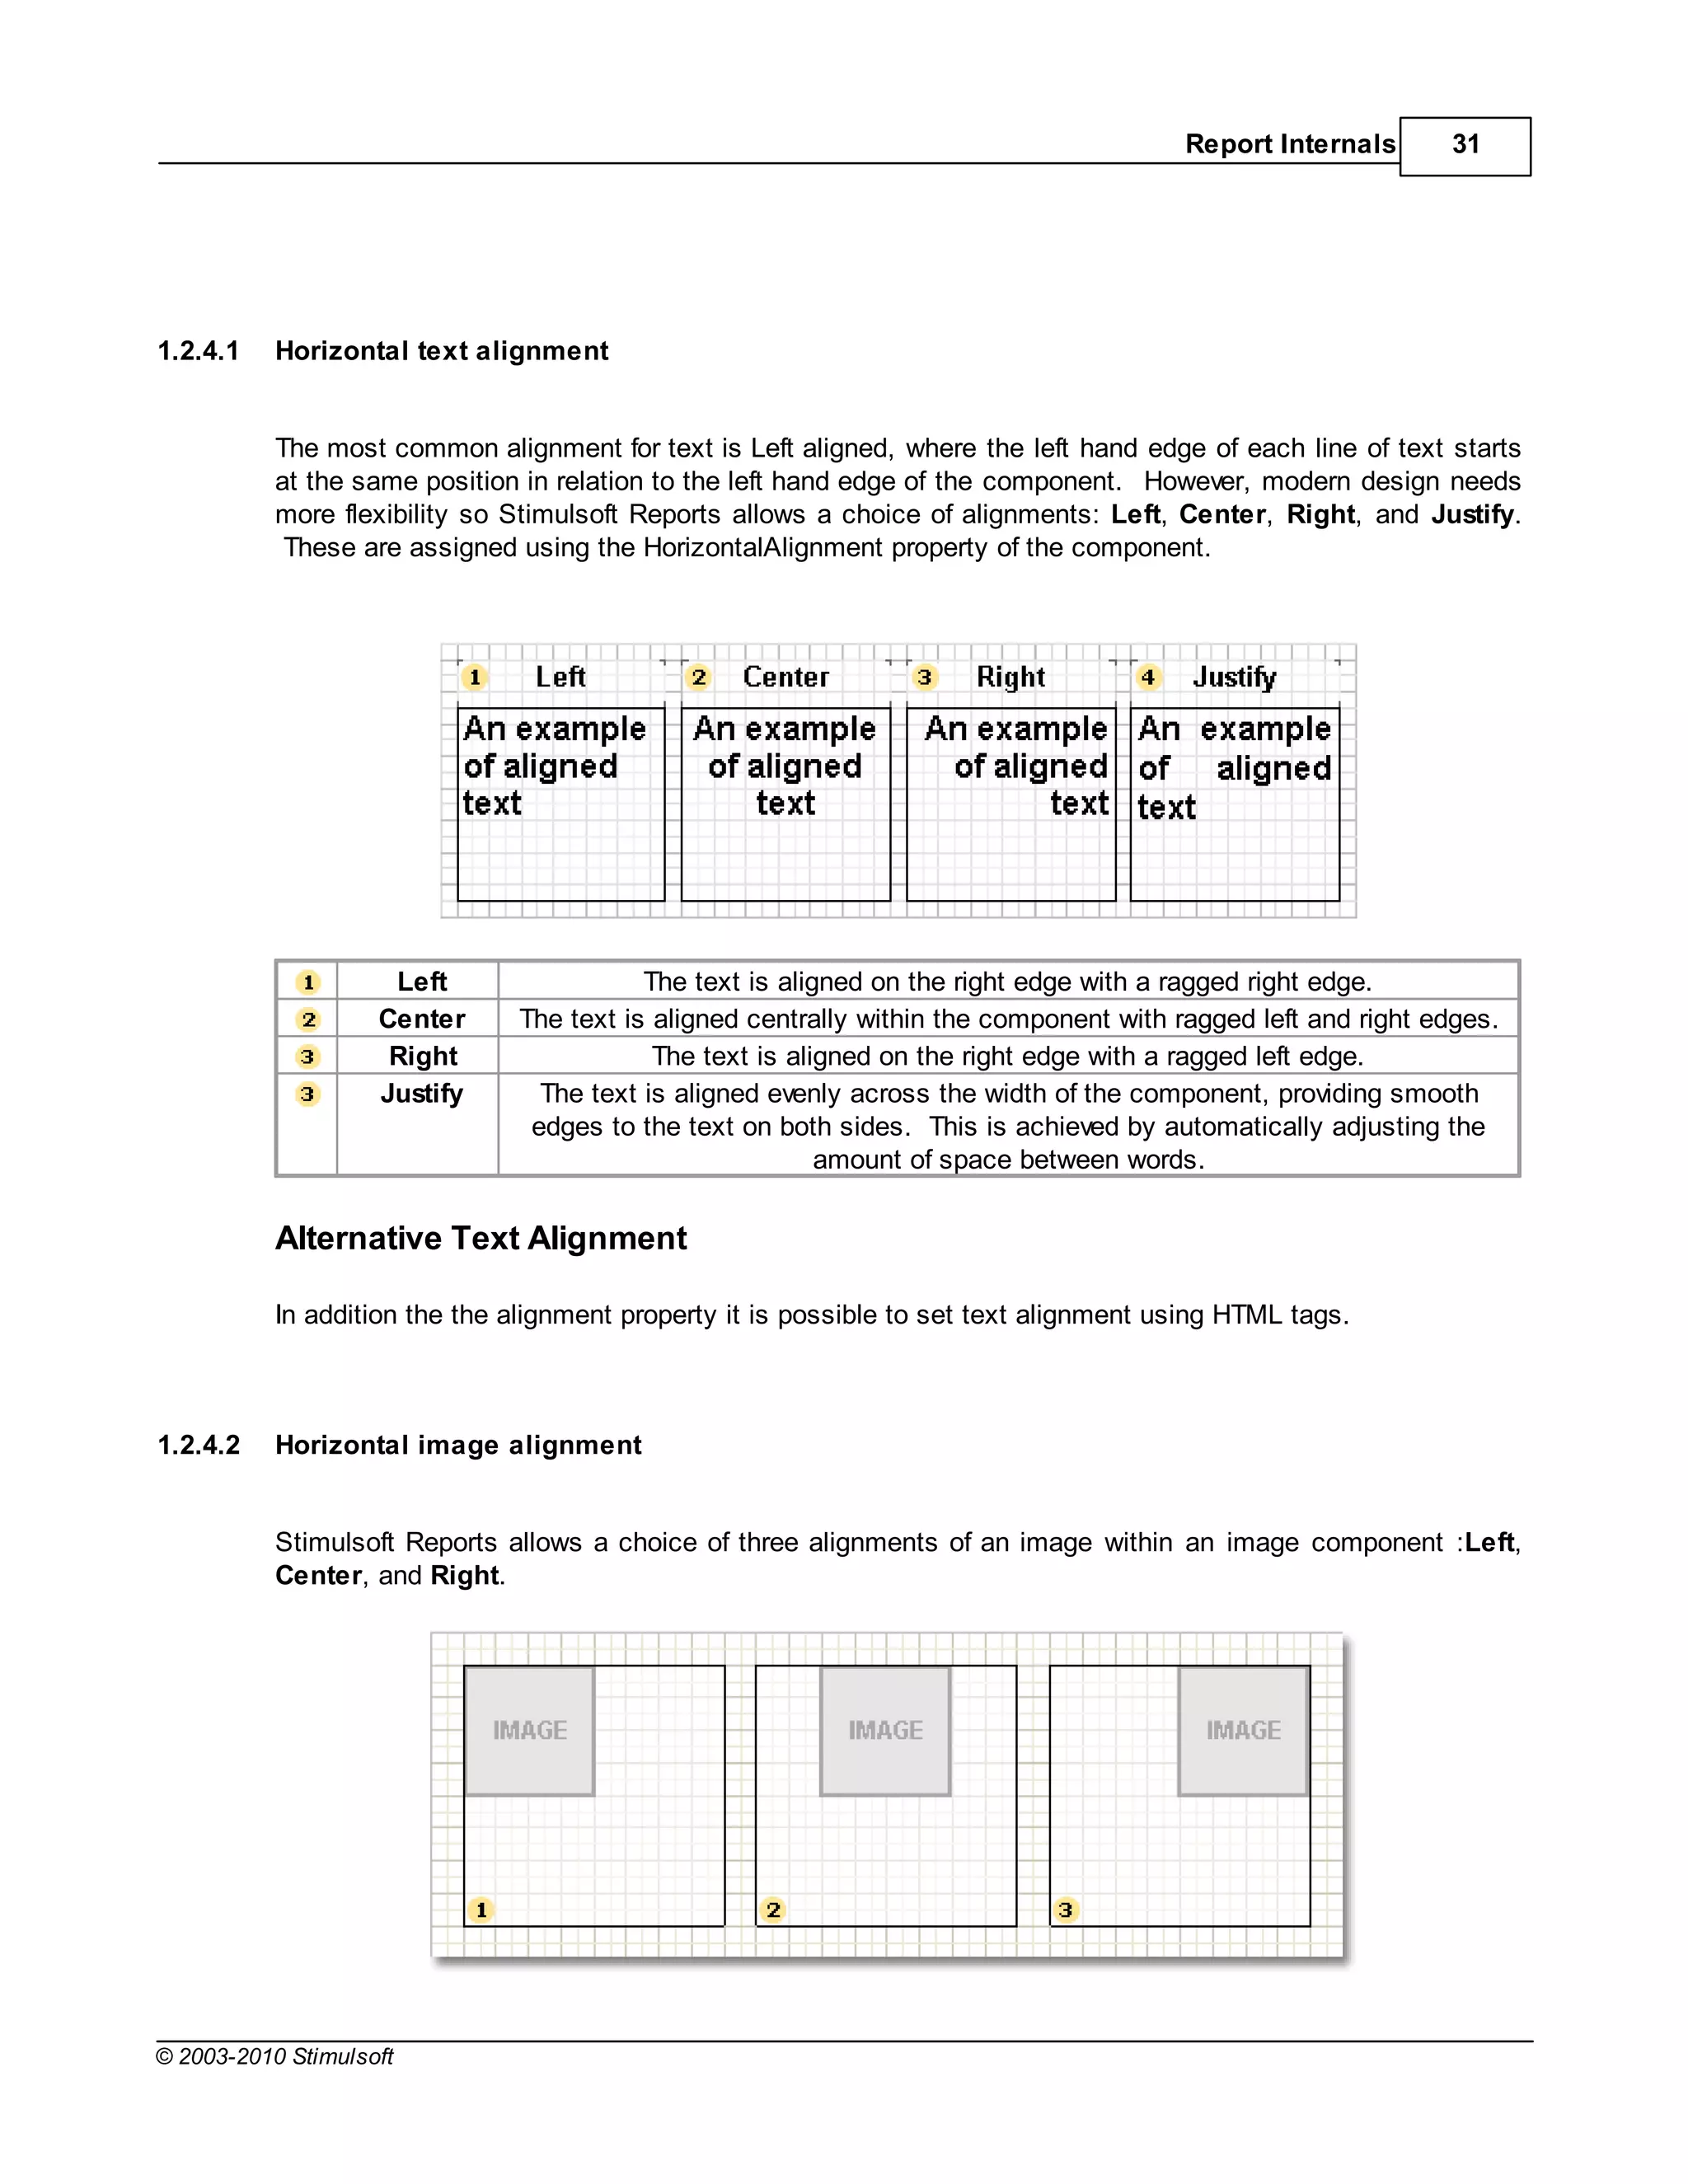
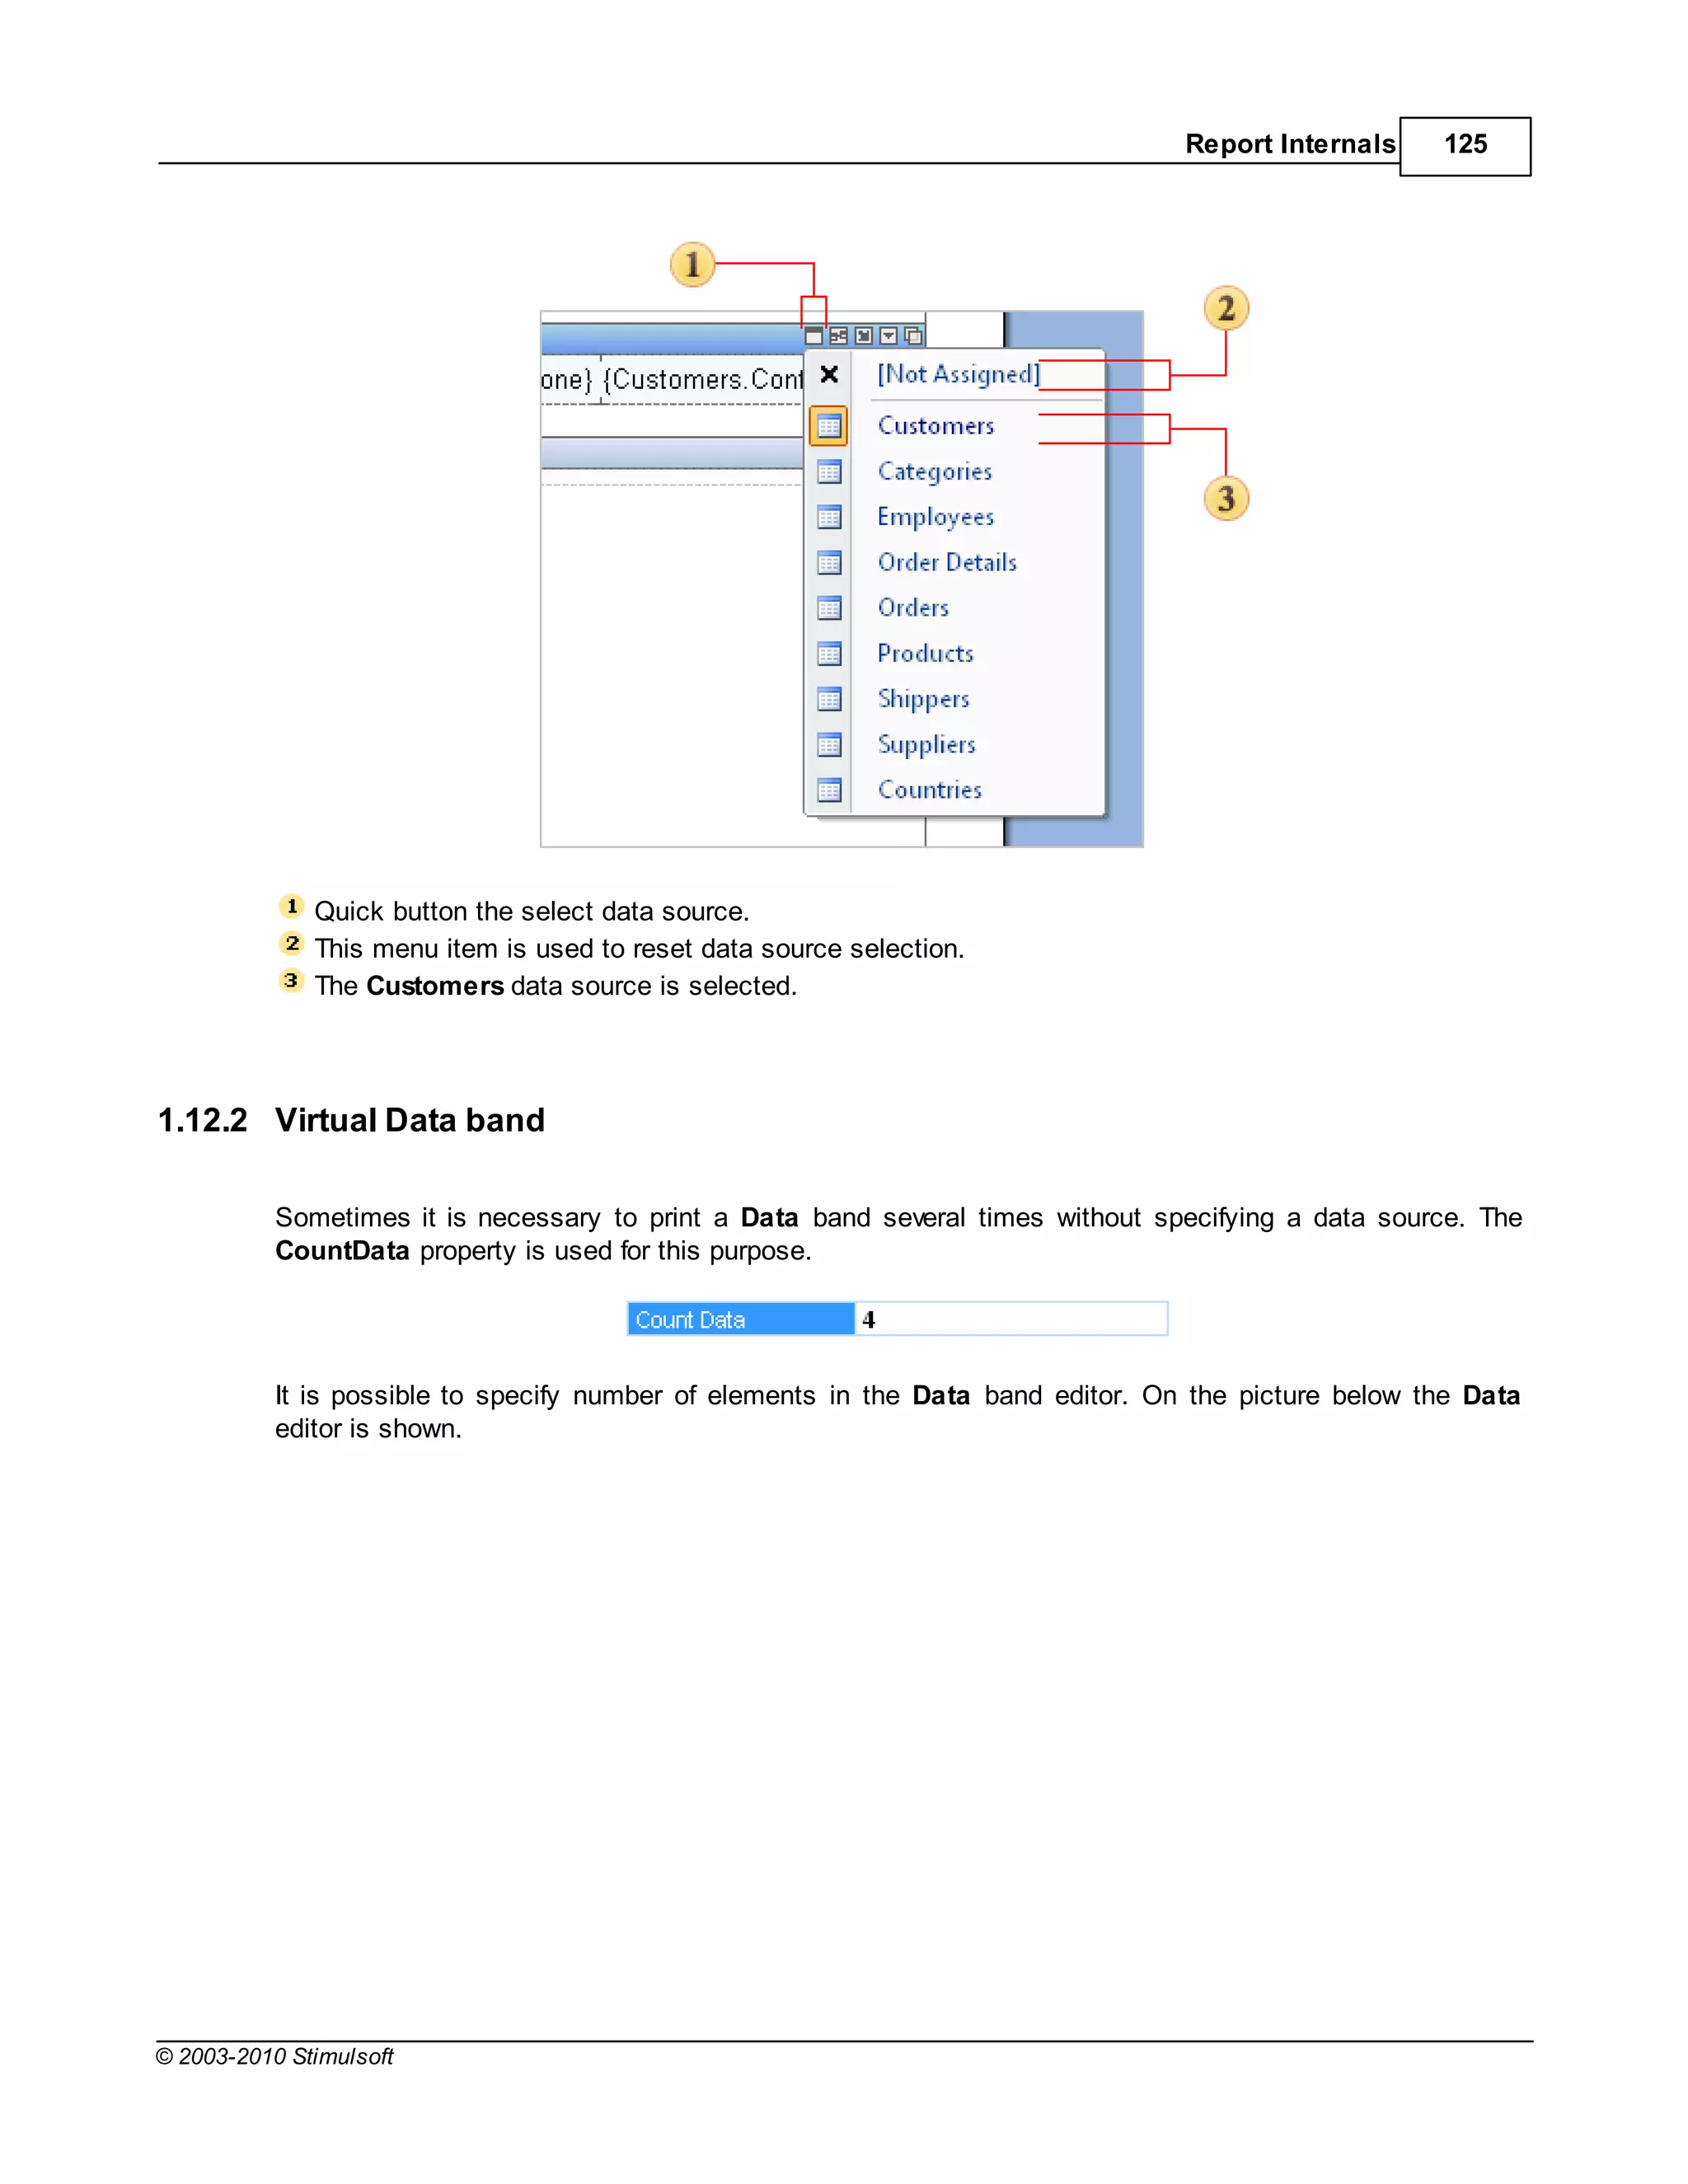
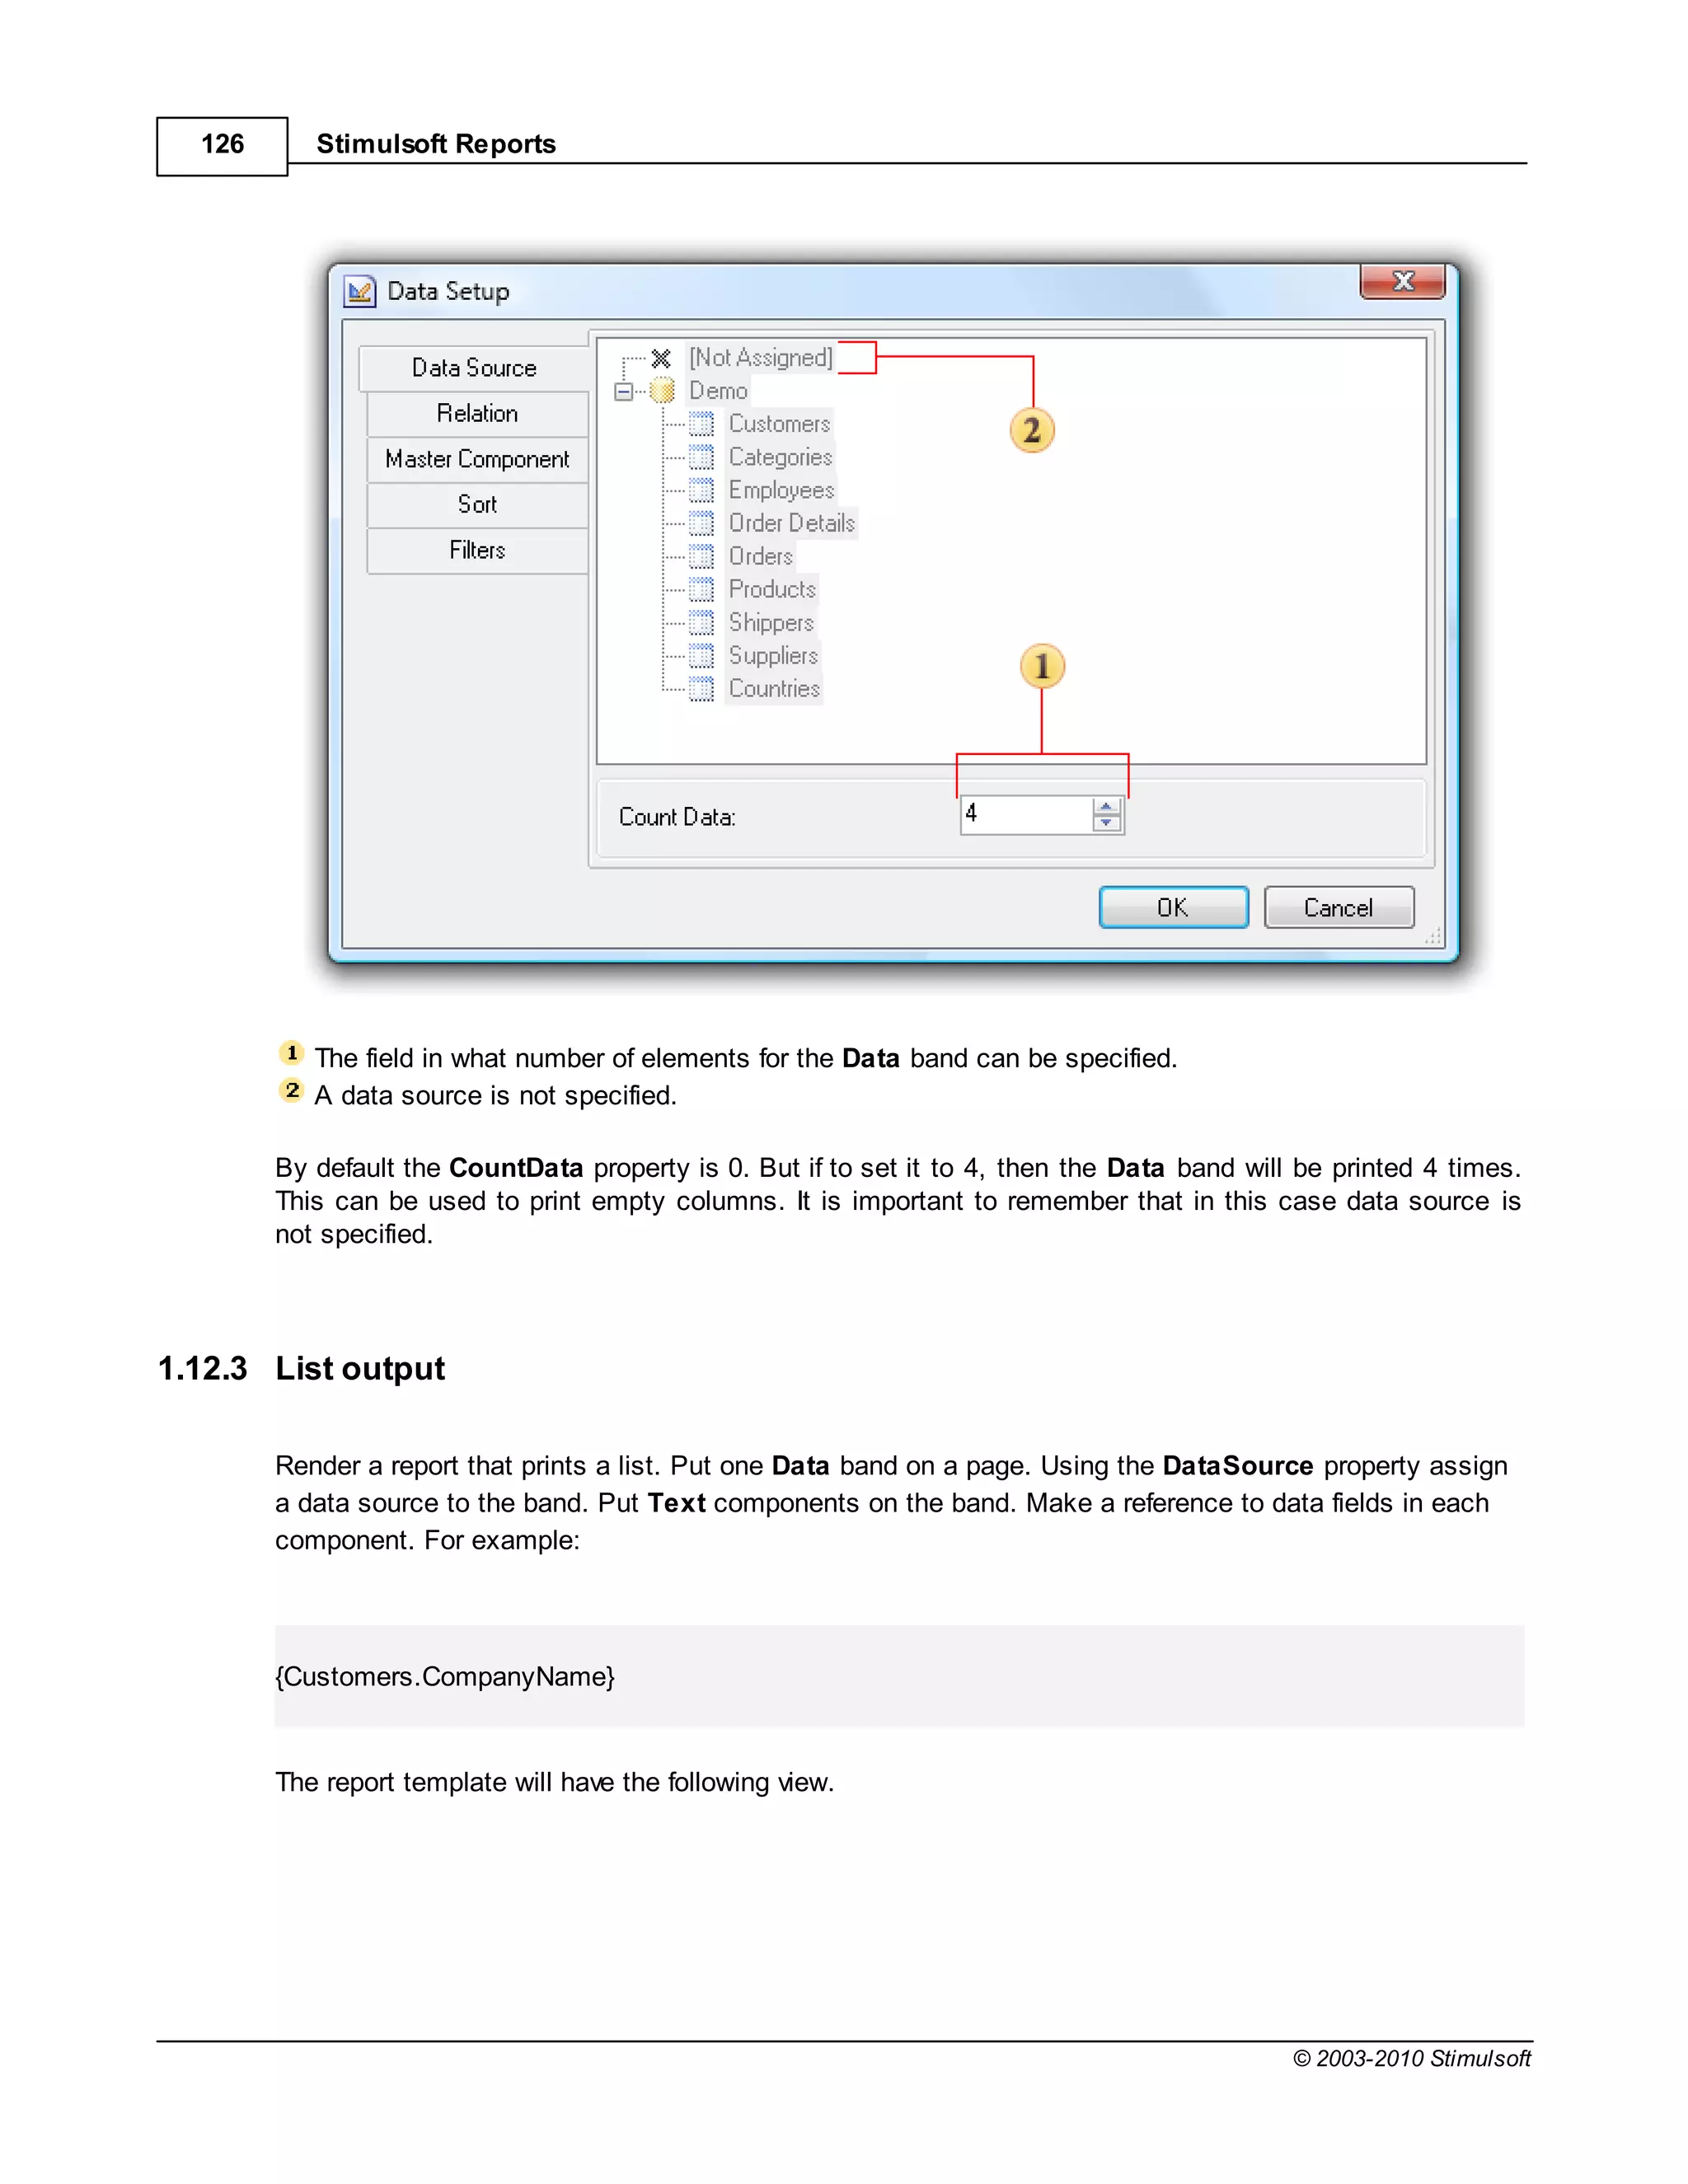
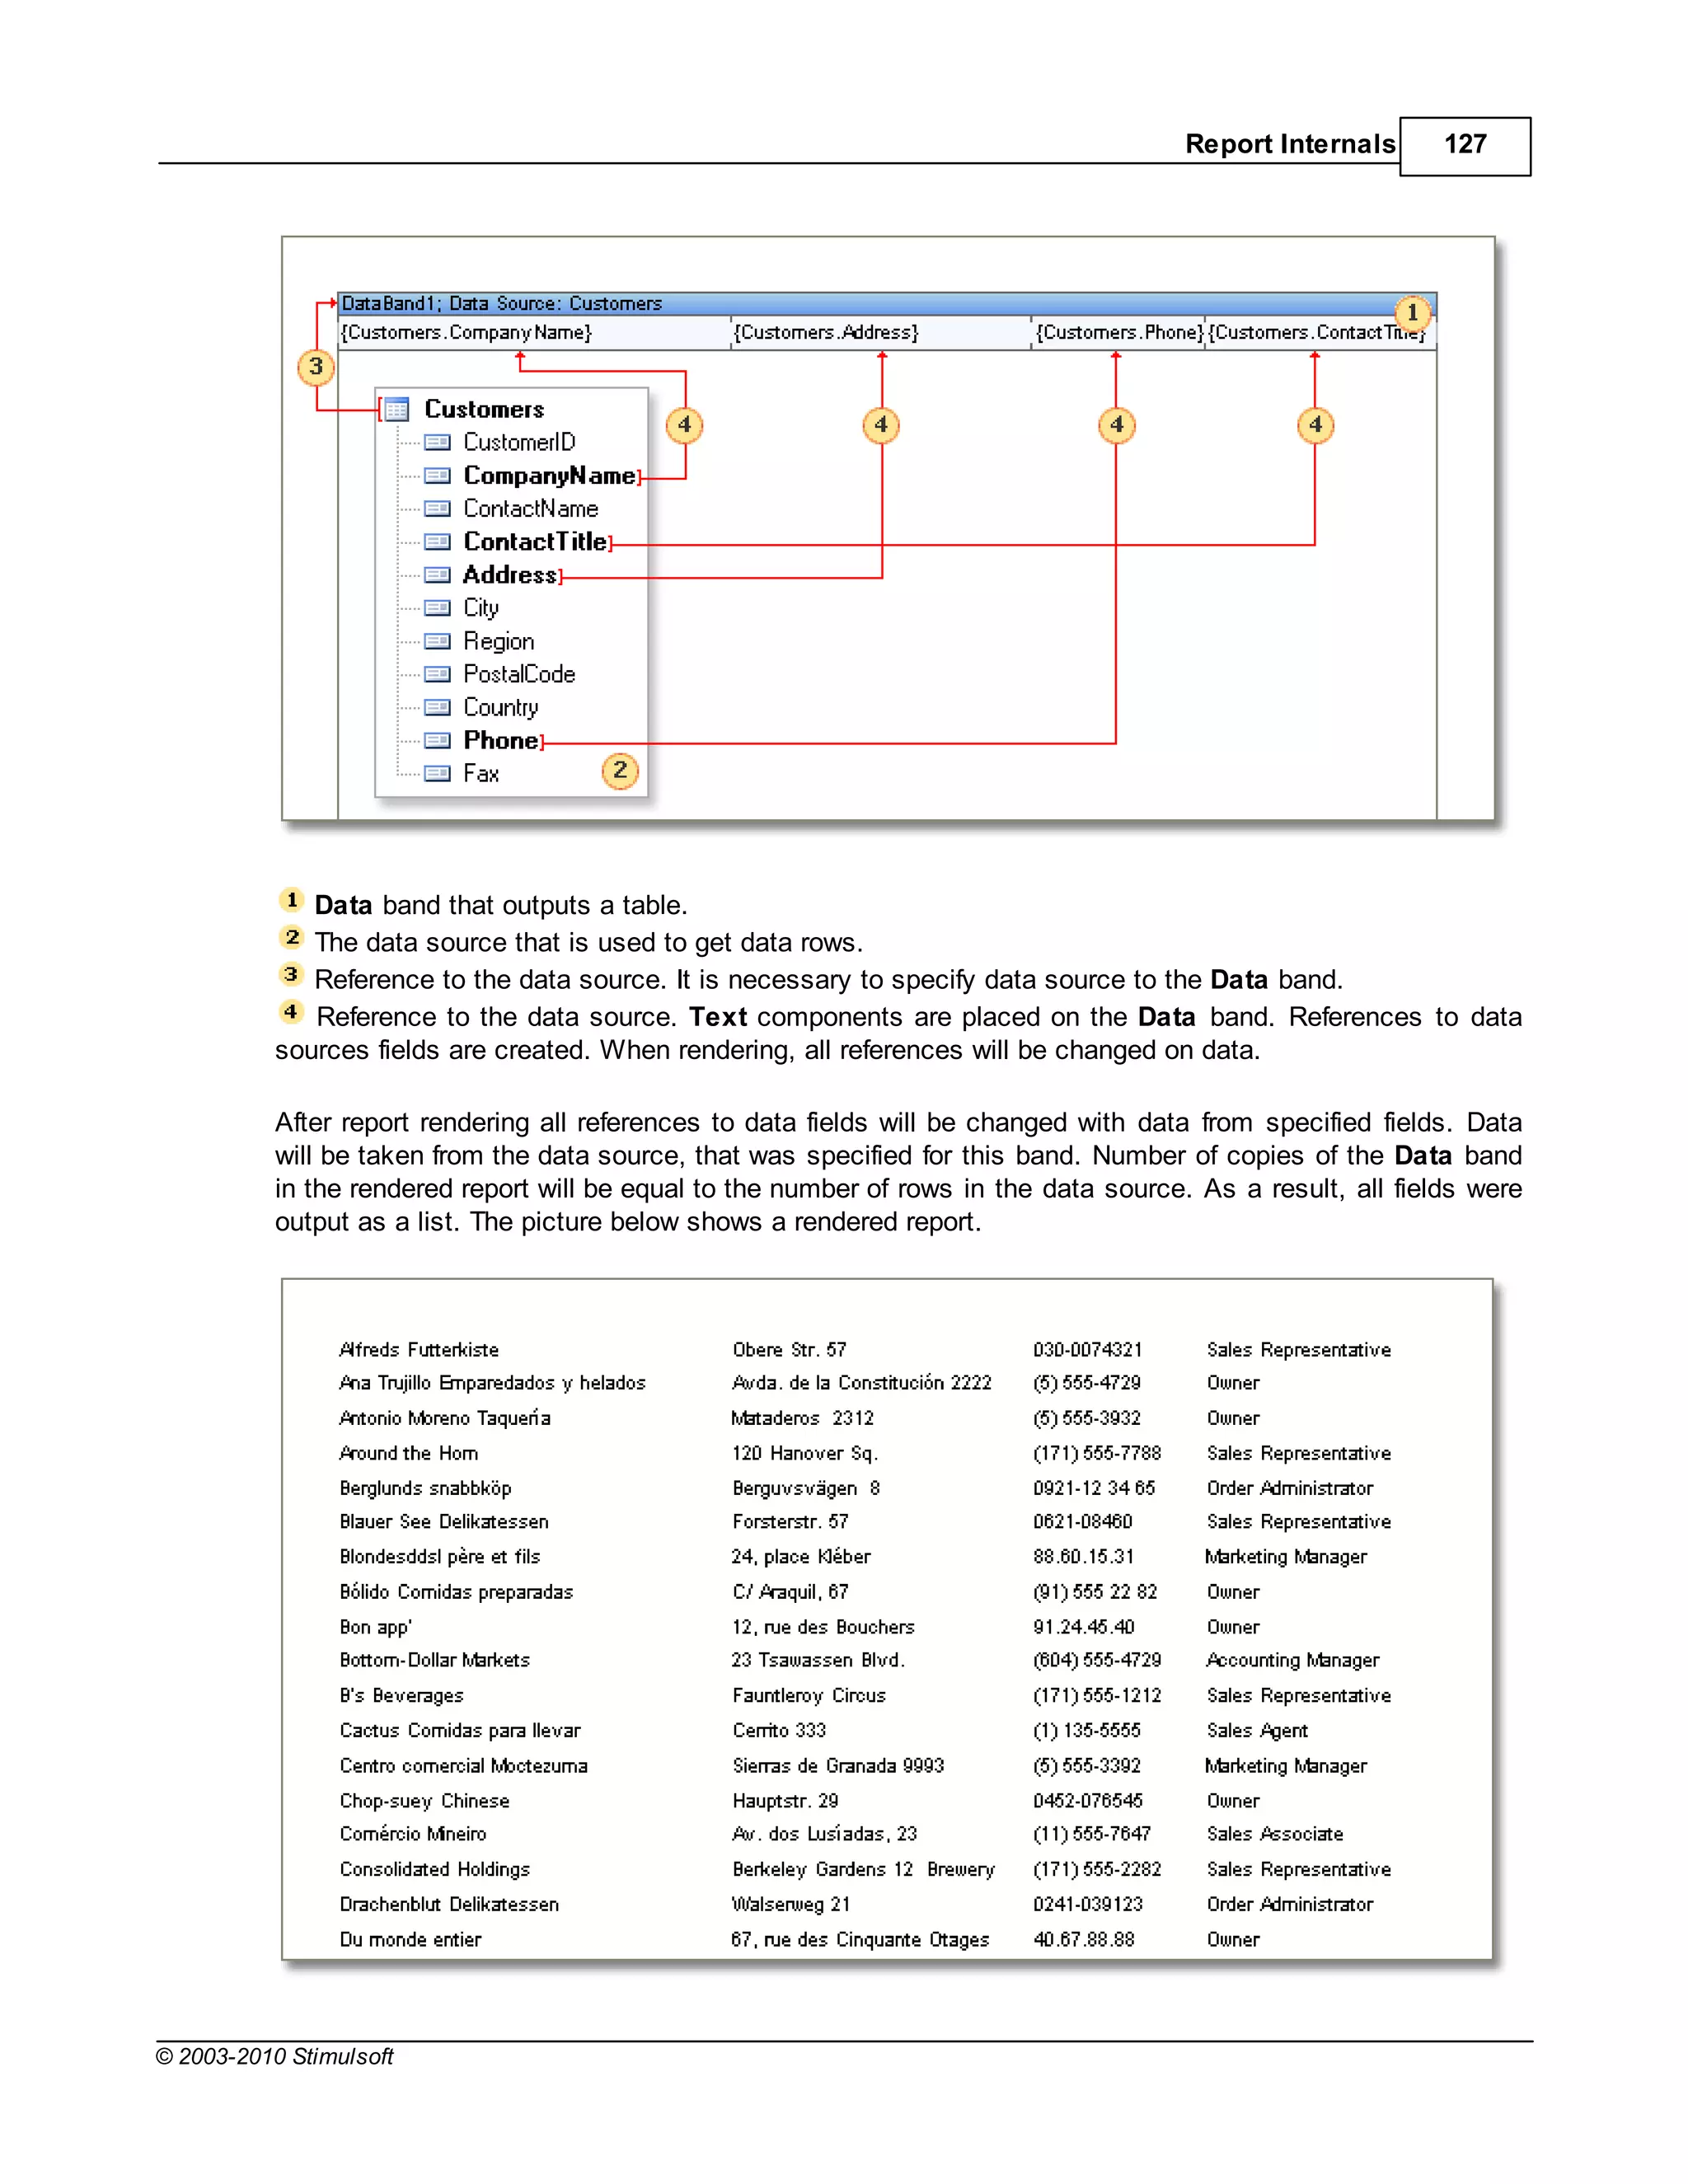
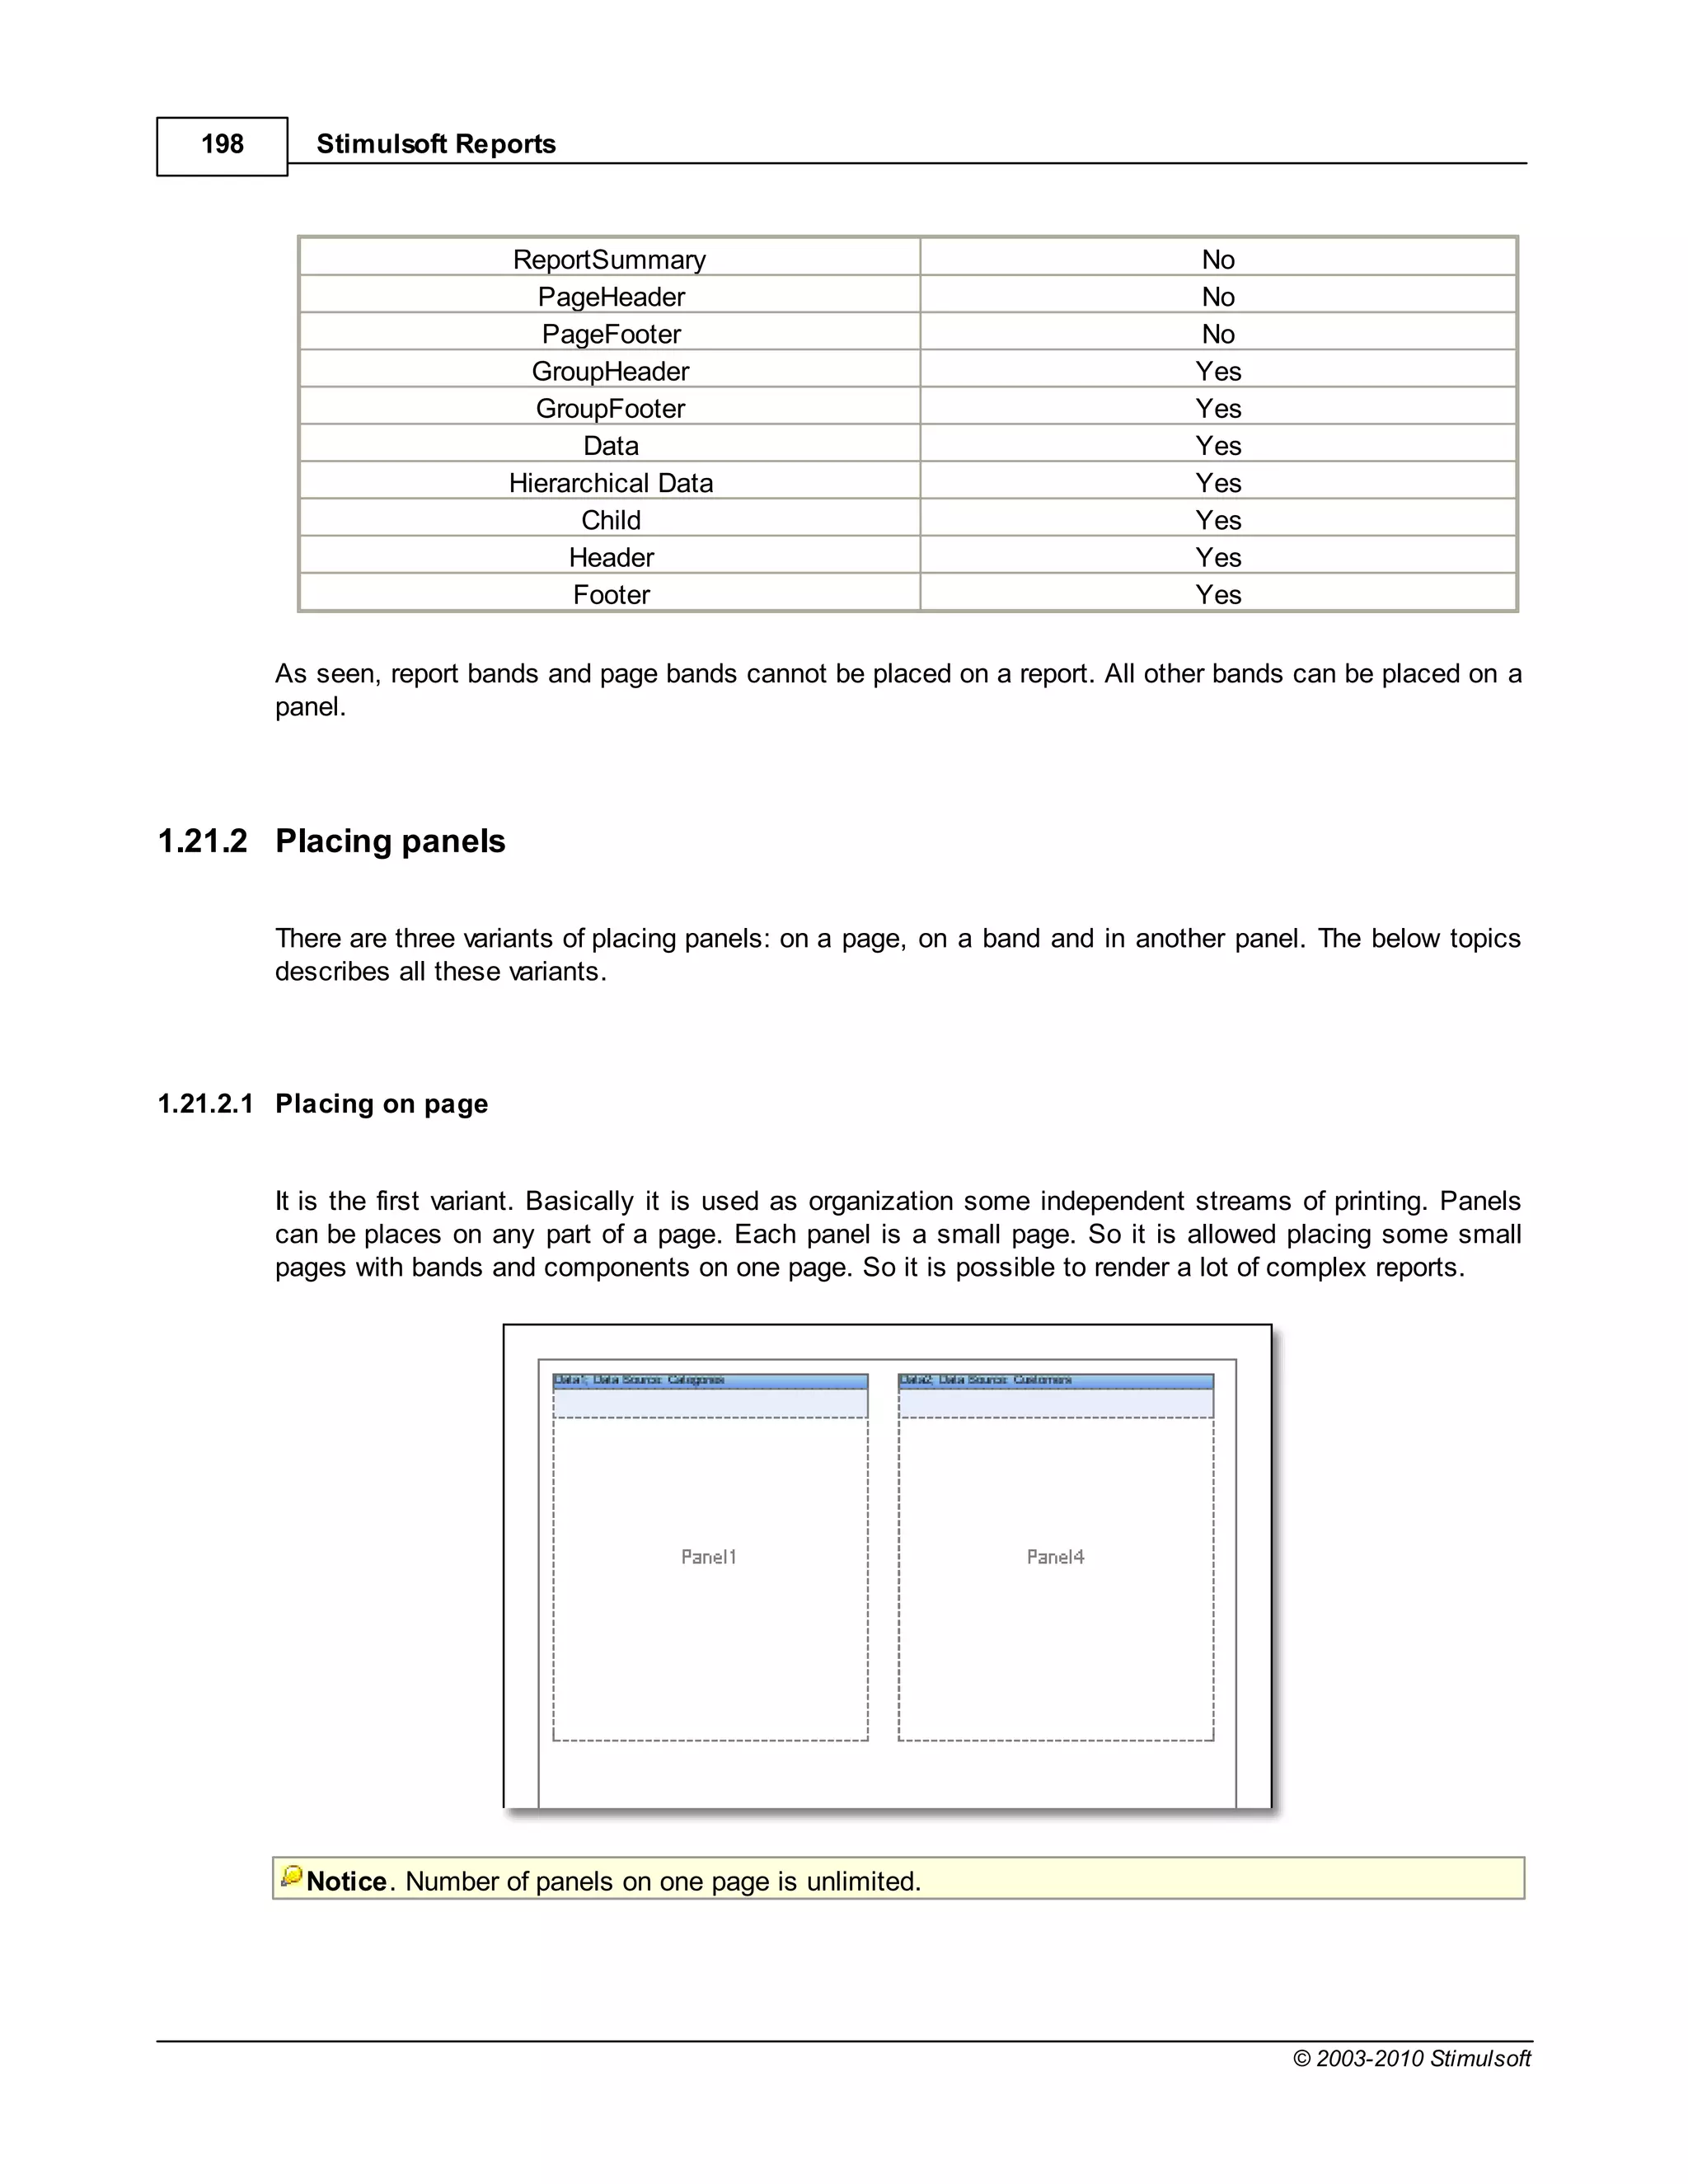
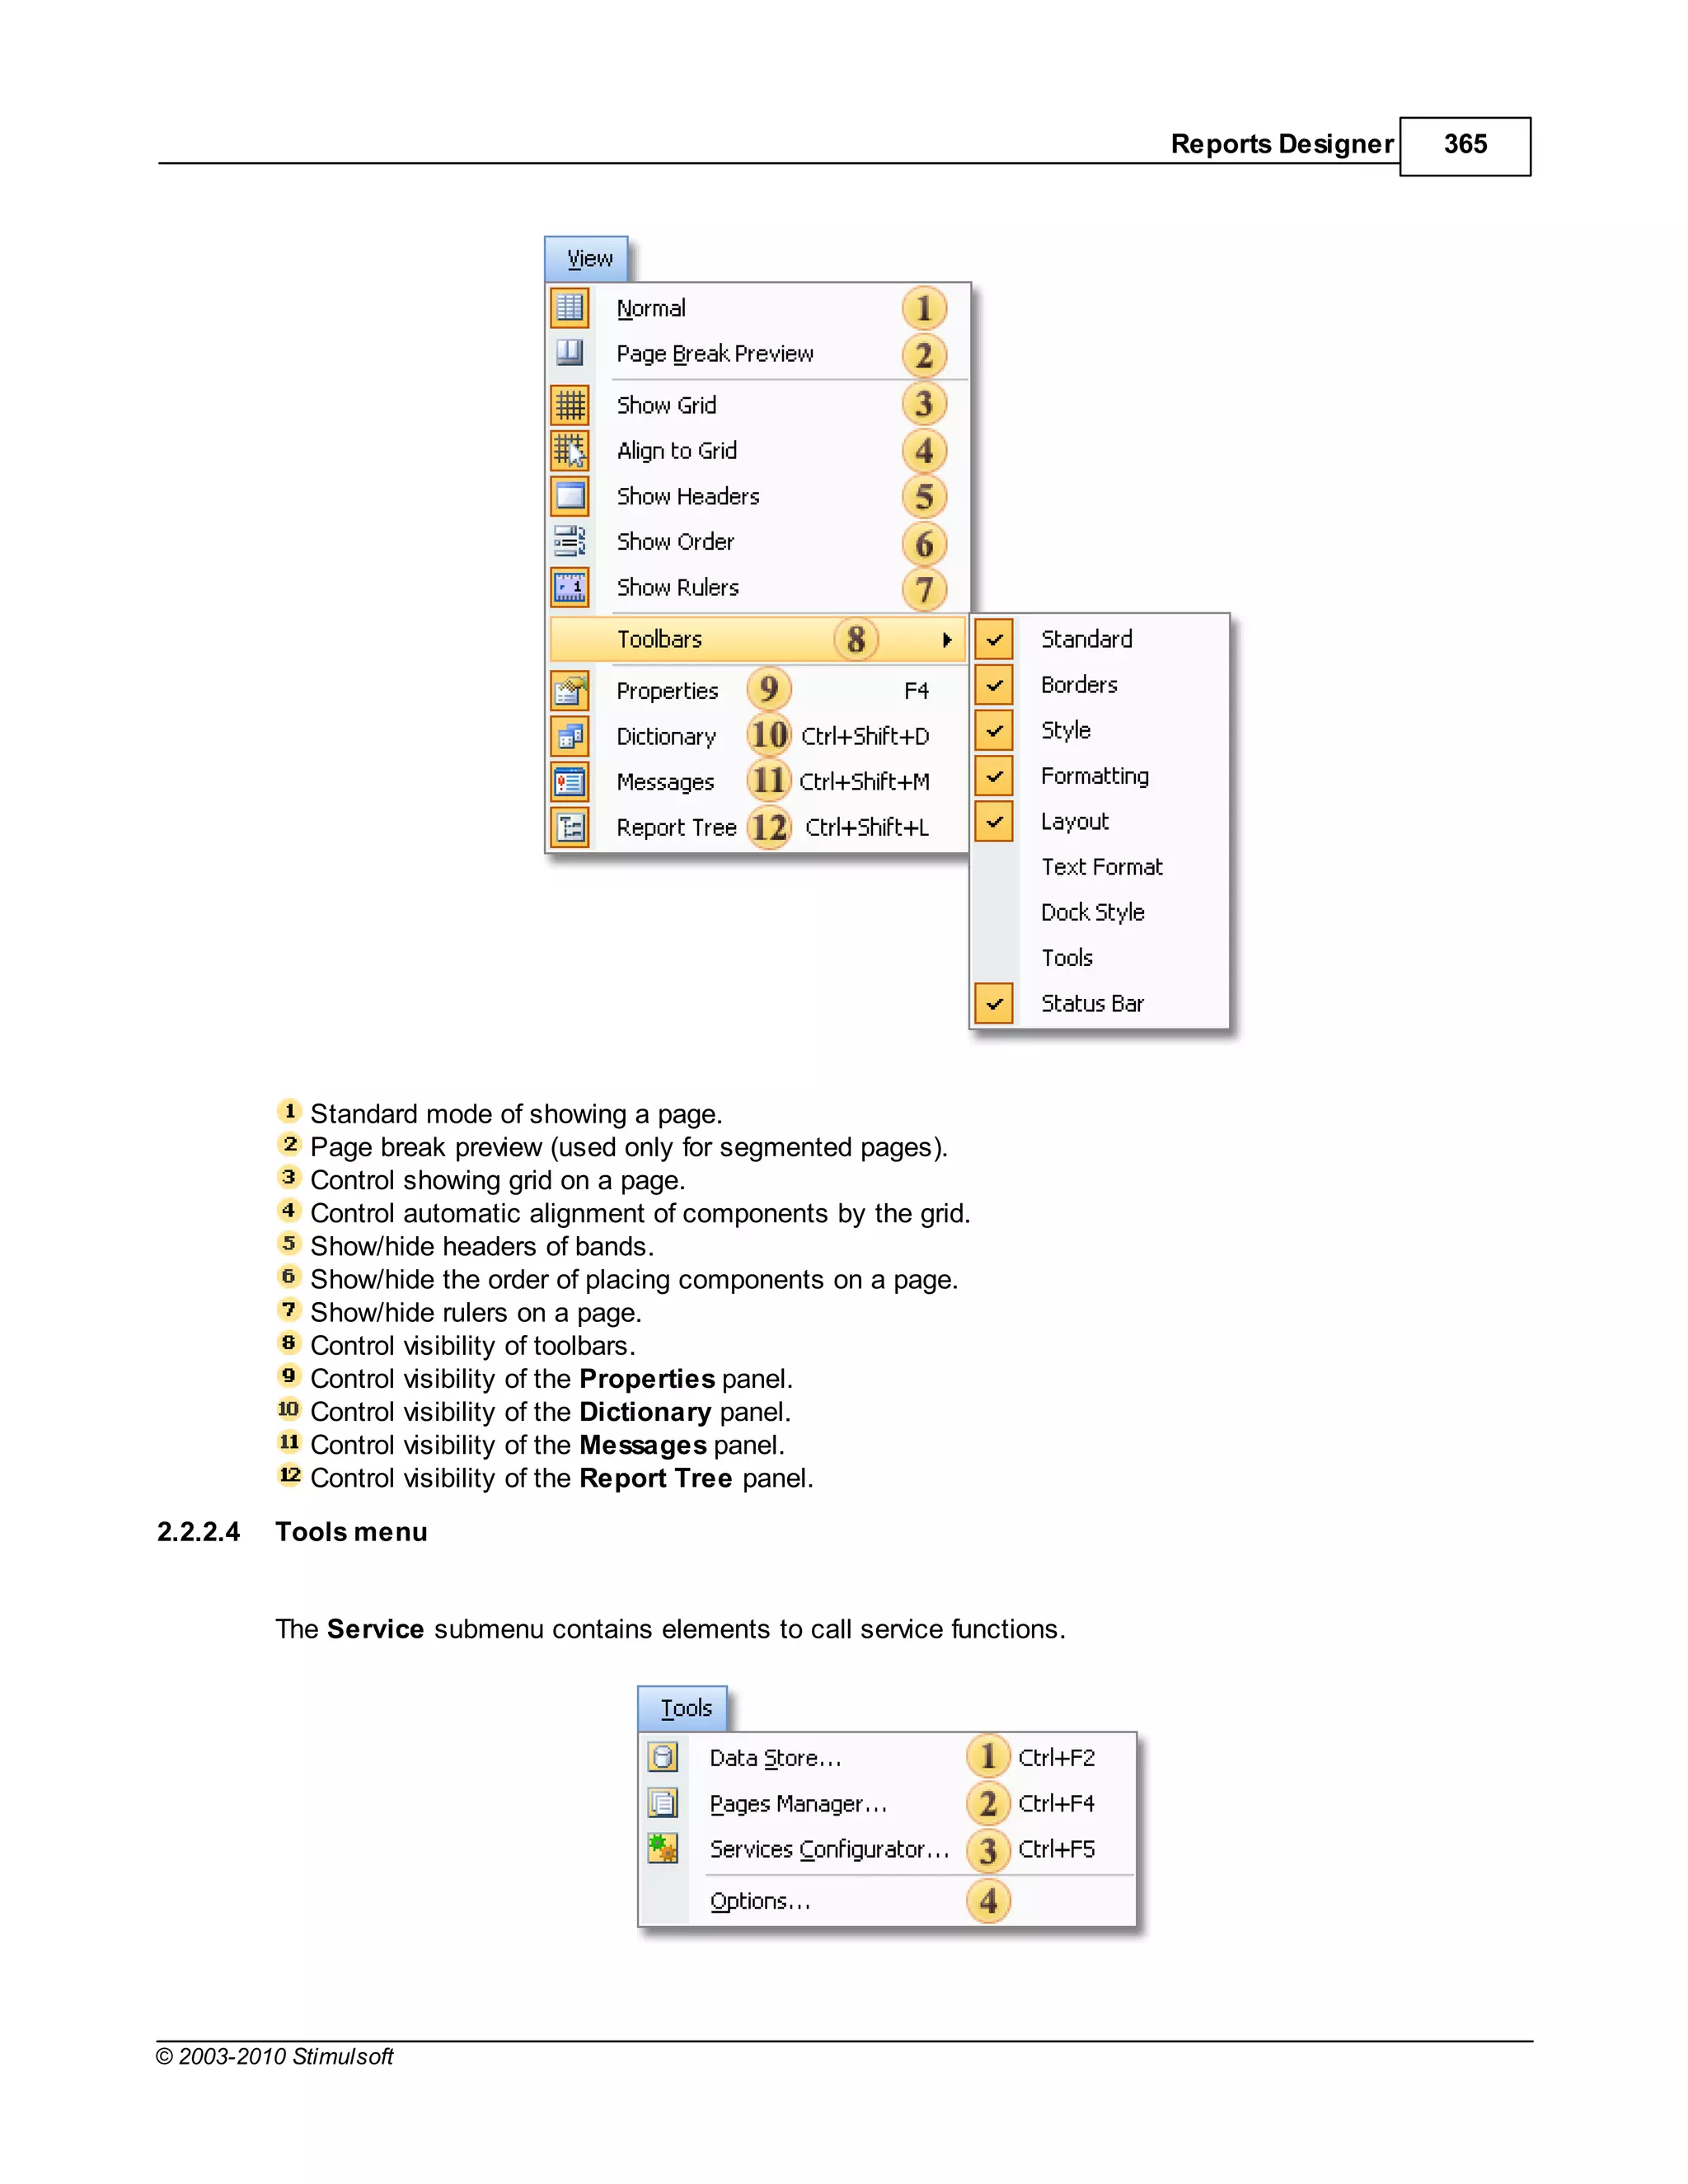
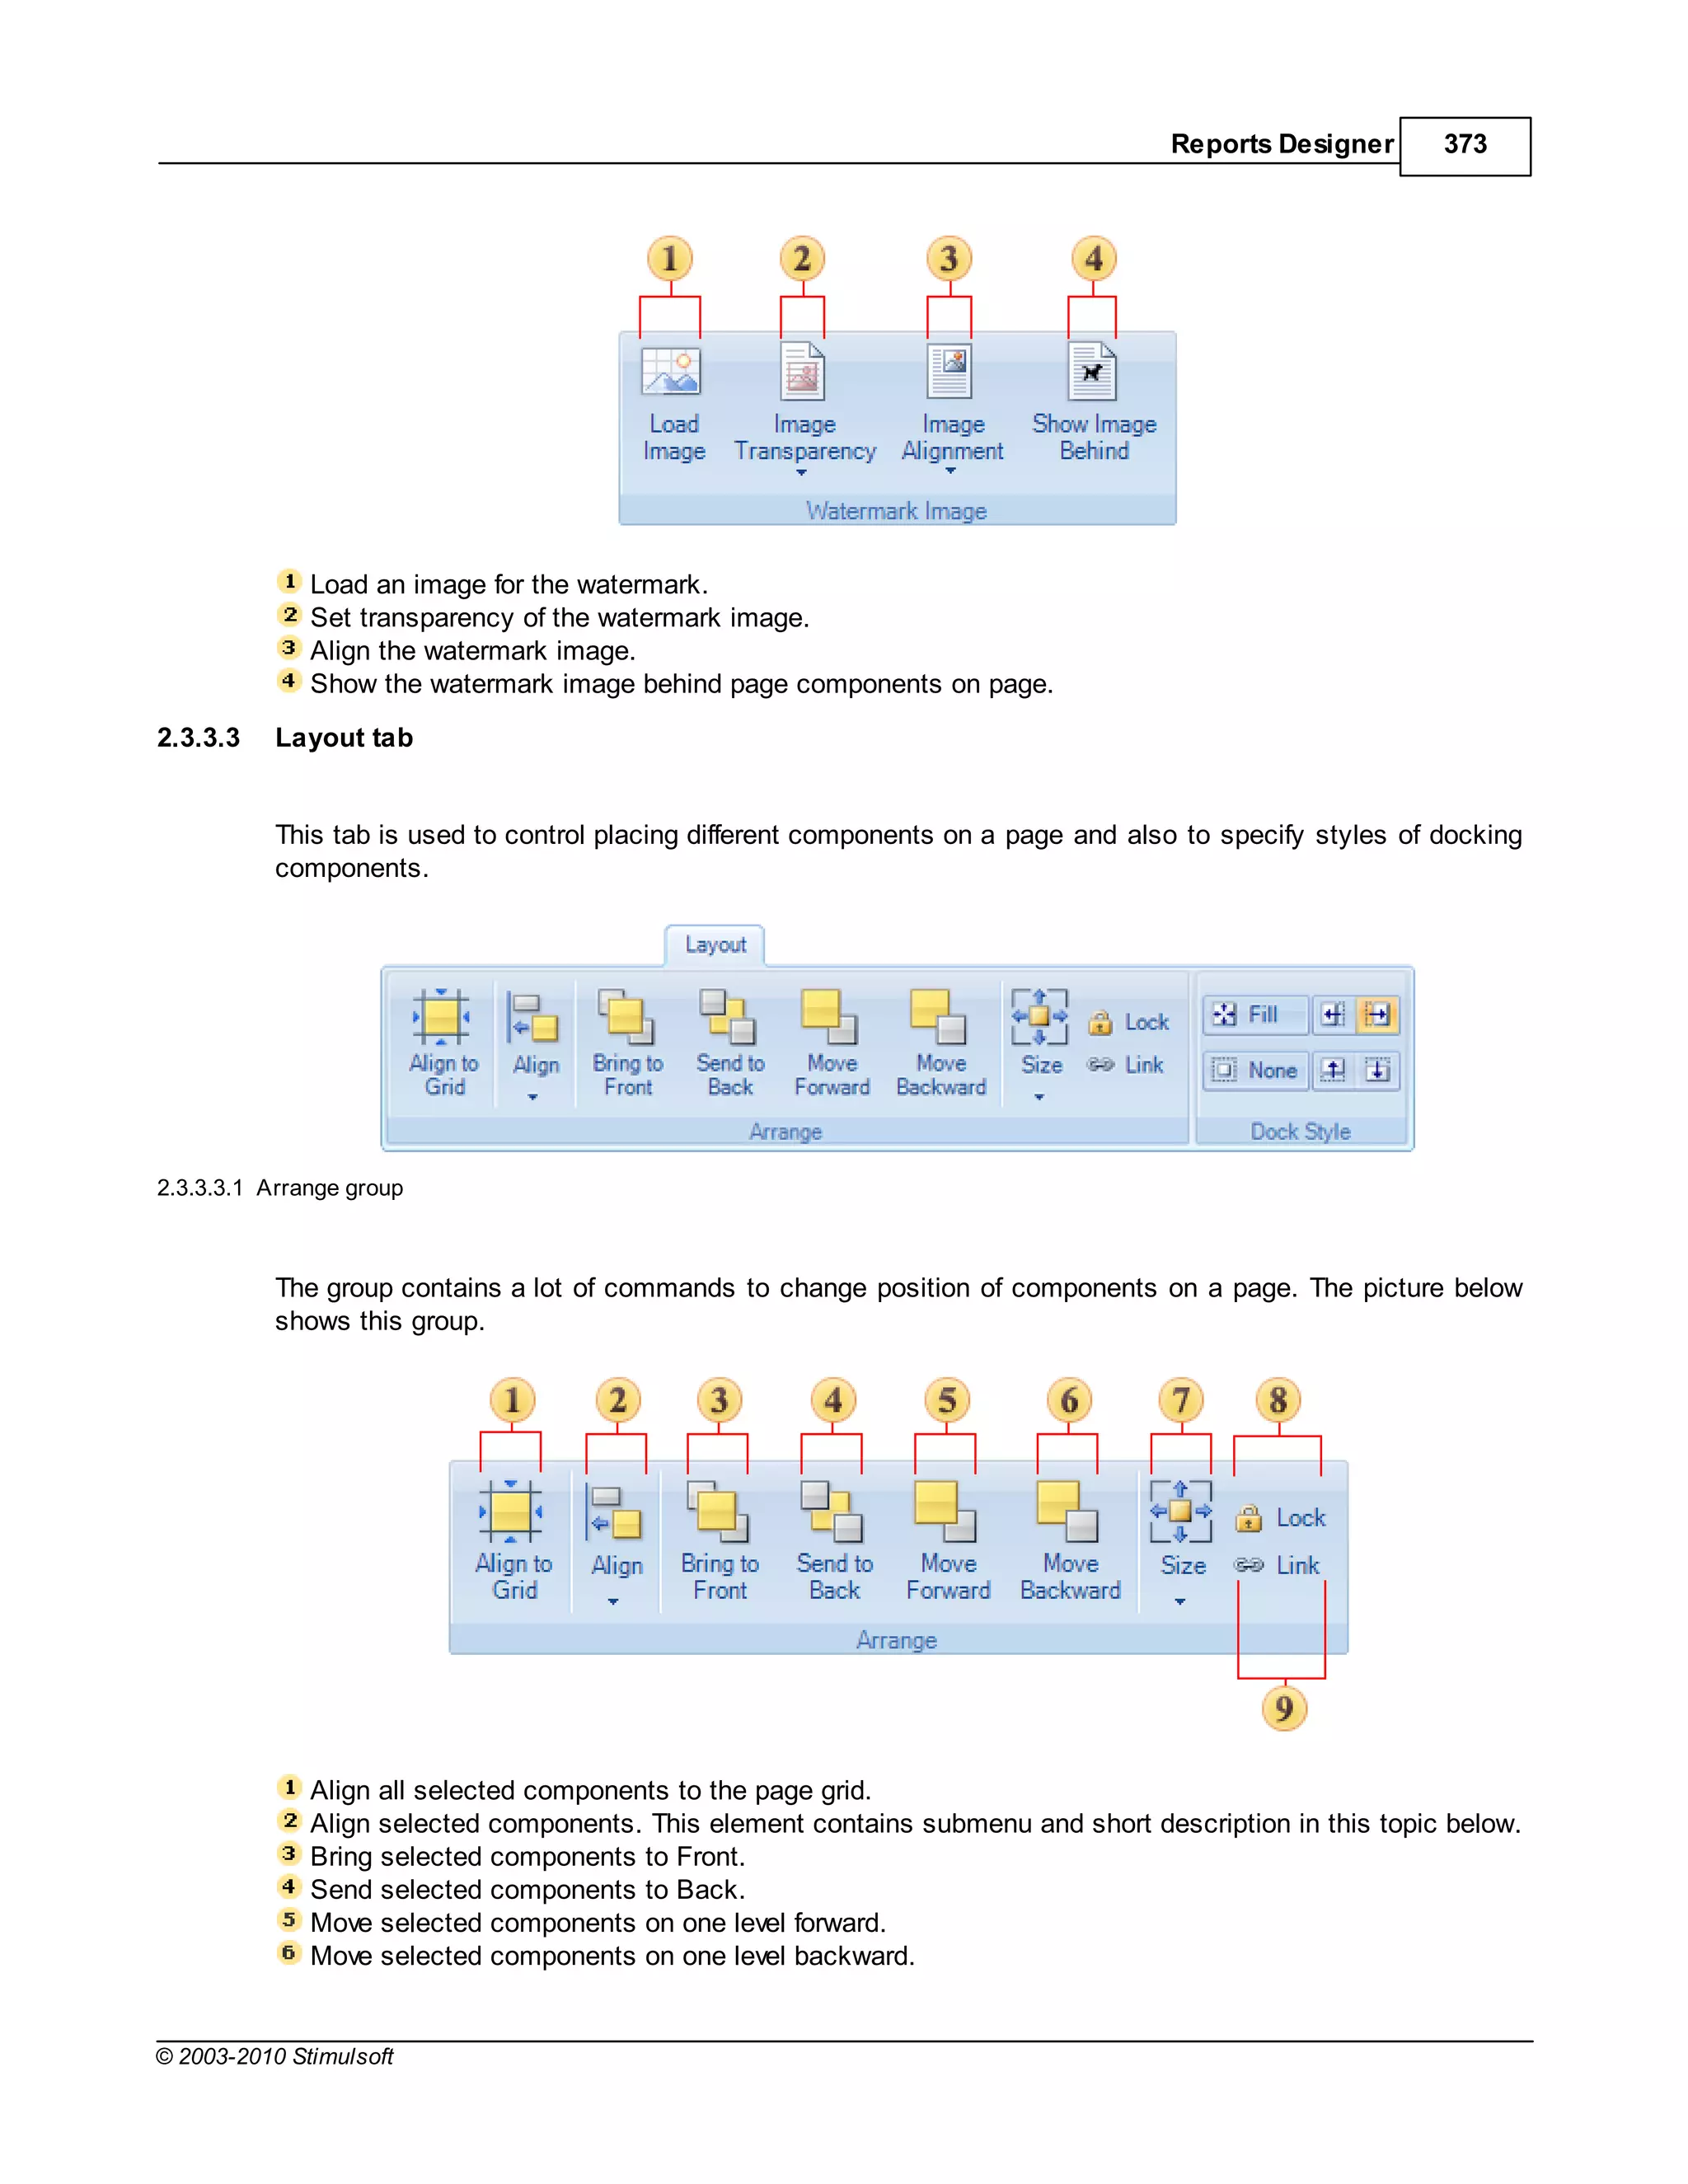
![Report Internals 17
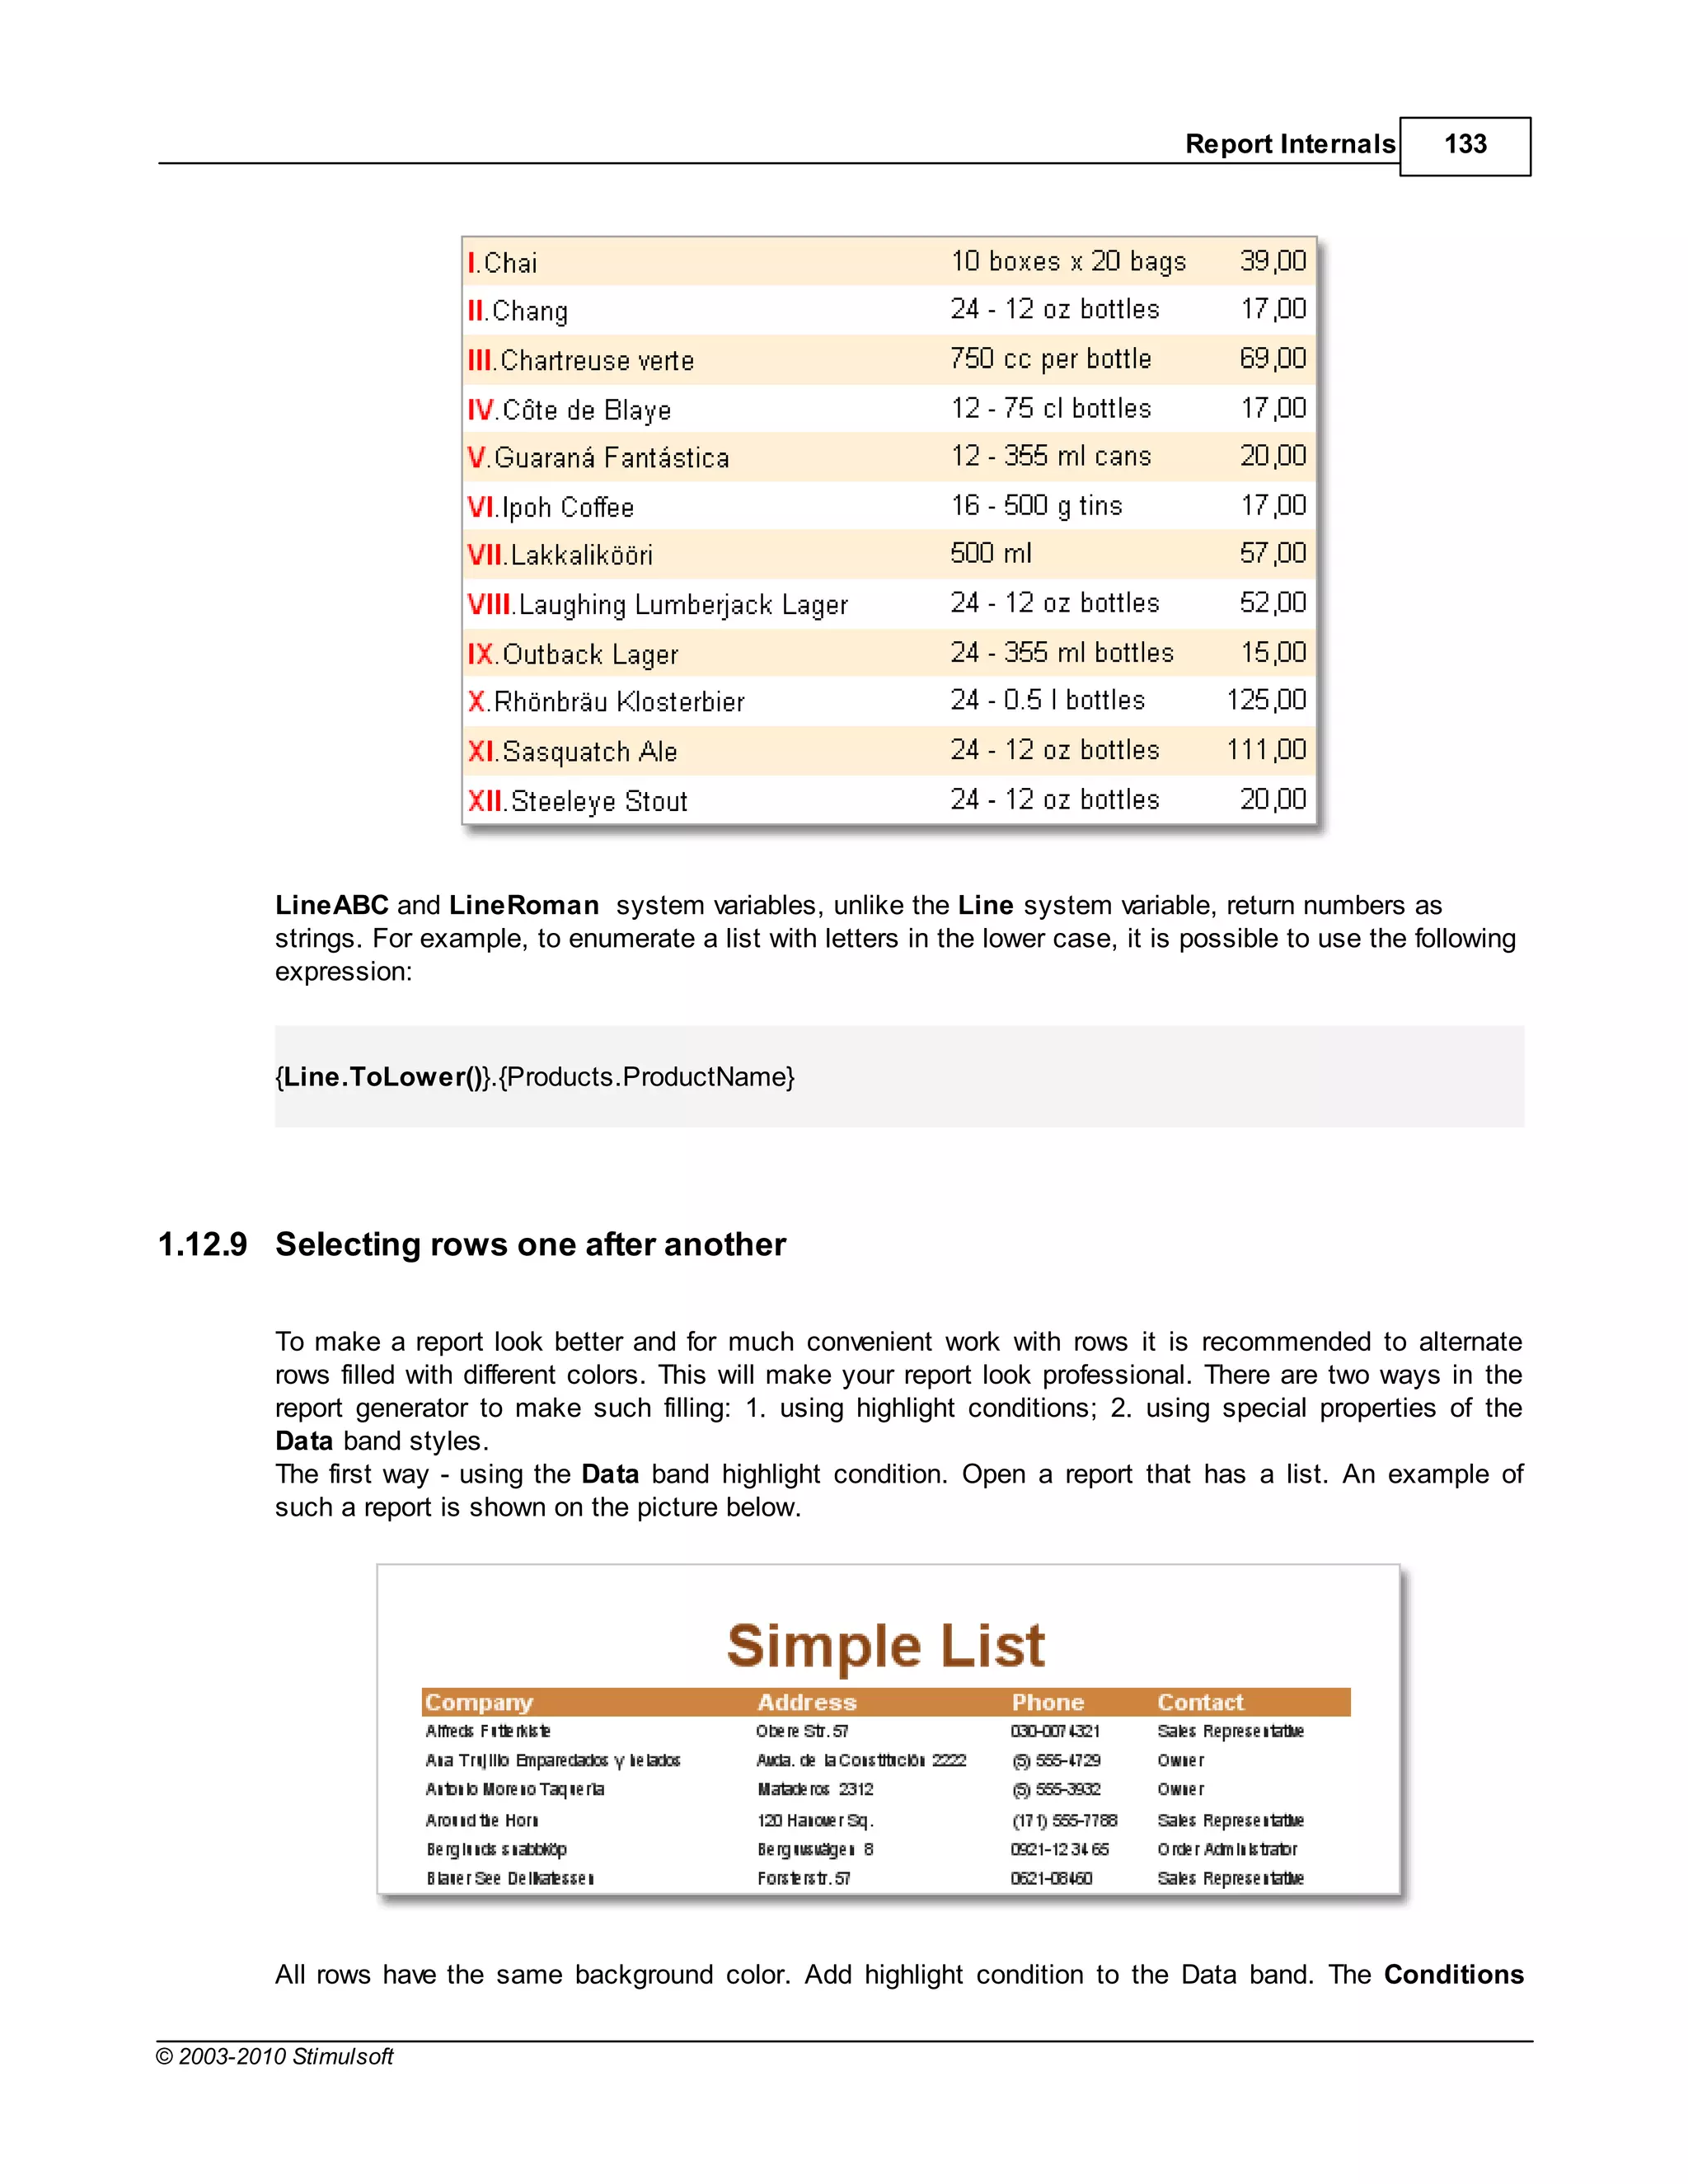
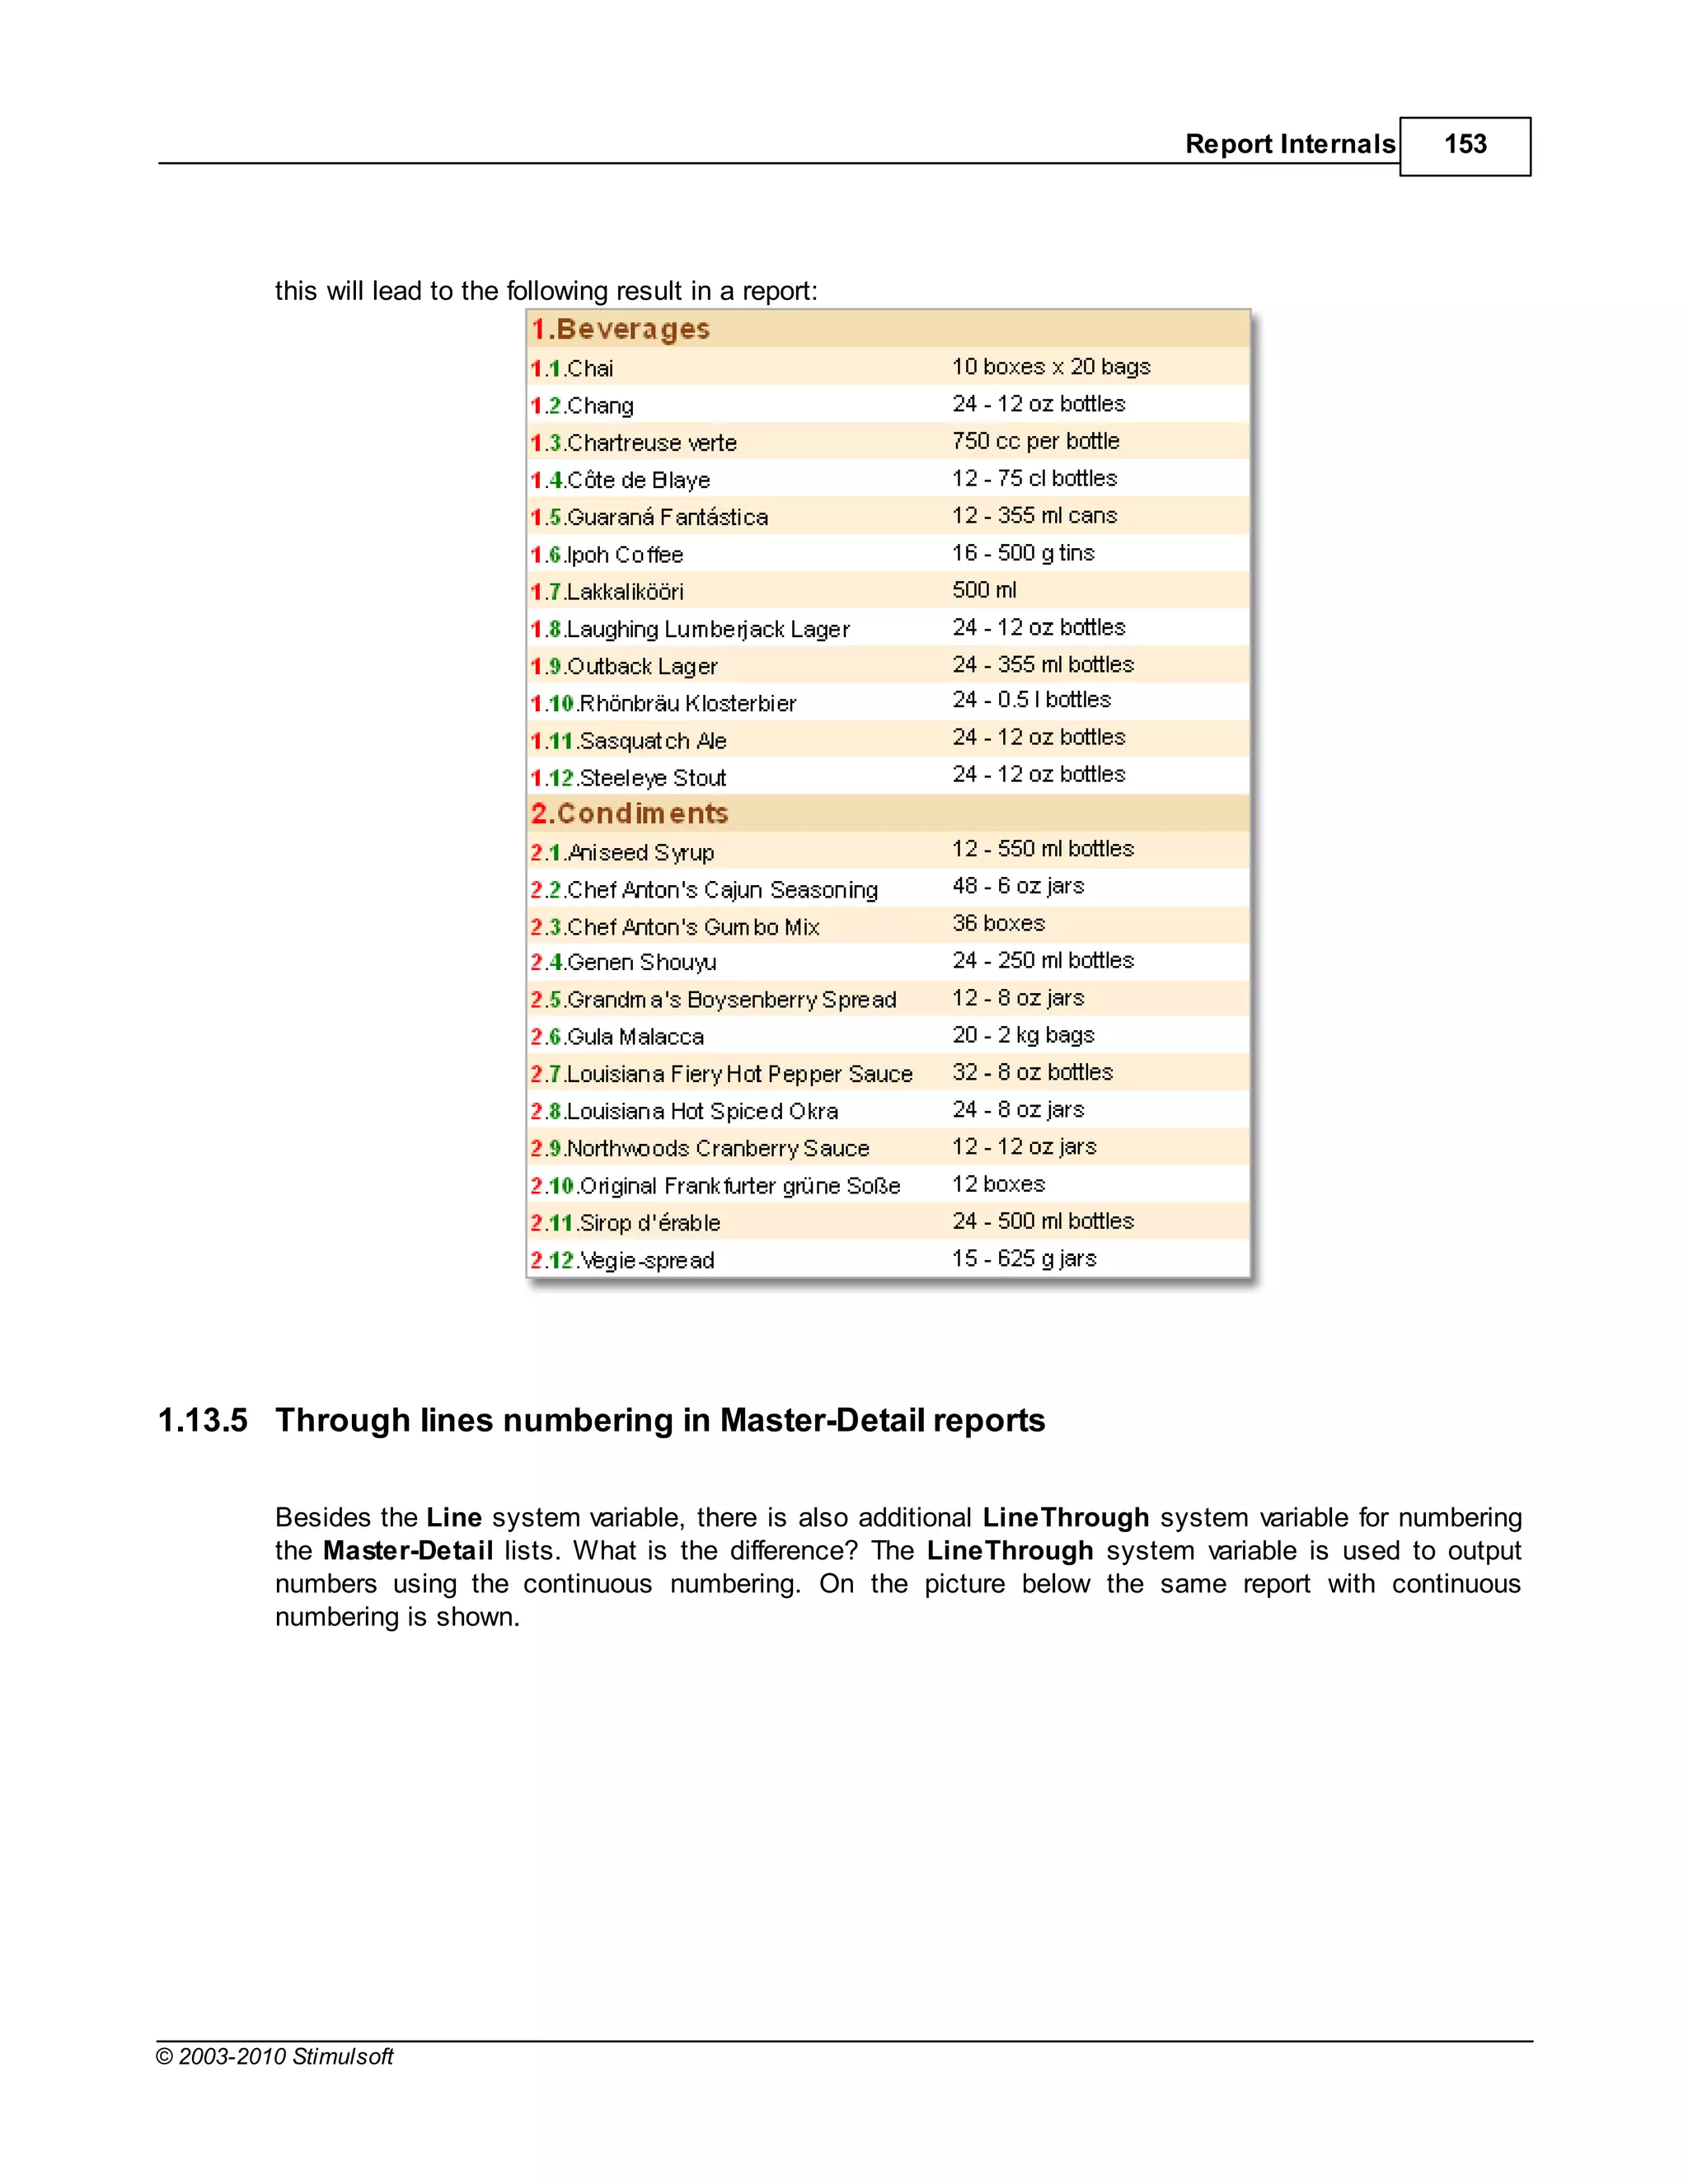
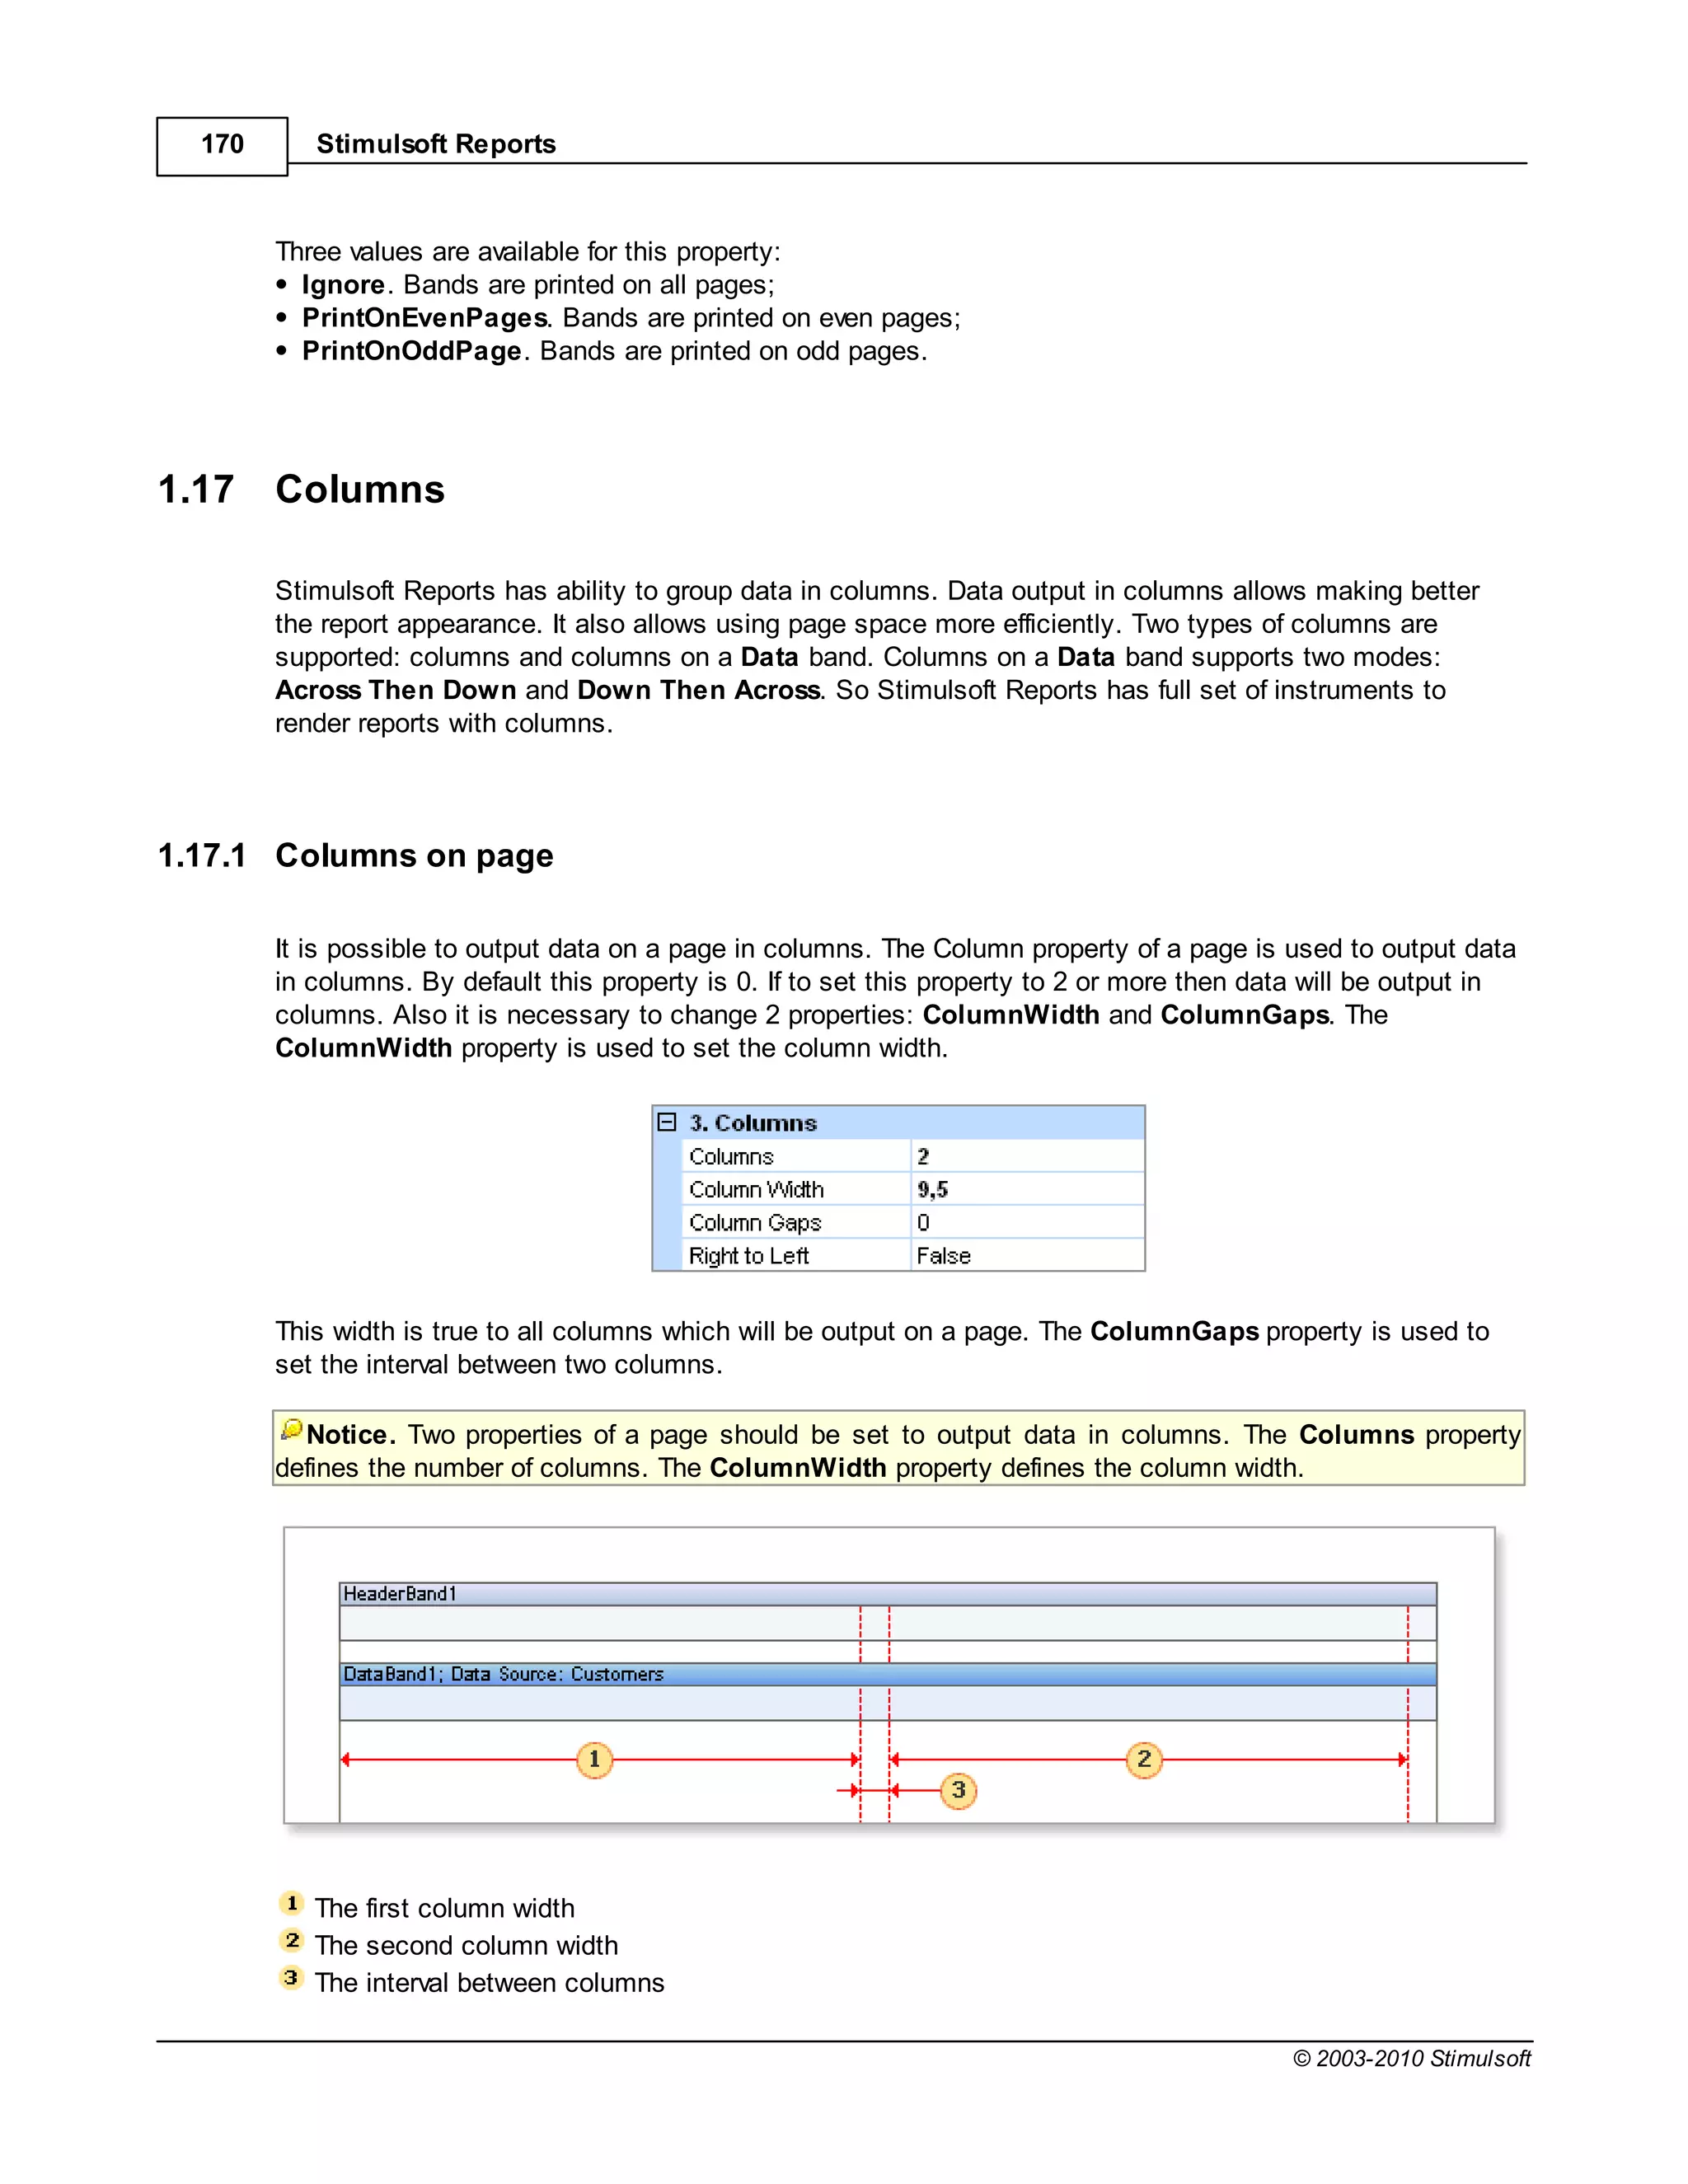
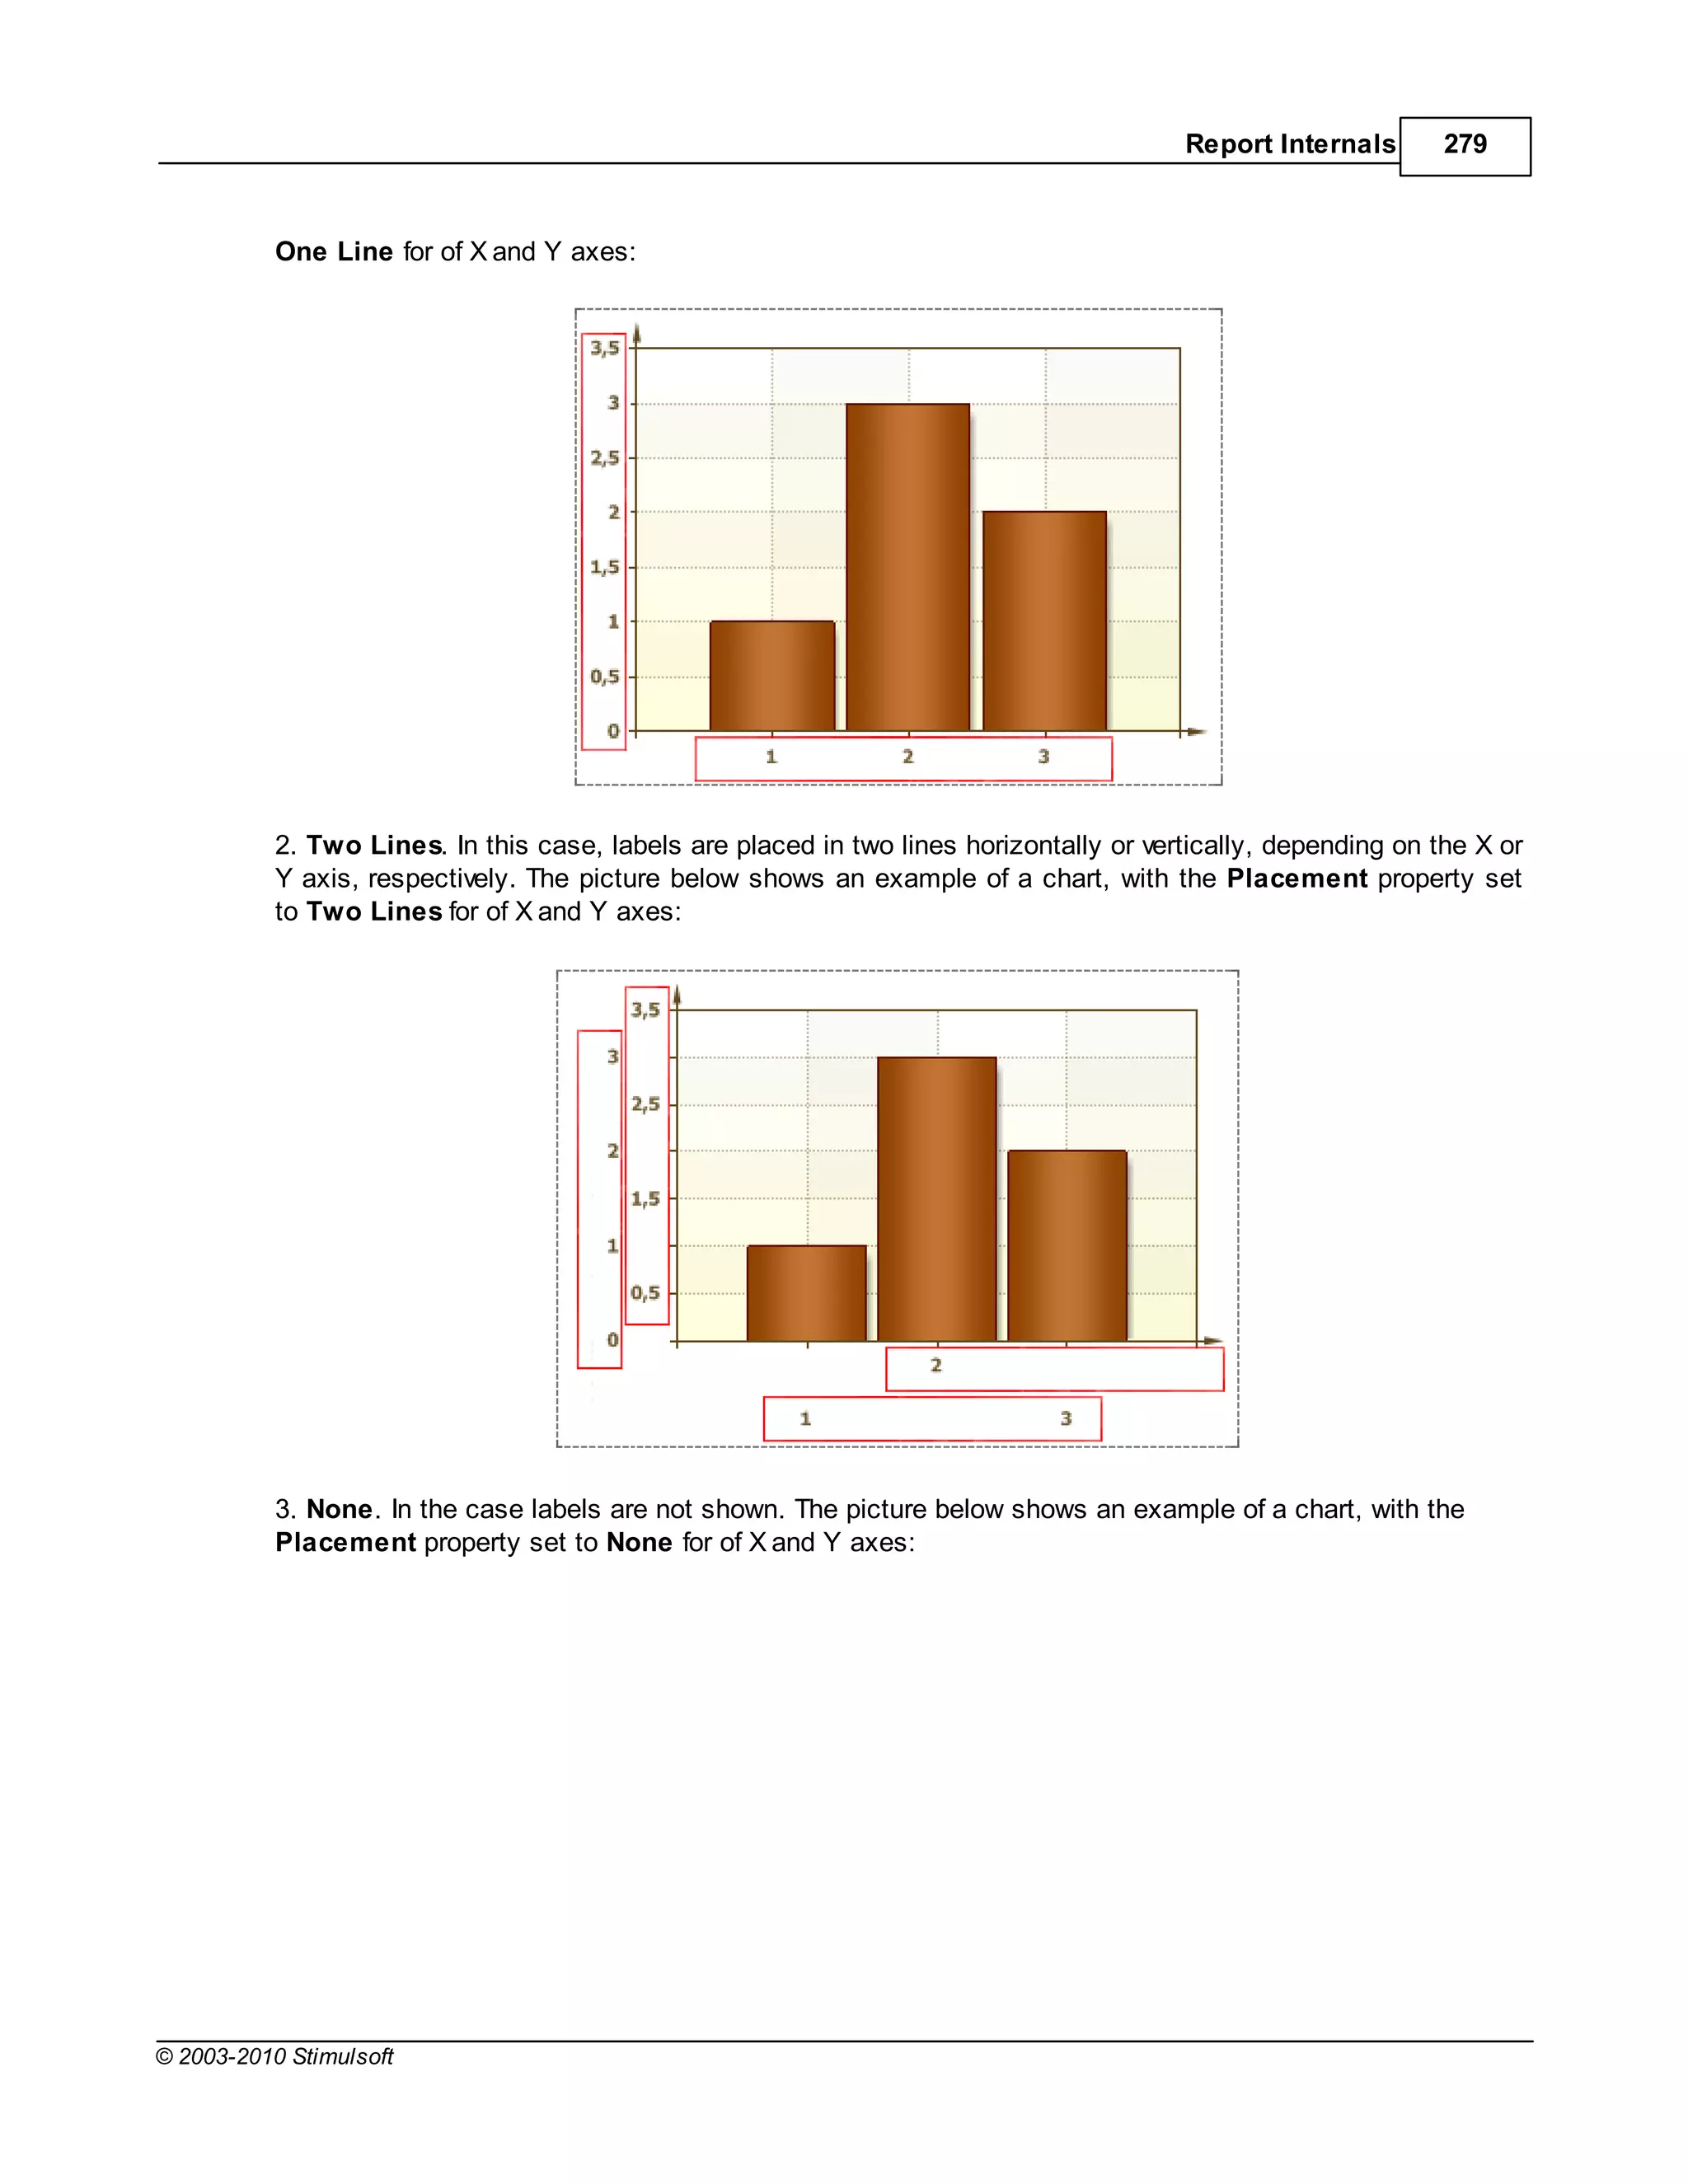
if you enter the following expression:
{OrderDetails.ParentProducts.ParentCategories.CategoryName}
then after calculation the result appearing in the report will still be the name of a category for a product
butthe value of the CategoryName field has been obtained using relationships and bypassing the
OrderDetails data source to get to the Categories data source. No direct call to the Categories data
source has been used
Important: If the report language is C# then names are case sensitive. If the report language is VB.
Net then names are not case sensitive.
It should be remembered that all the values in data sources are typed. This means that all data items
are dynamically converted to the type that is specified in the options column which helps to accelerate
the development of reports. However, if you need to get data from a column without conversion you will
need to specify the data source directly. For example, in C#:
{Products["ProductName"]}
This expression will return data from the Products data source "as is" without conversion. The example
below shows the same expression for VB.Net:
{Products.Item("ProductName")}
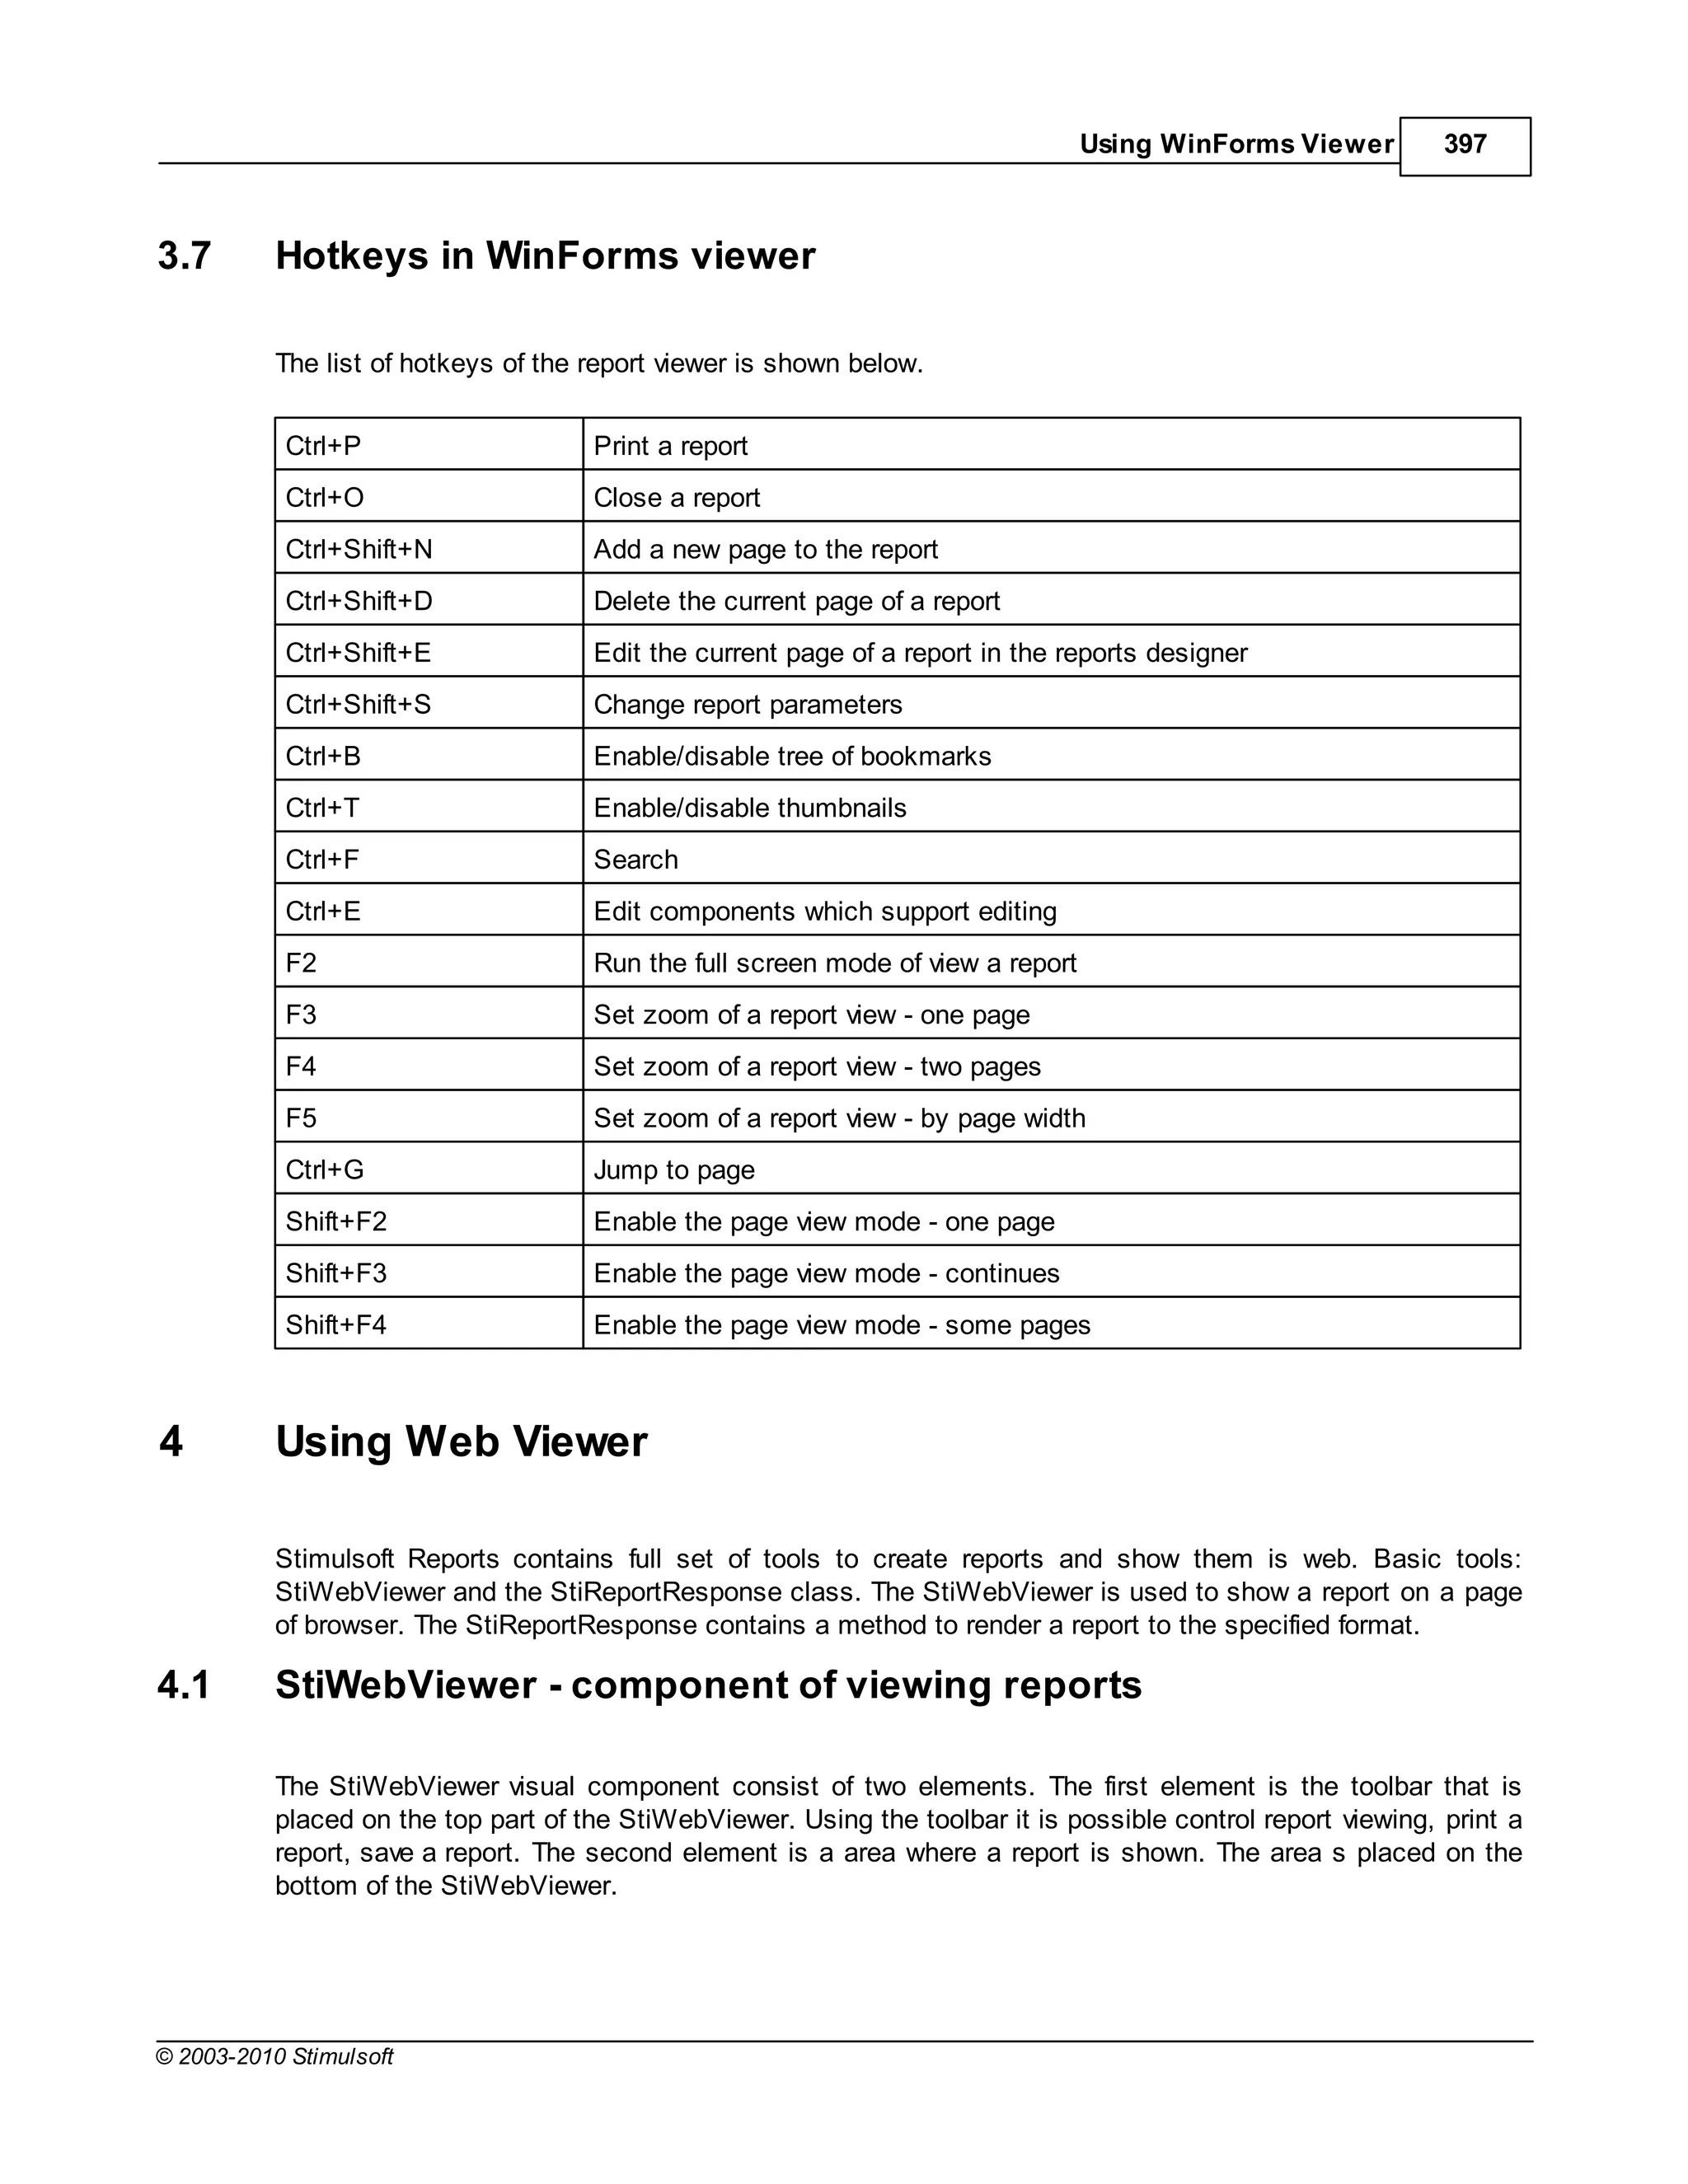
1.1.7 Using Component Properties
When creating an expressions you can use the properties of any component contained within a report.
Syntax
The syntax is the same whether the report language is C# or VB.NET. You simply enterthe name of the
component and the property name separated by a decimal point or full stop character, surrounded by
curly braces:
{Component.Property}
Important: If the report language is C# then names are case sensitive. If the report language is VB.
NET then names are not case sensitive.
For example, to display the name of a component called MyComponent you would enter the expression:
{MyComponent.Name}
If you wish to access a calculated value from within a component you should use the property that
contains the result you require. For example, if the component has ahyperlink value which calculates a
hyperlink from the other component properties you would access it by entering the expression:
© 2003-2010 Stimulsoft](https://image.slidesharecdn.com/usermanual-100720093903-phpapp01/75/User-manual-17-2048.jpg)
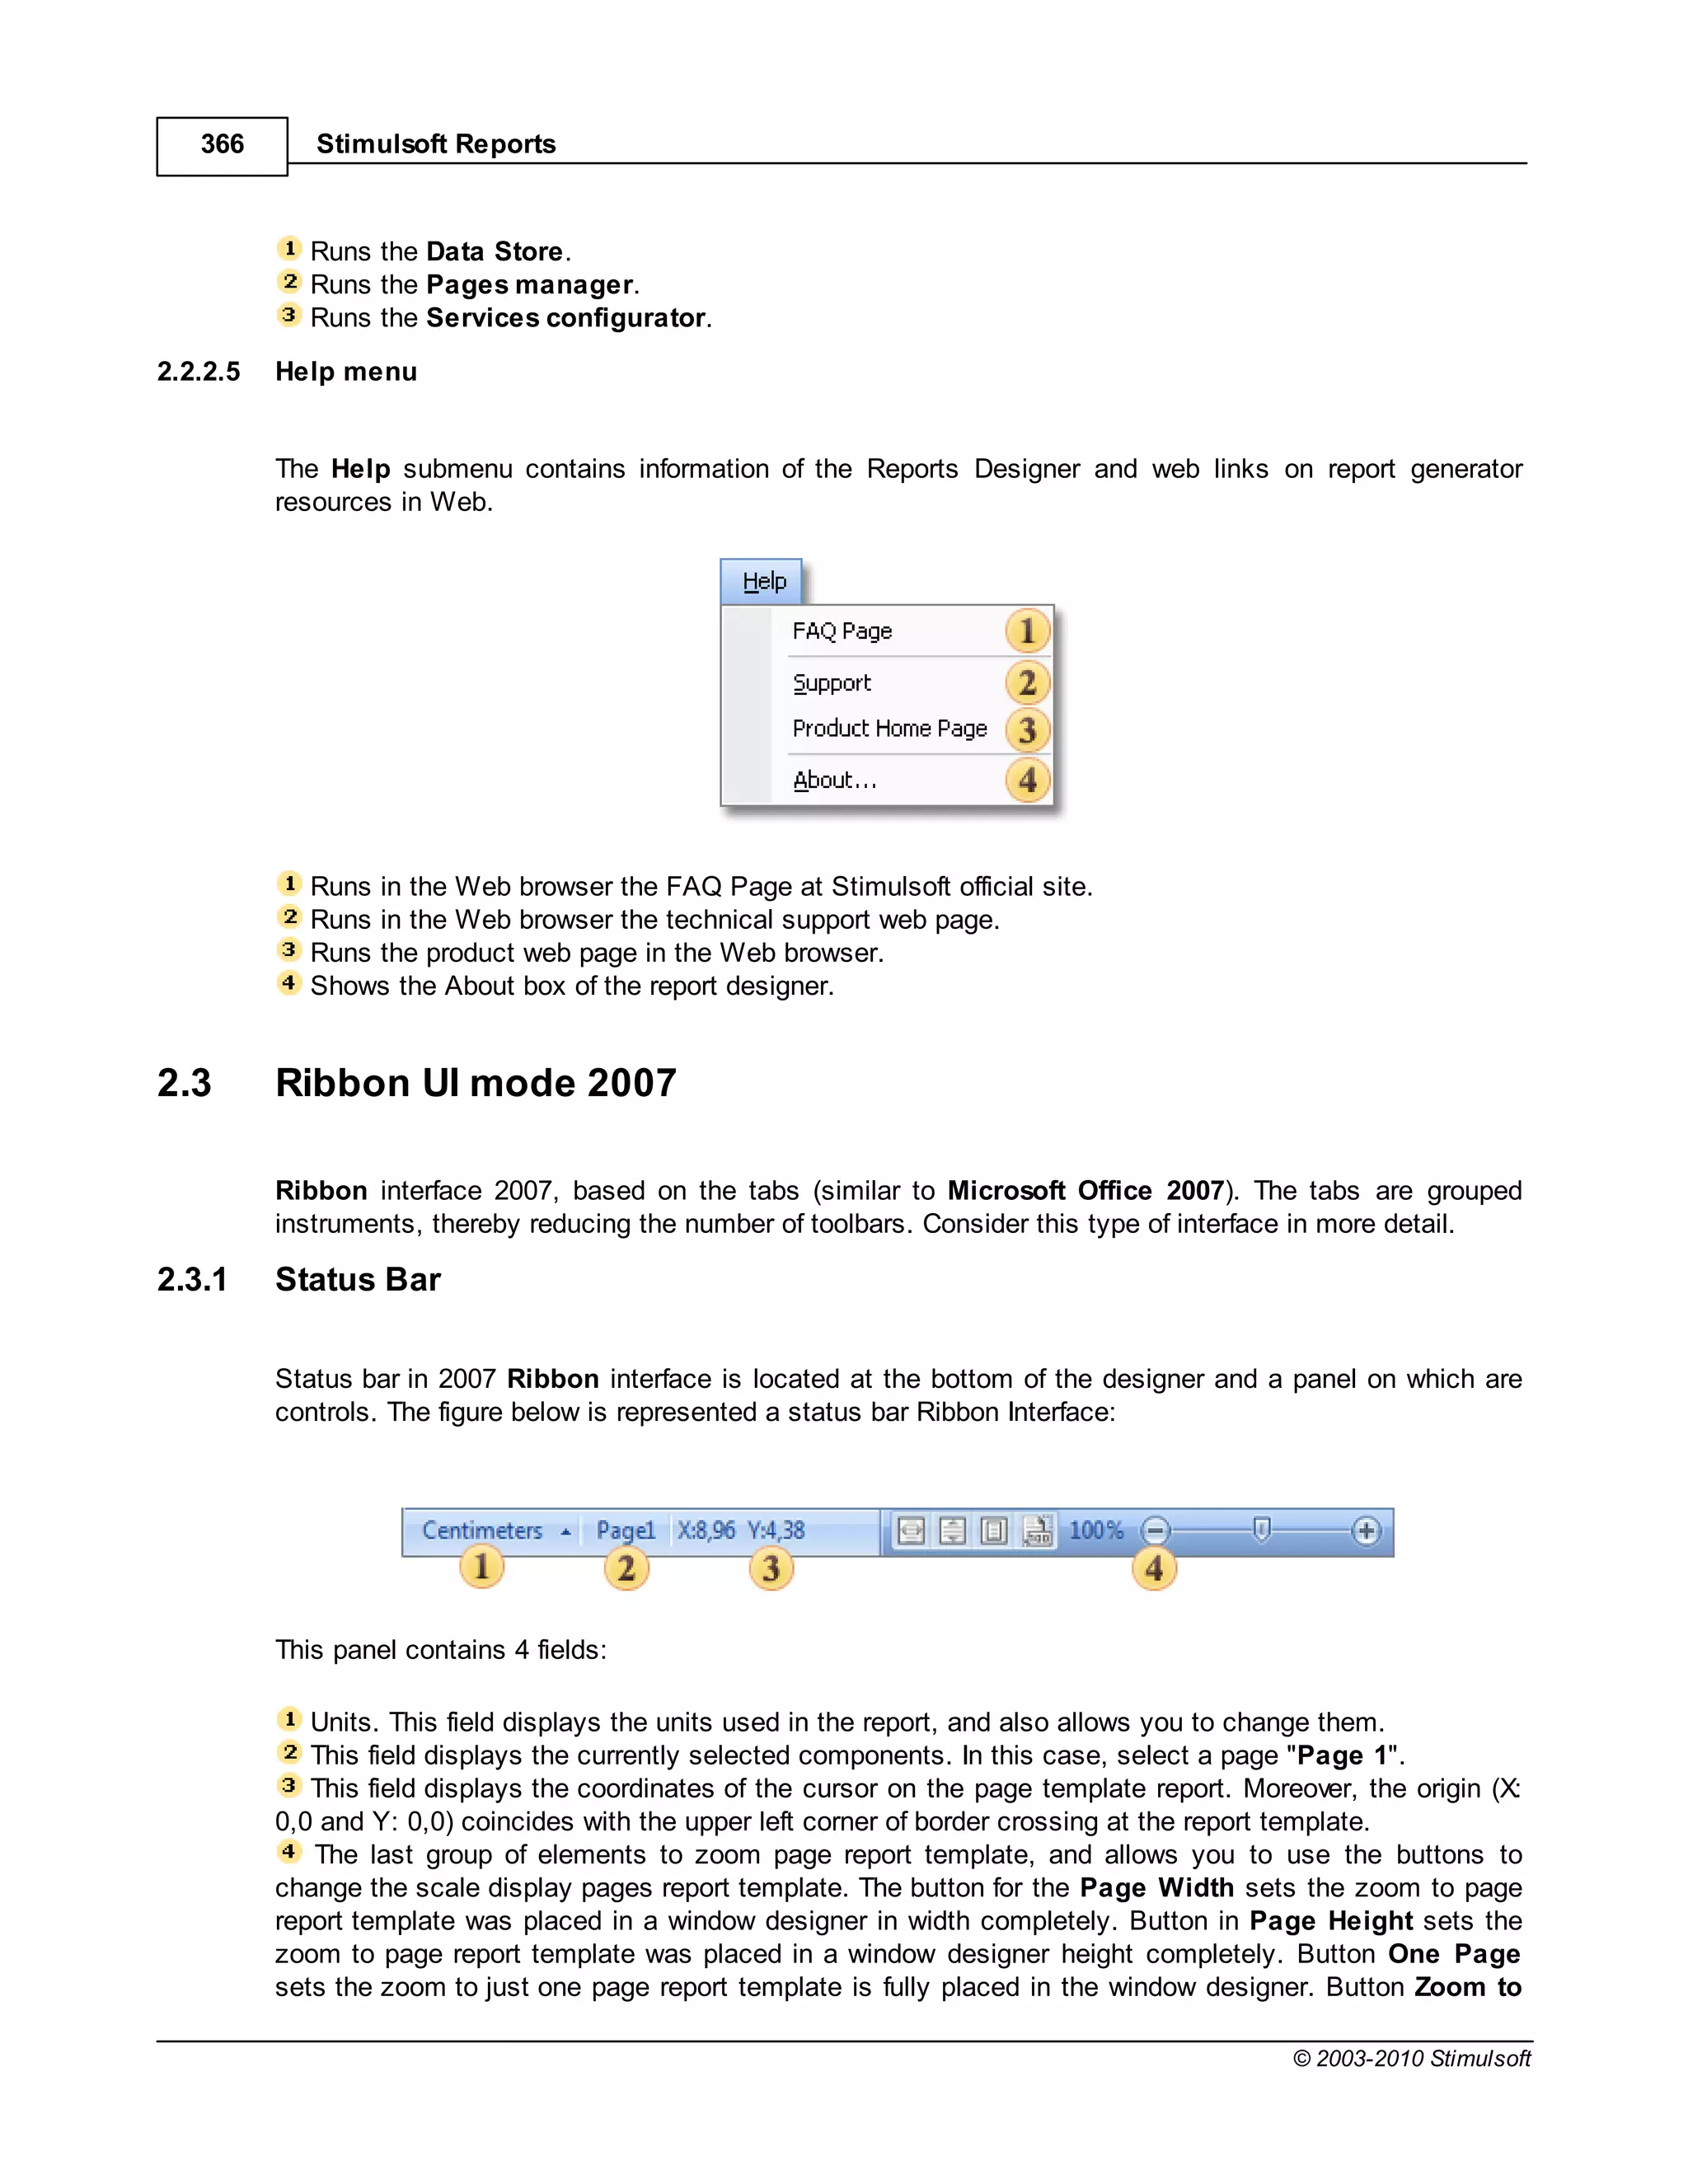
![20 Stimulsoft Reports
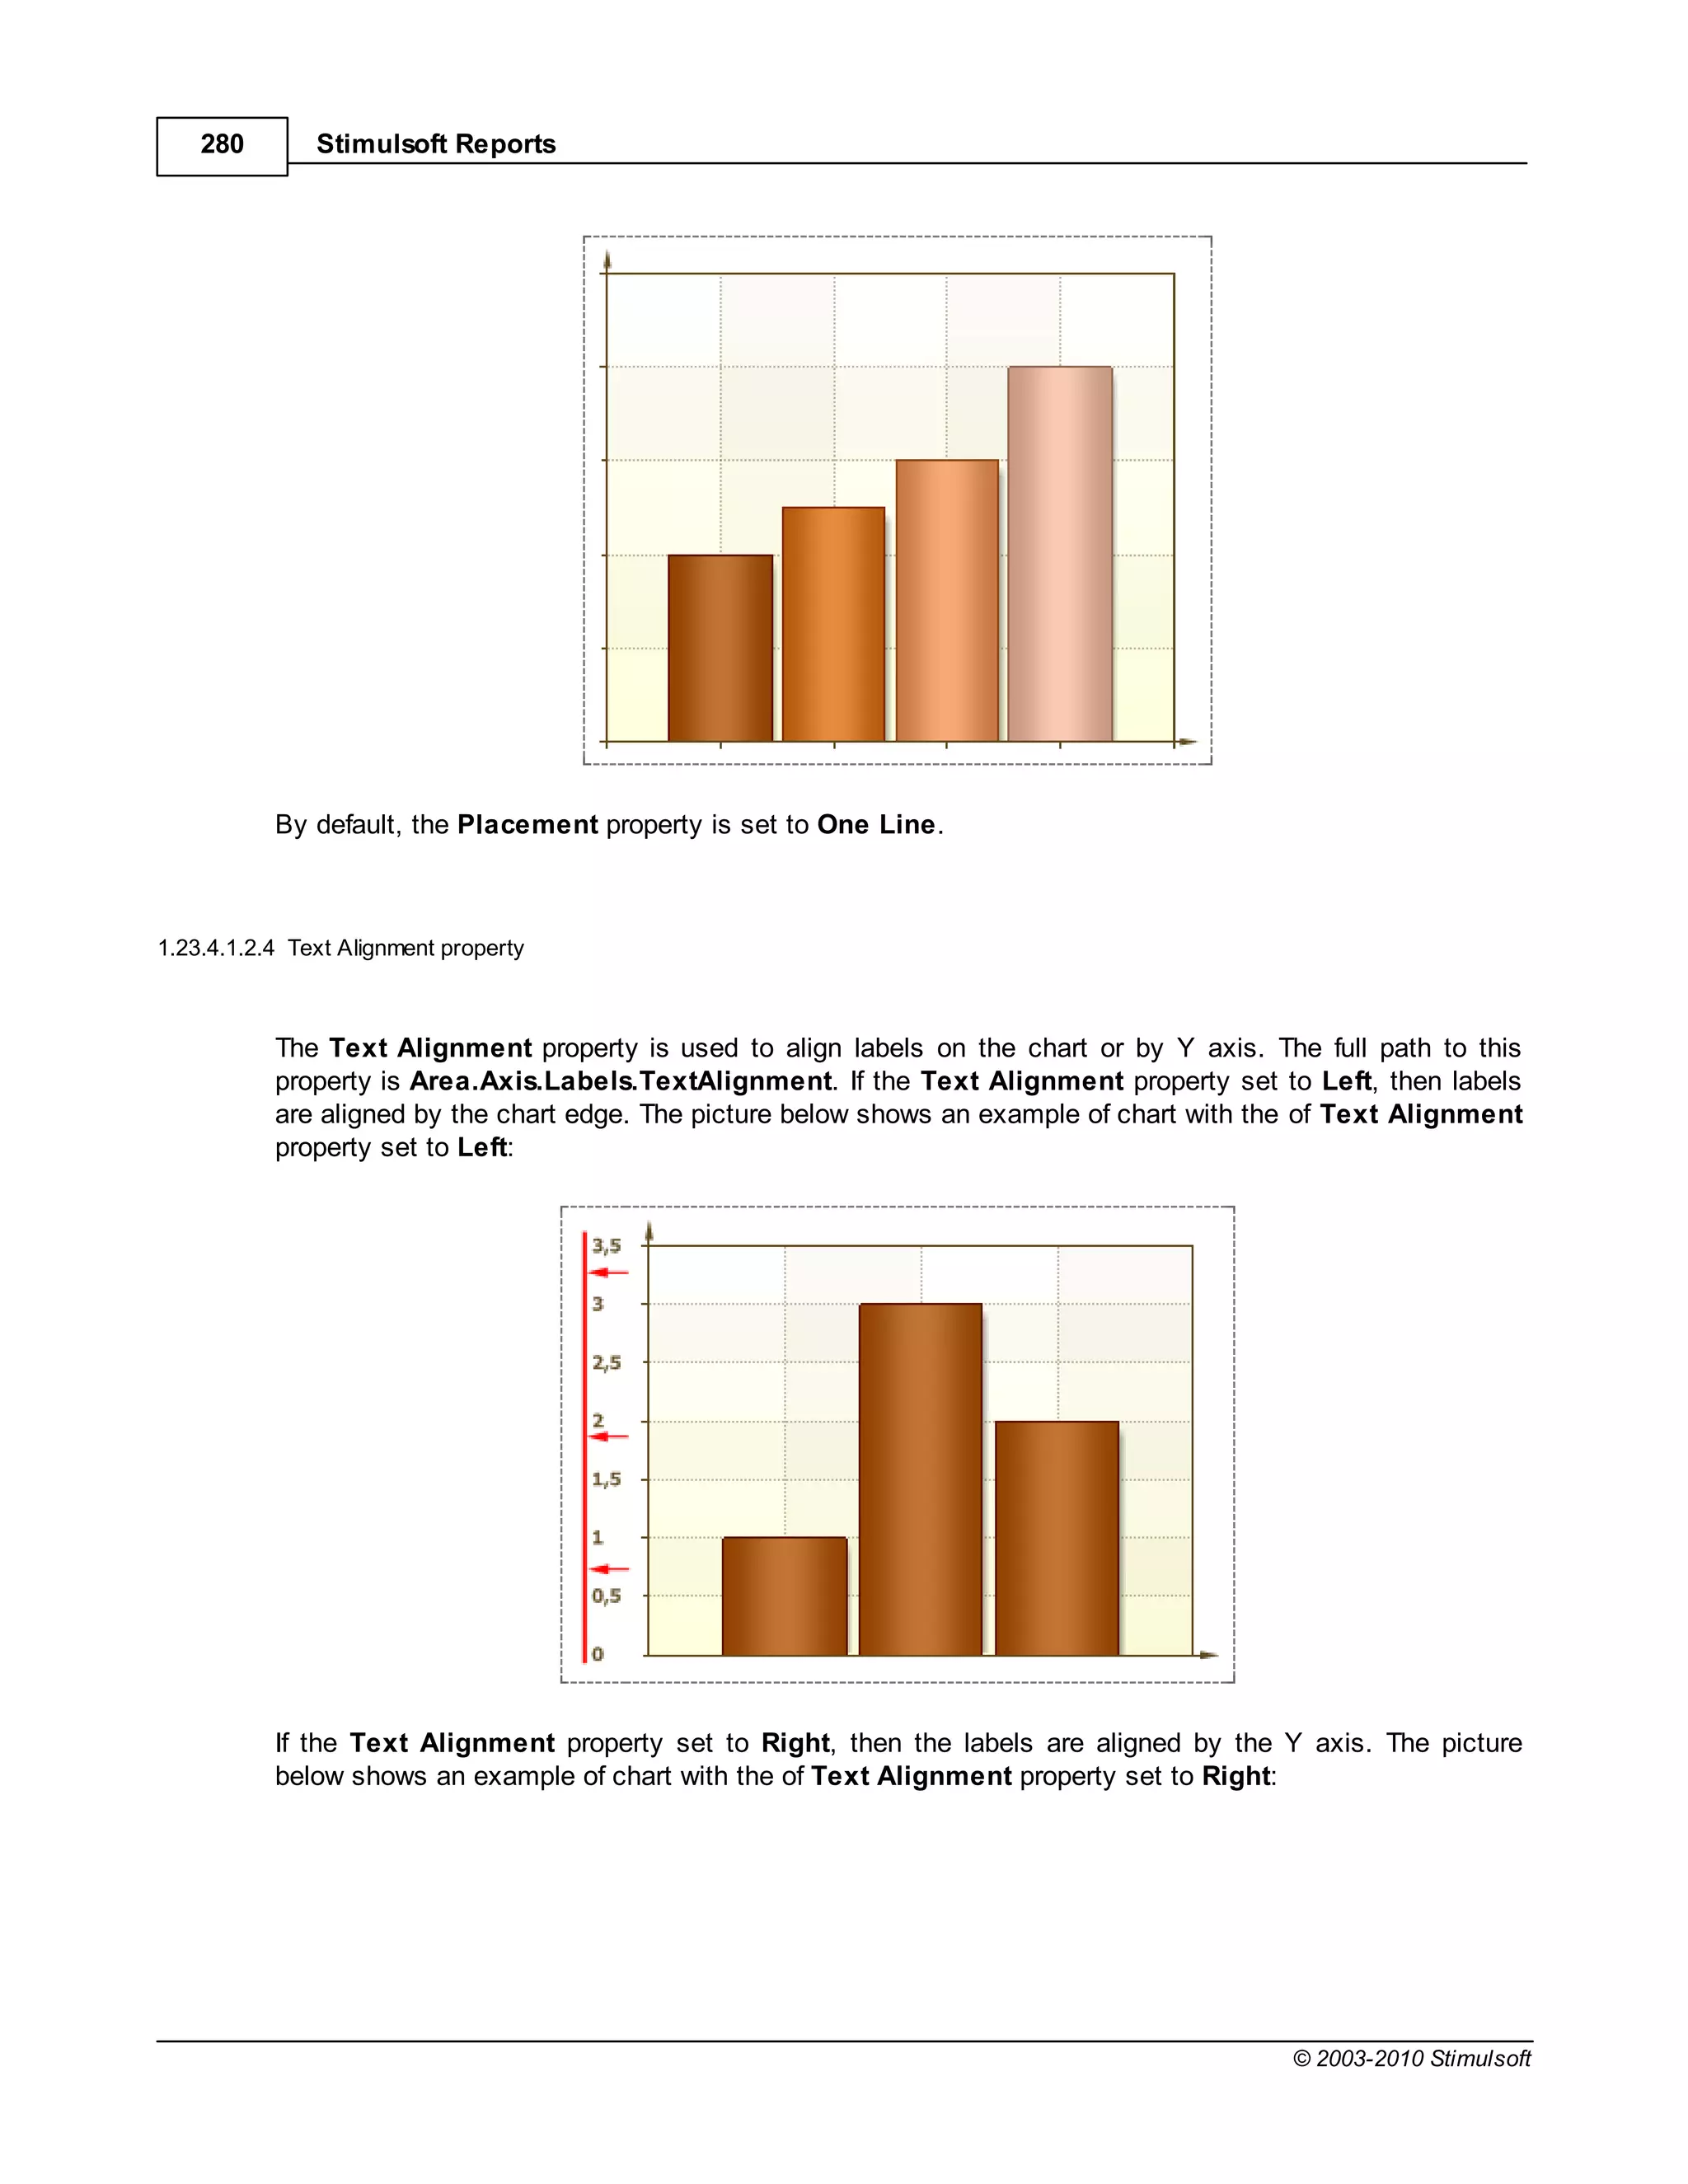
To use the variable by name you would create an expression like this:
{MyVariable}
To use the variable by alias you would create an expression like this:
{[my best variable]}
Syntax - Variables
If you use spaces, punctuation, or characters within an alias that are not permitted under C# or VB.Net
then you MUST enclose the string representation of the alias in square brackets []. If no such characters
are used then the square brackets are optional.
For example, if the alias was"MyBestVariable"then the expressioncan be written without brackets:
{MyBestVariable}
Otherwise you MUST enclose the variable in square brackets. Examples of valid alias usage:
{Variable1}
{VariableAndValue}
{[Variable and Value]}
{[Variable and Value]}
{[Variable&Values]}
{[Variable-First]}
Just for extra clarification, examples of some INVALID alias usage
{Variable and Value}// spaces in the name cause this to fail
{Variable&Values}// reserved character causes this to fail
Syntax - Data
The same rule is used and when creating the names of data sources and columns. But there is one
exception. When referring to the data column, only a part with incorrect characters for identifier should
be bracketed.For example:
{DataSource.[Data Column]}
{[Data-Source].DataColumn}
{[Data=Source].[Data=Column]}
© 2003-2010 Stimulsoft](https://image.slidesharecdn.com/usermanual-100720093903-phpapp01/75/User-manual-20-2048.jpg)
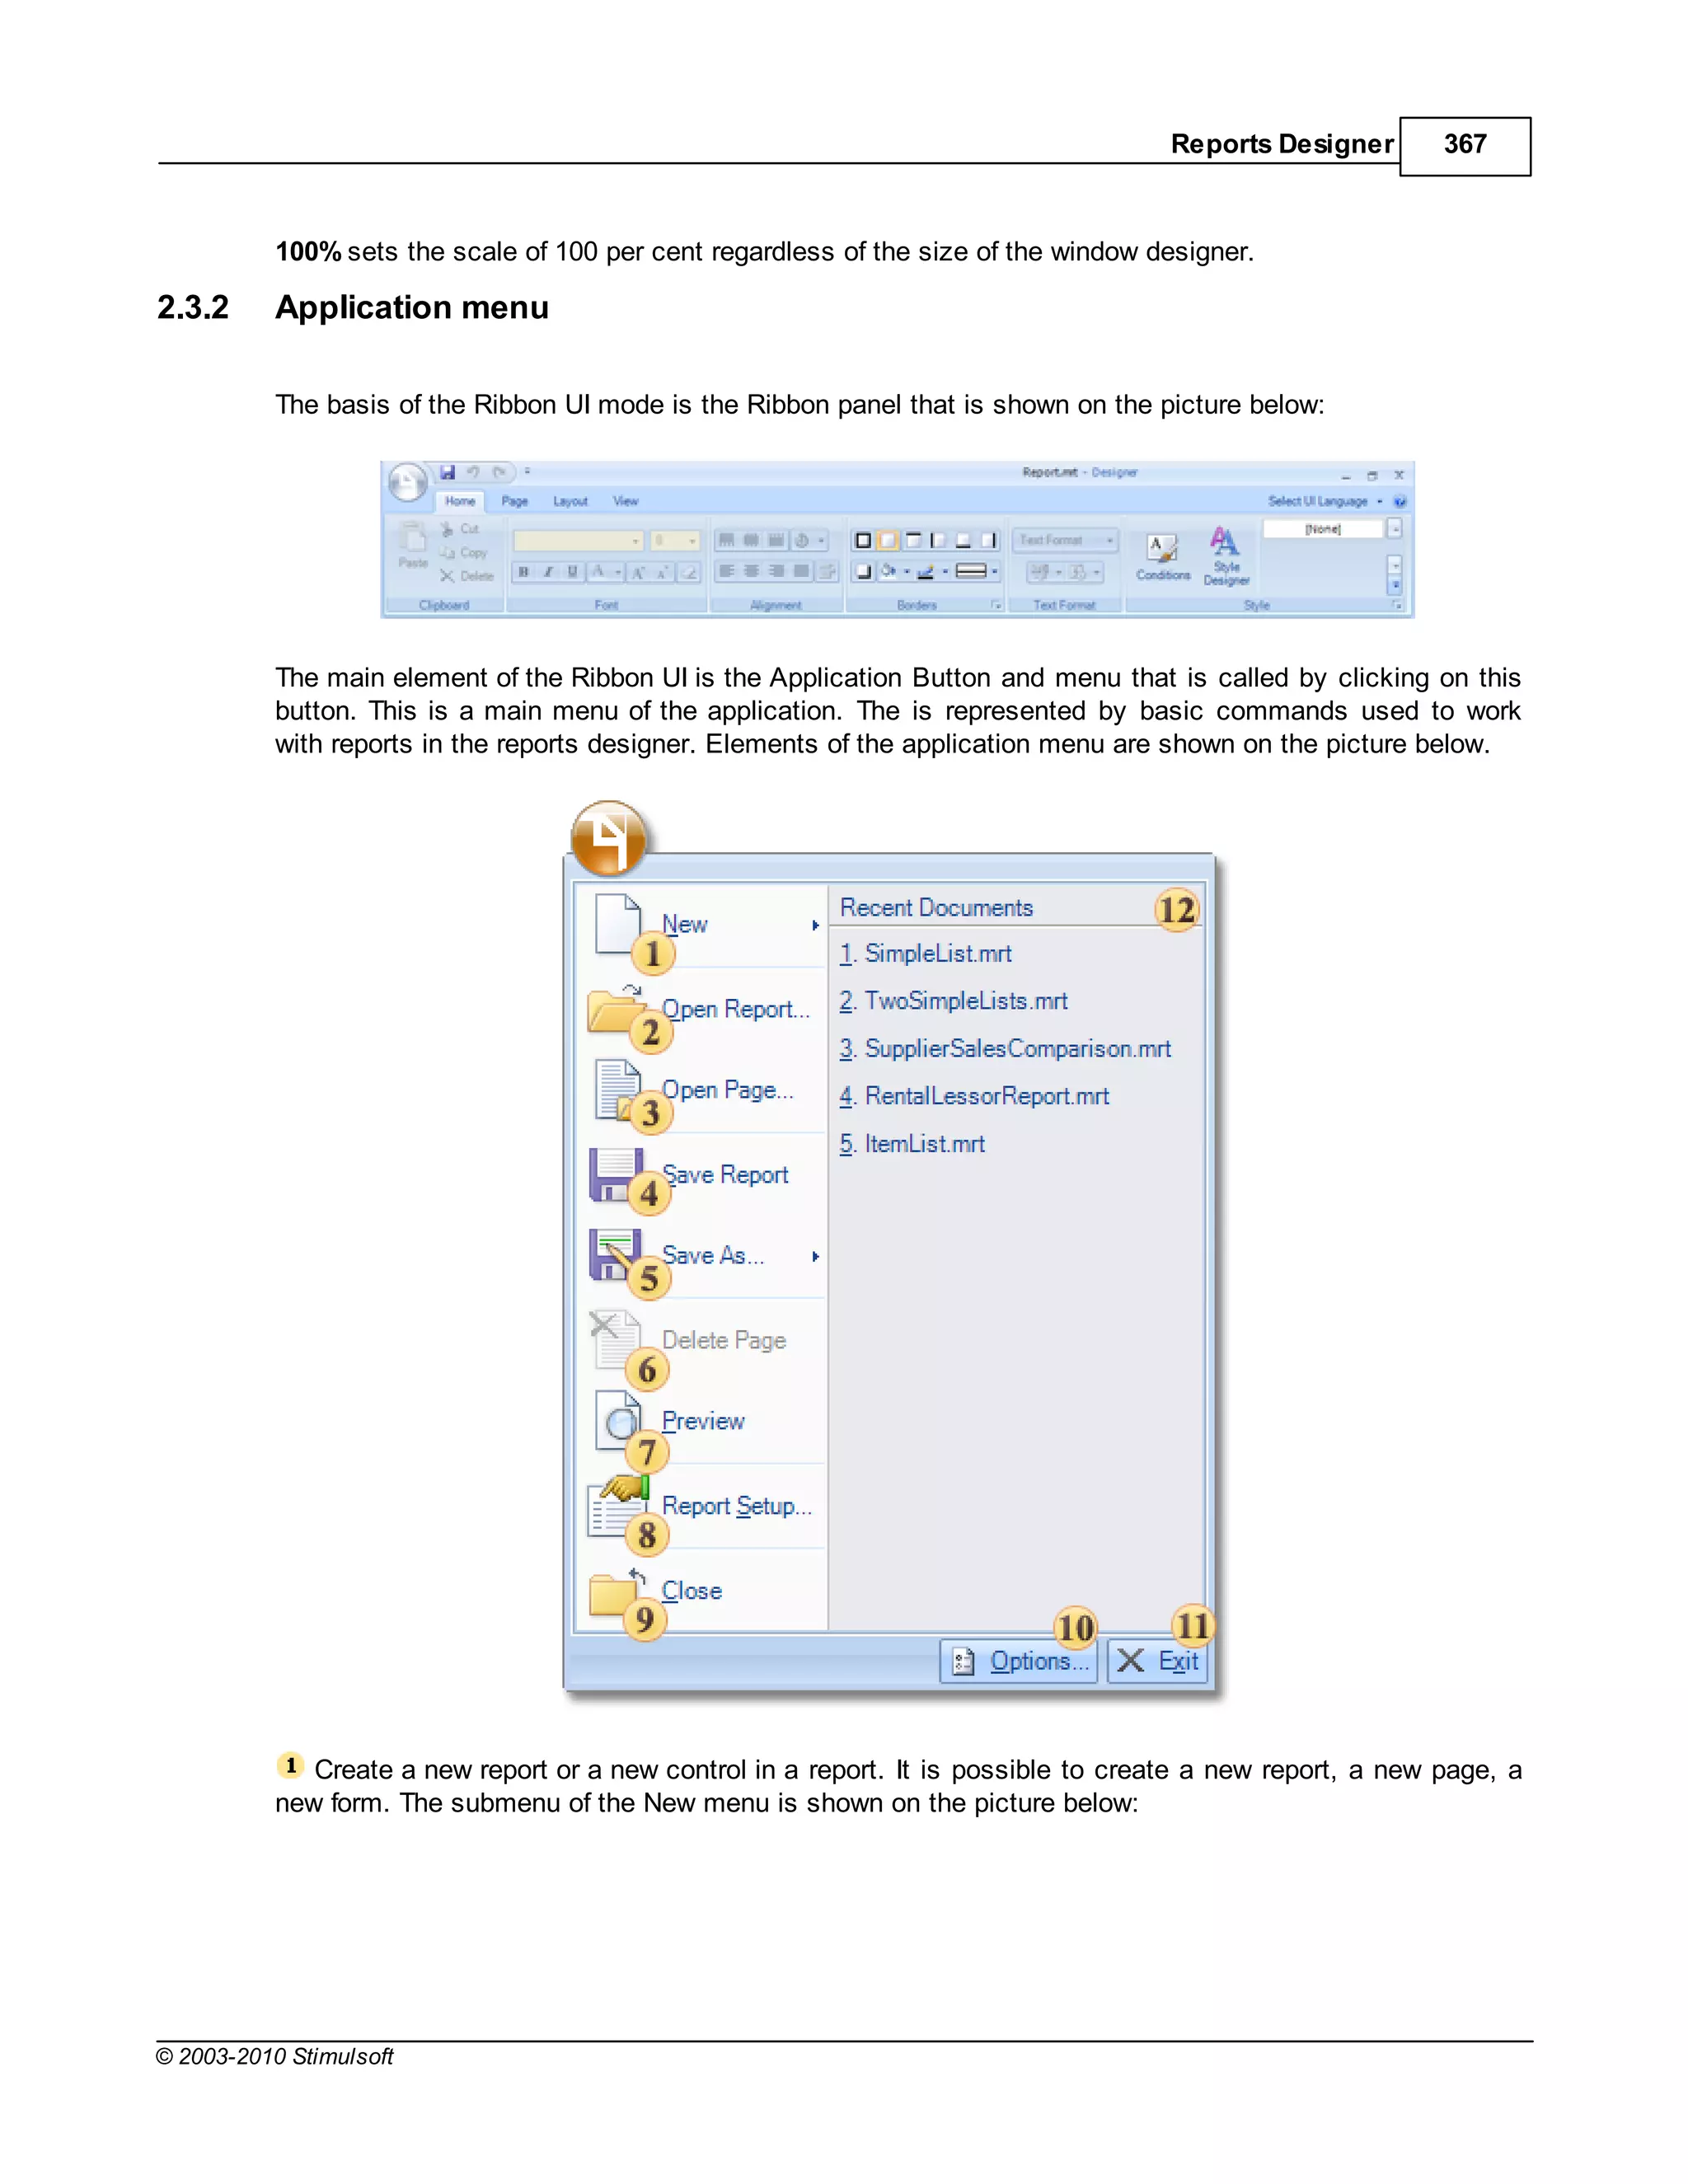
![34 Stimulsoft Reports
Style Types
There are three types of style:
1. Component
2. Cross-Tab
3. Chart
The Component style is designed to be used with all components except the Cross-Tab and Chart
components which have their own dedicated style types because they have style features not included
in other components.
The component style contains all the basic elements of the appearance of a component including Font,
Text Brush,Brush,Border,Horizontal Alignment, and Vertical Alignment. In addition to these
parameters, the simple style has parameter flags that determine whether certain style parameters can
be modified by the user at design time.
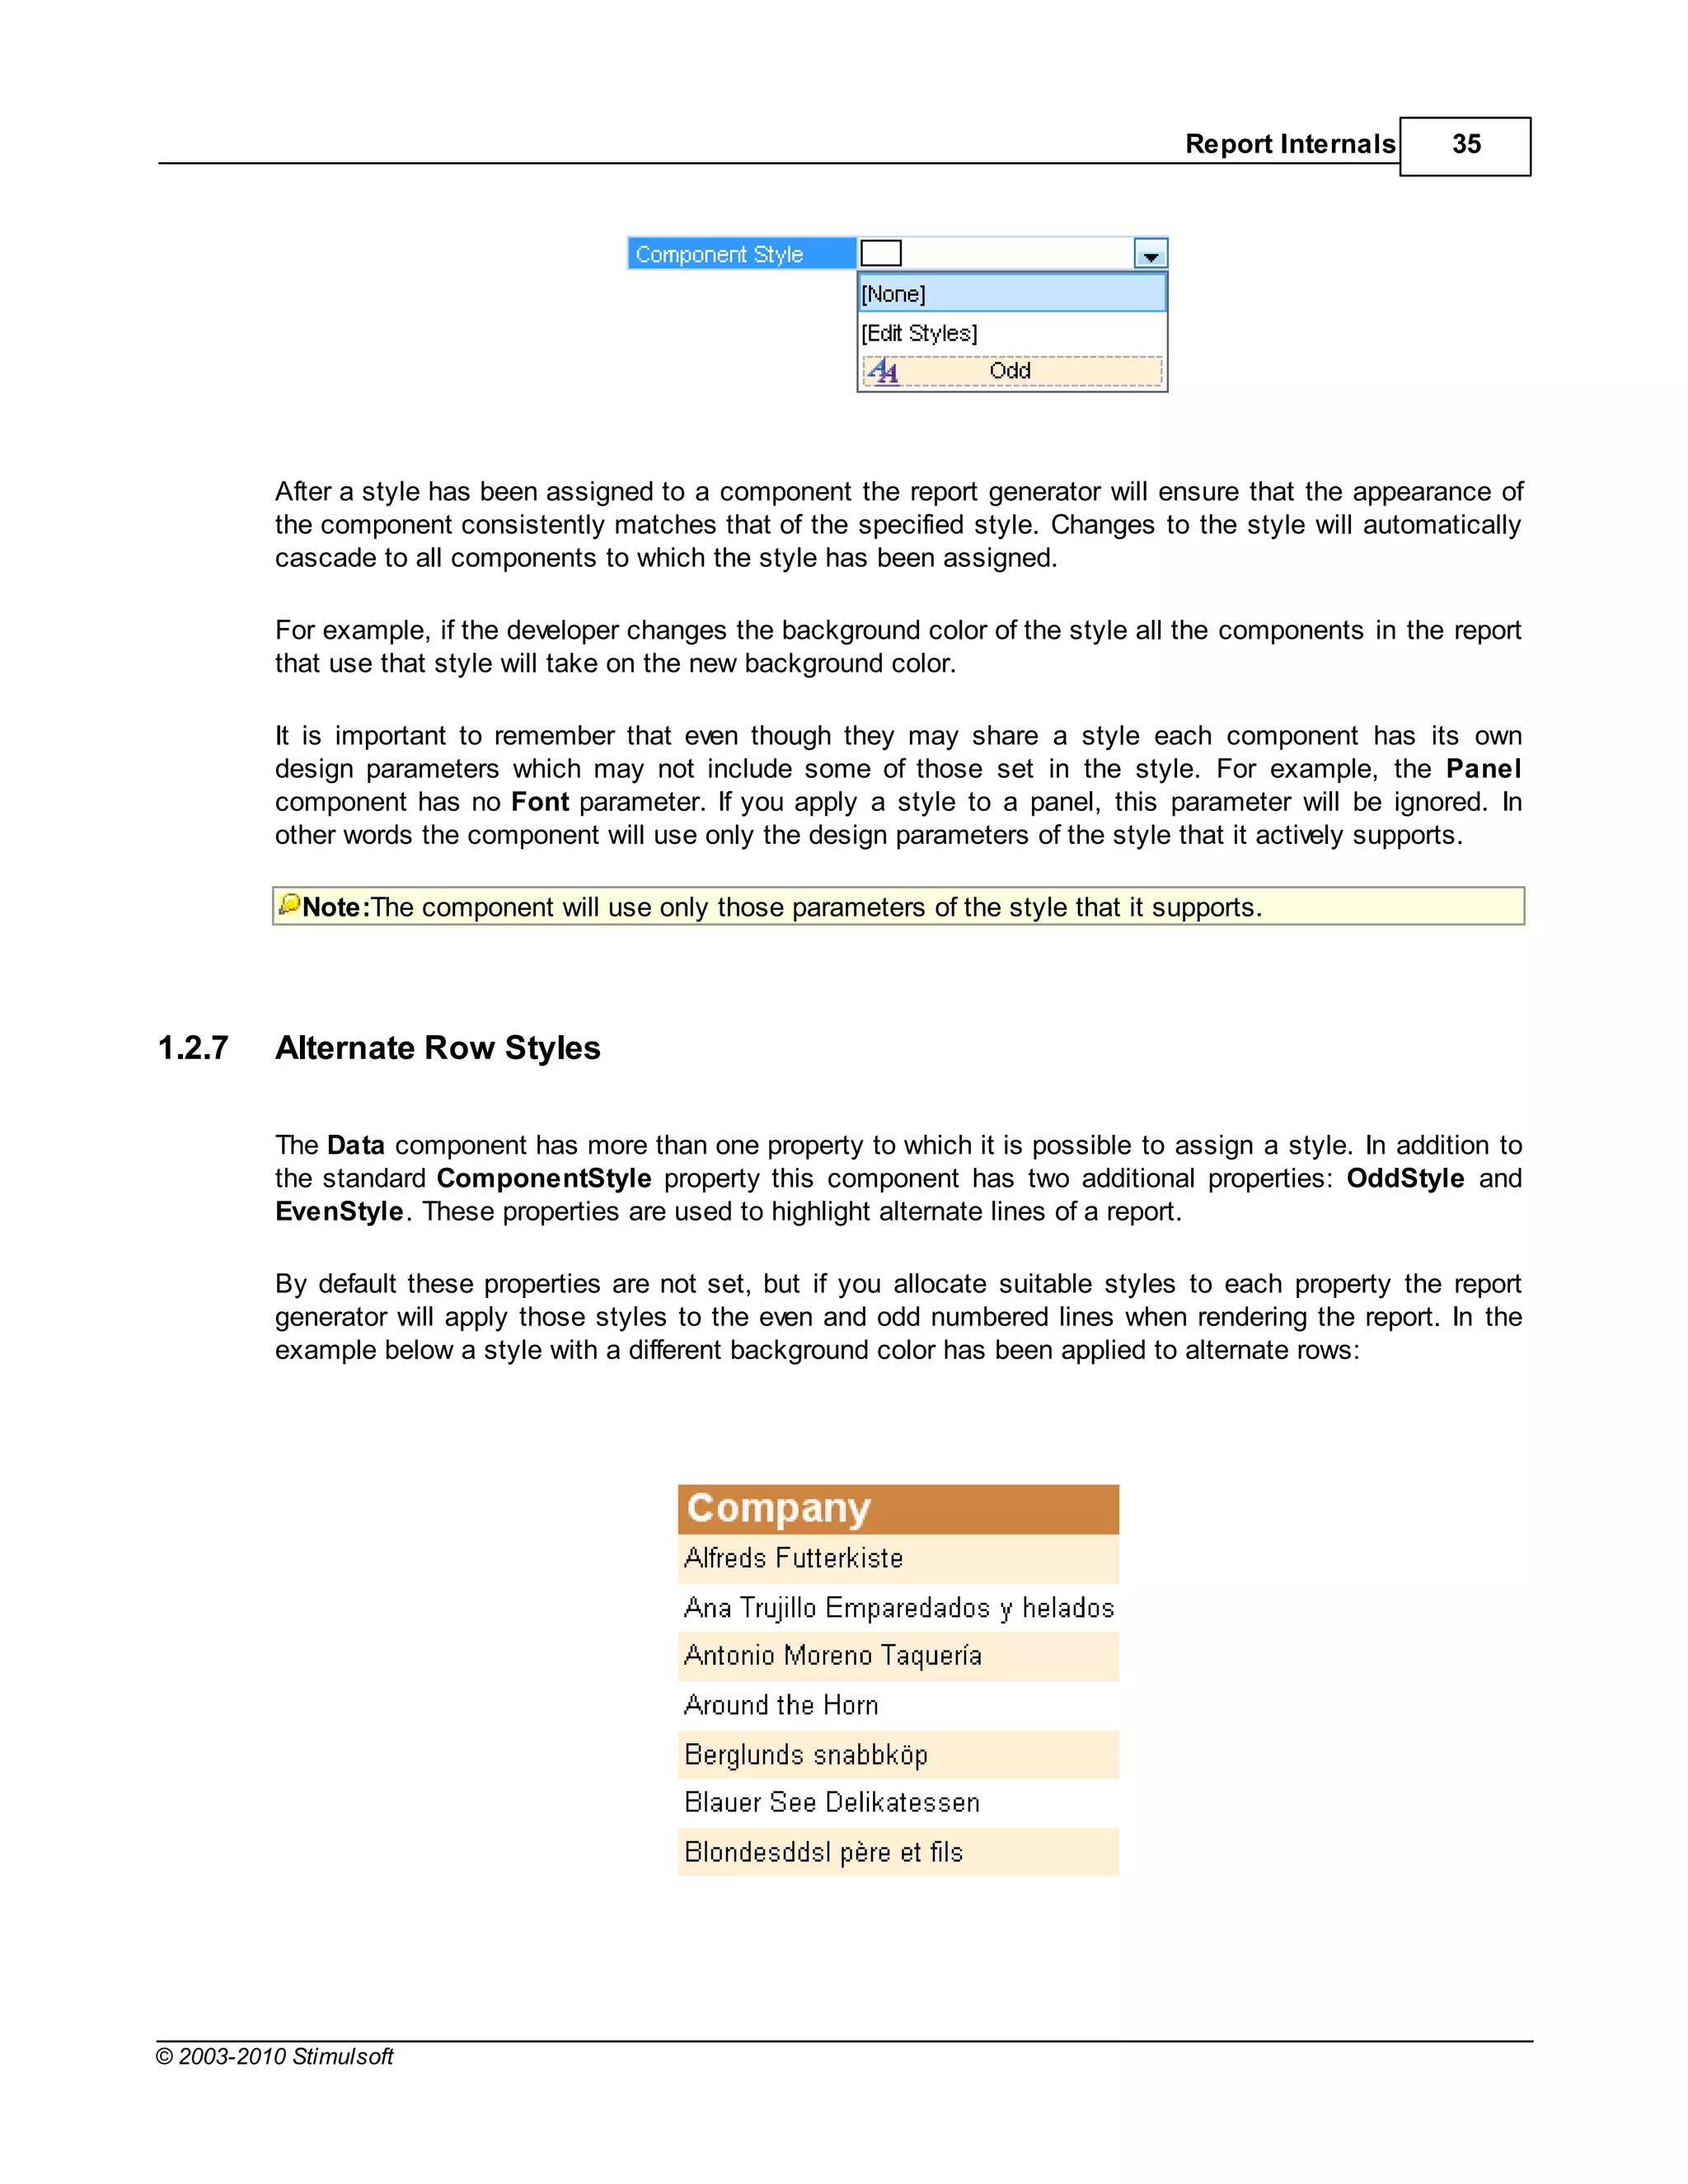
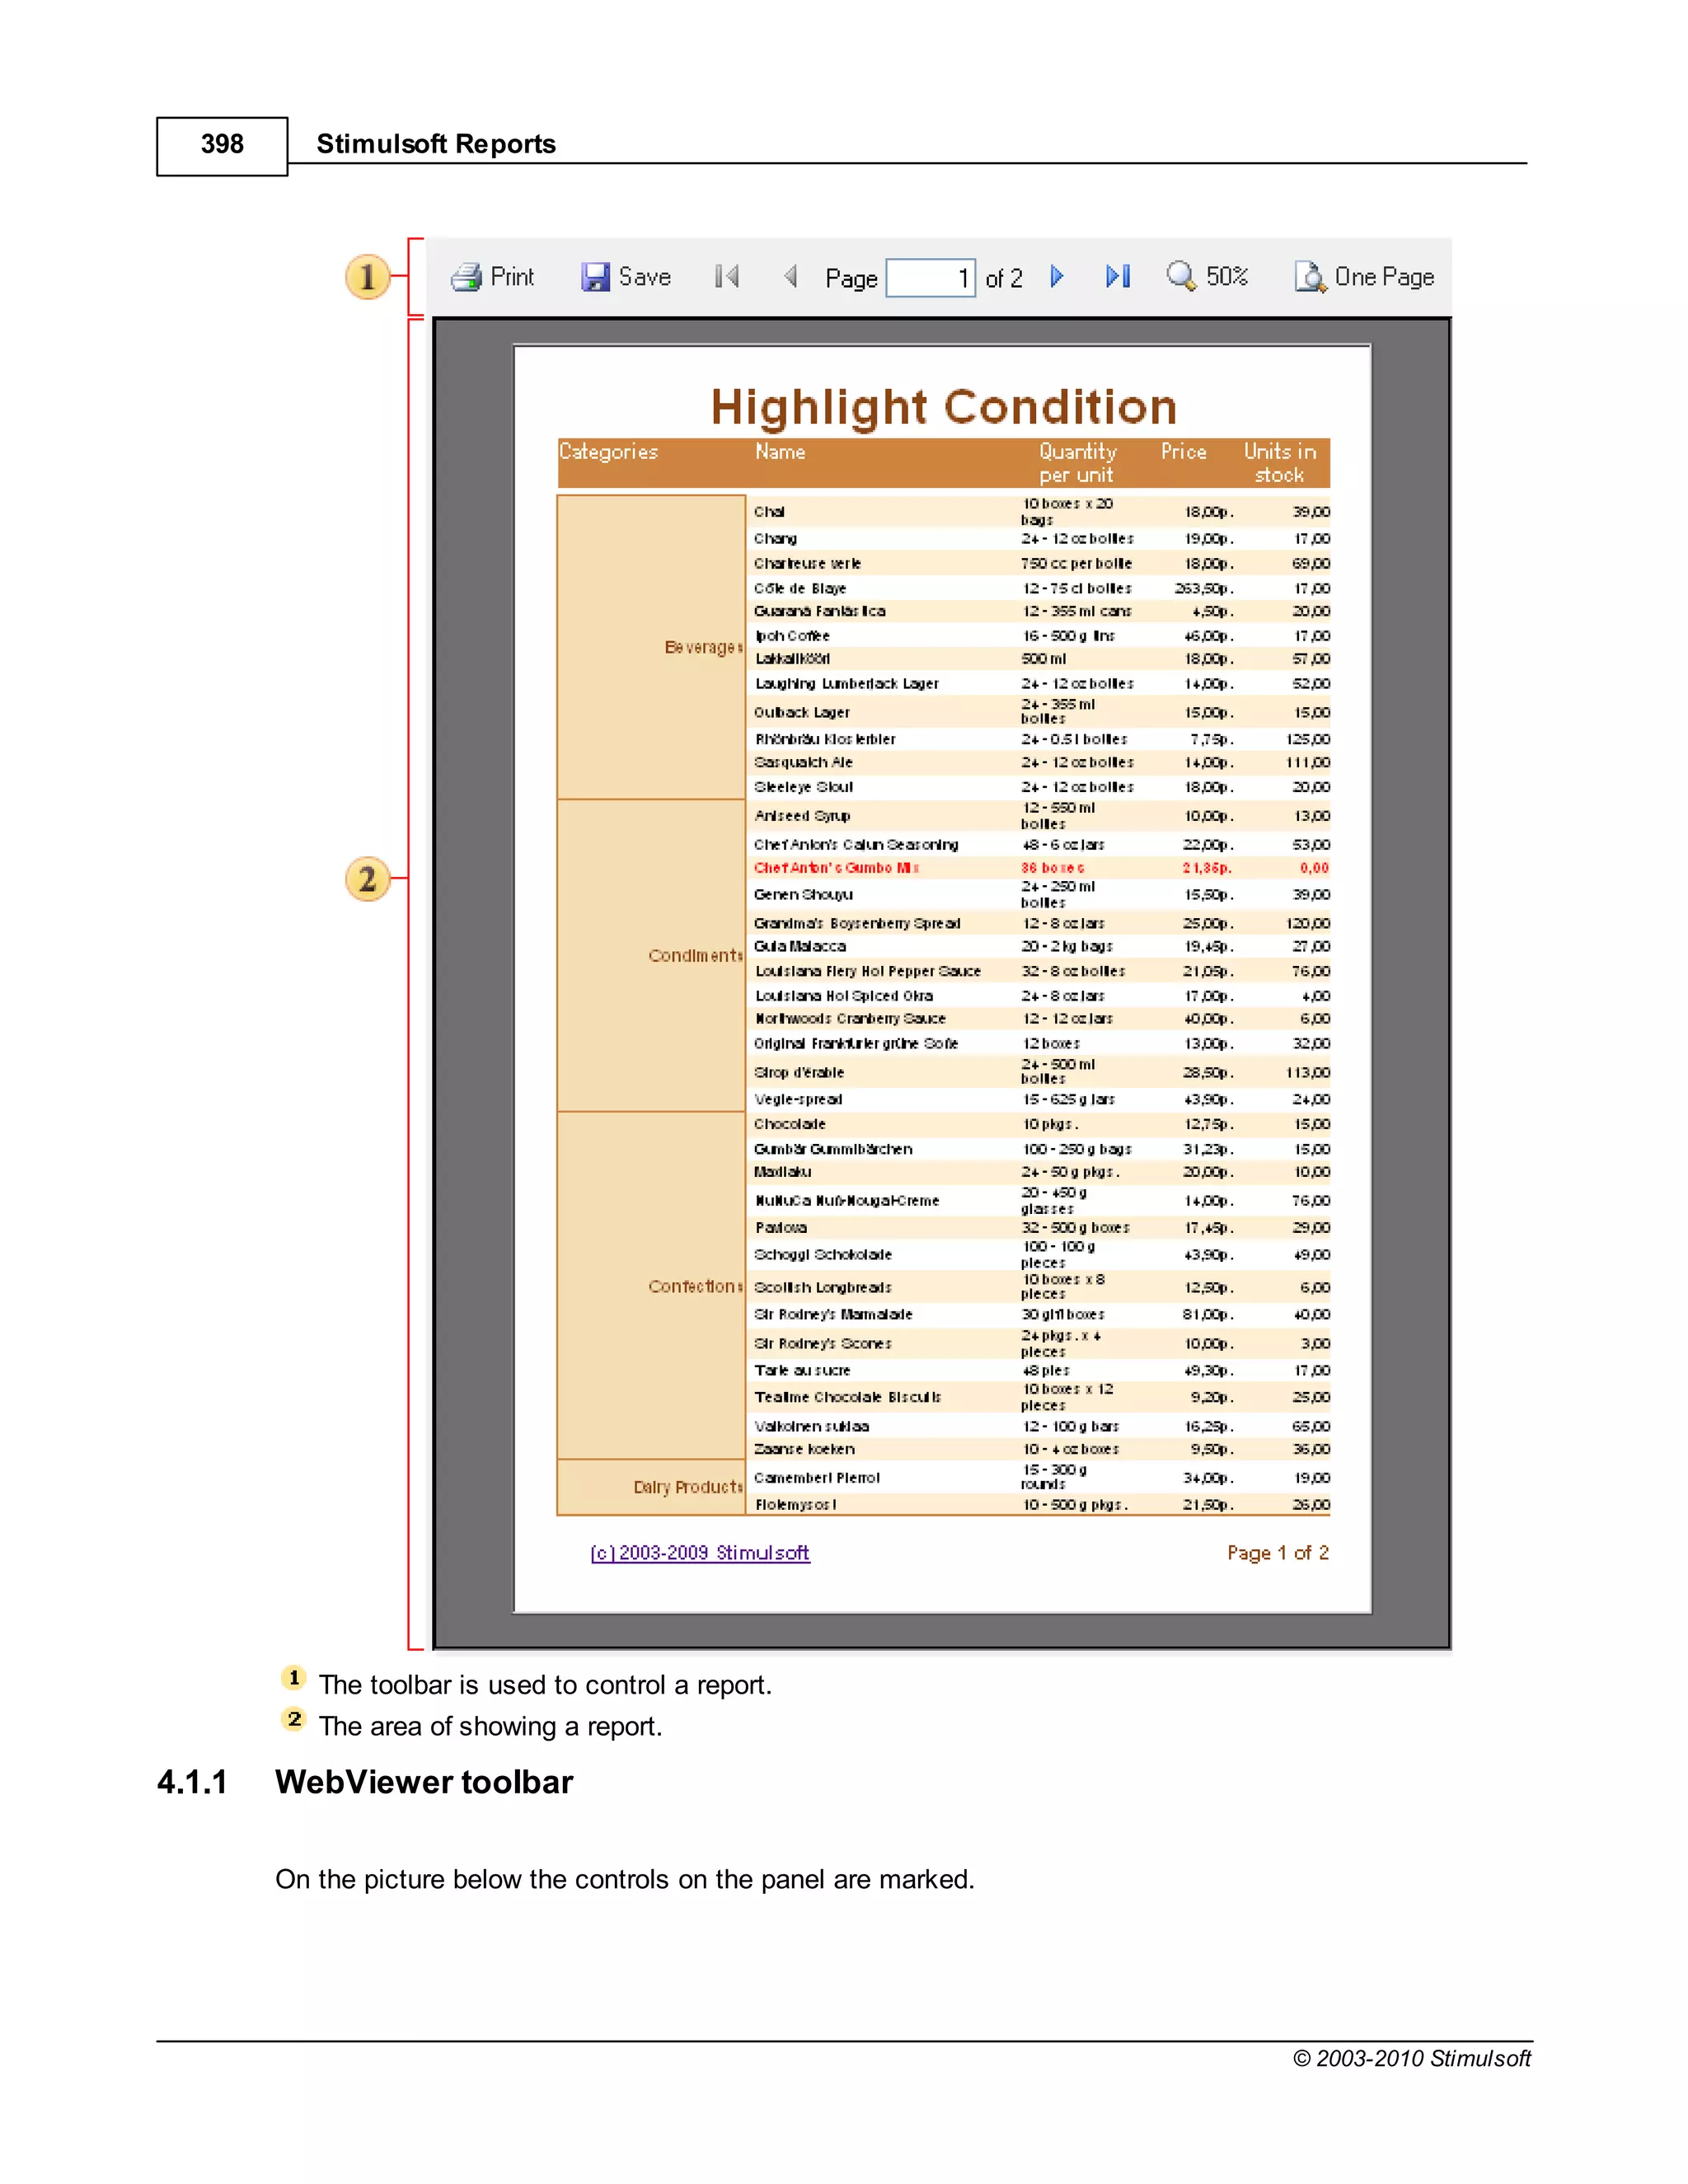
Applying Styles
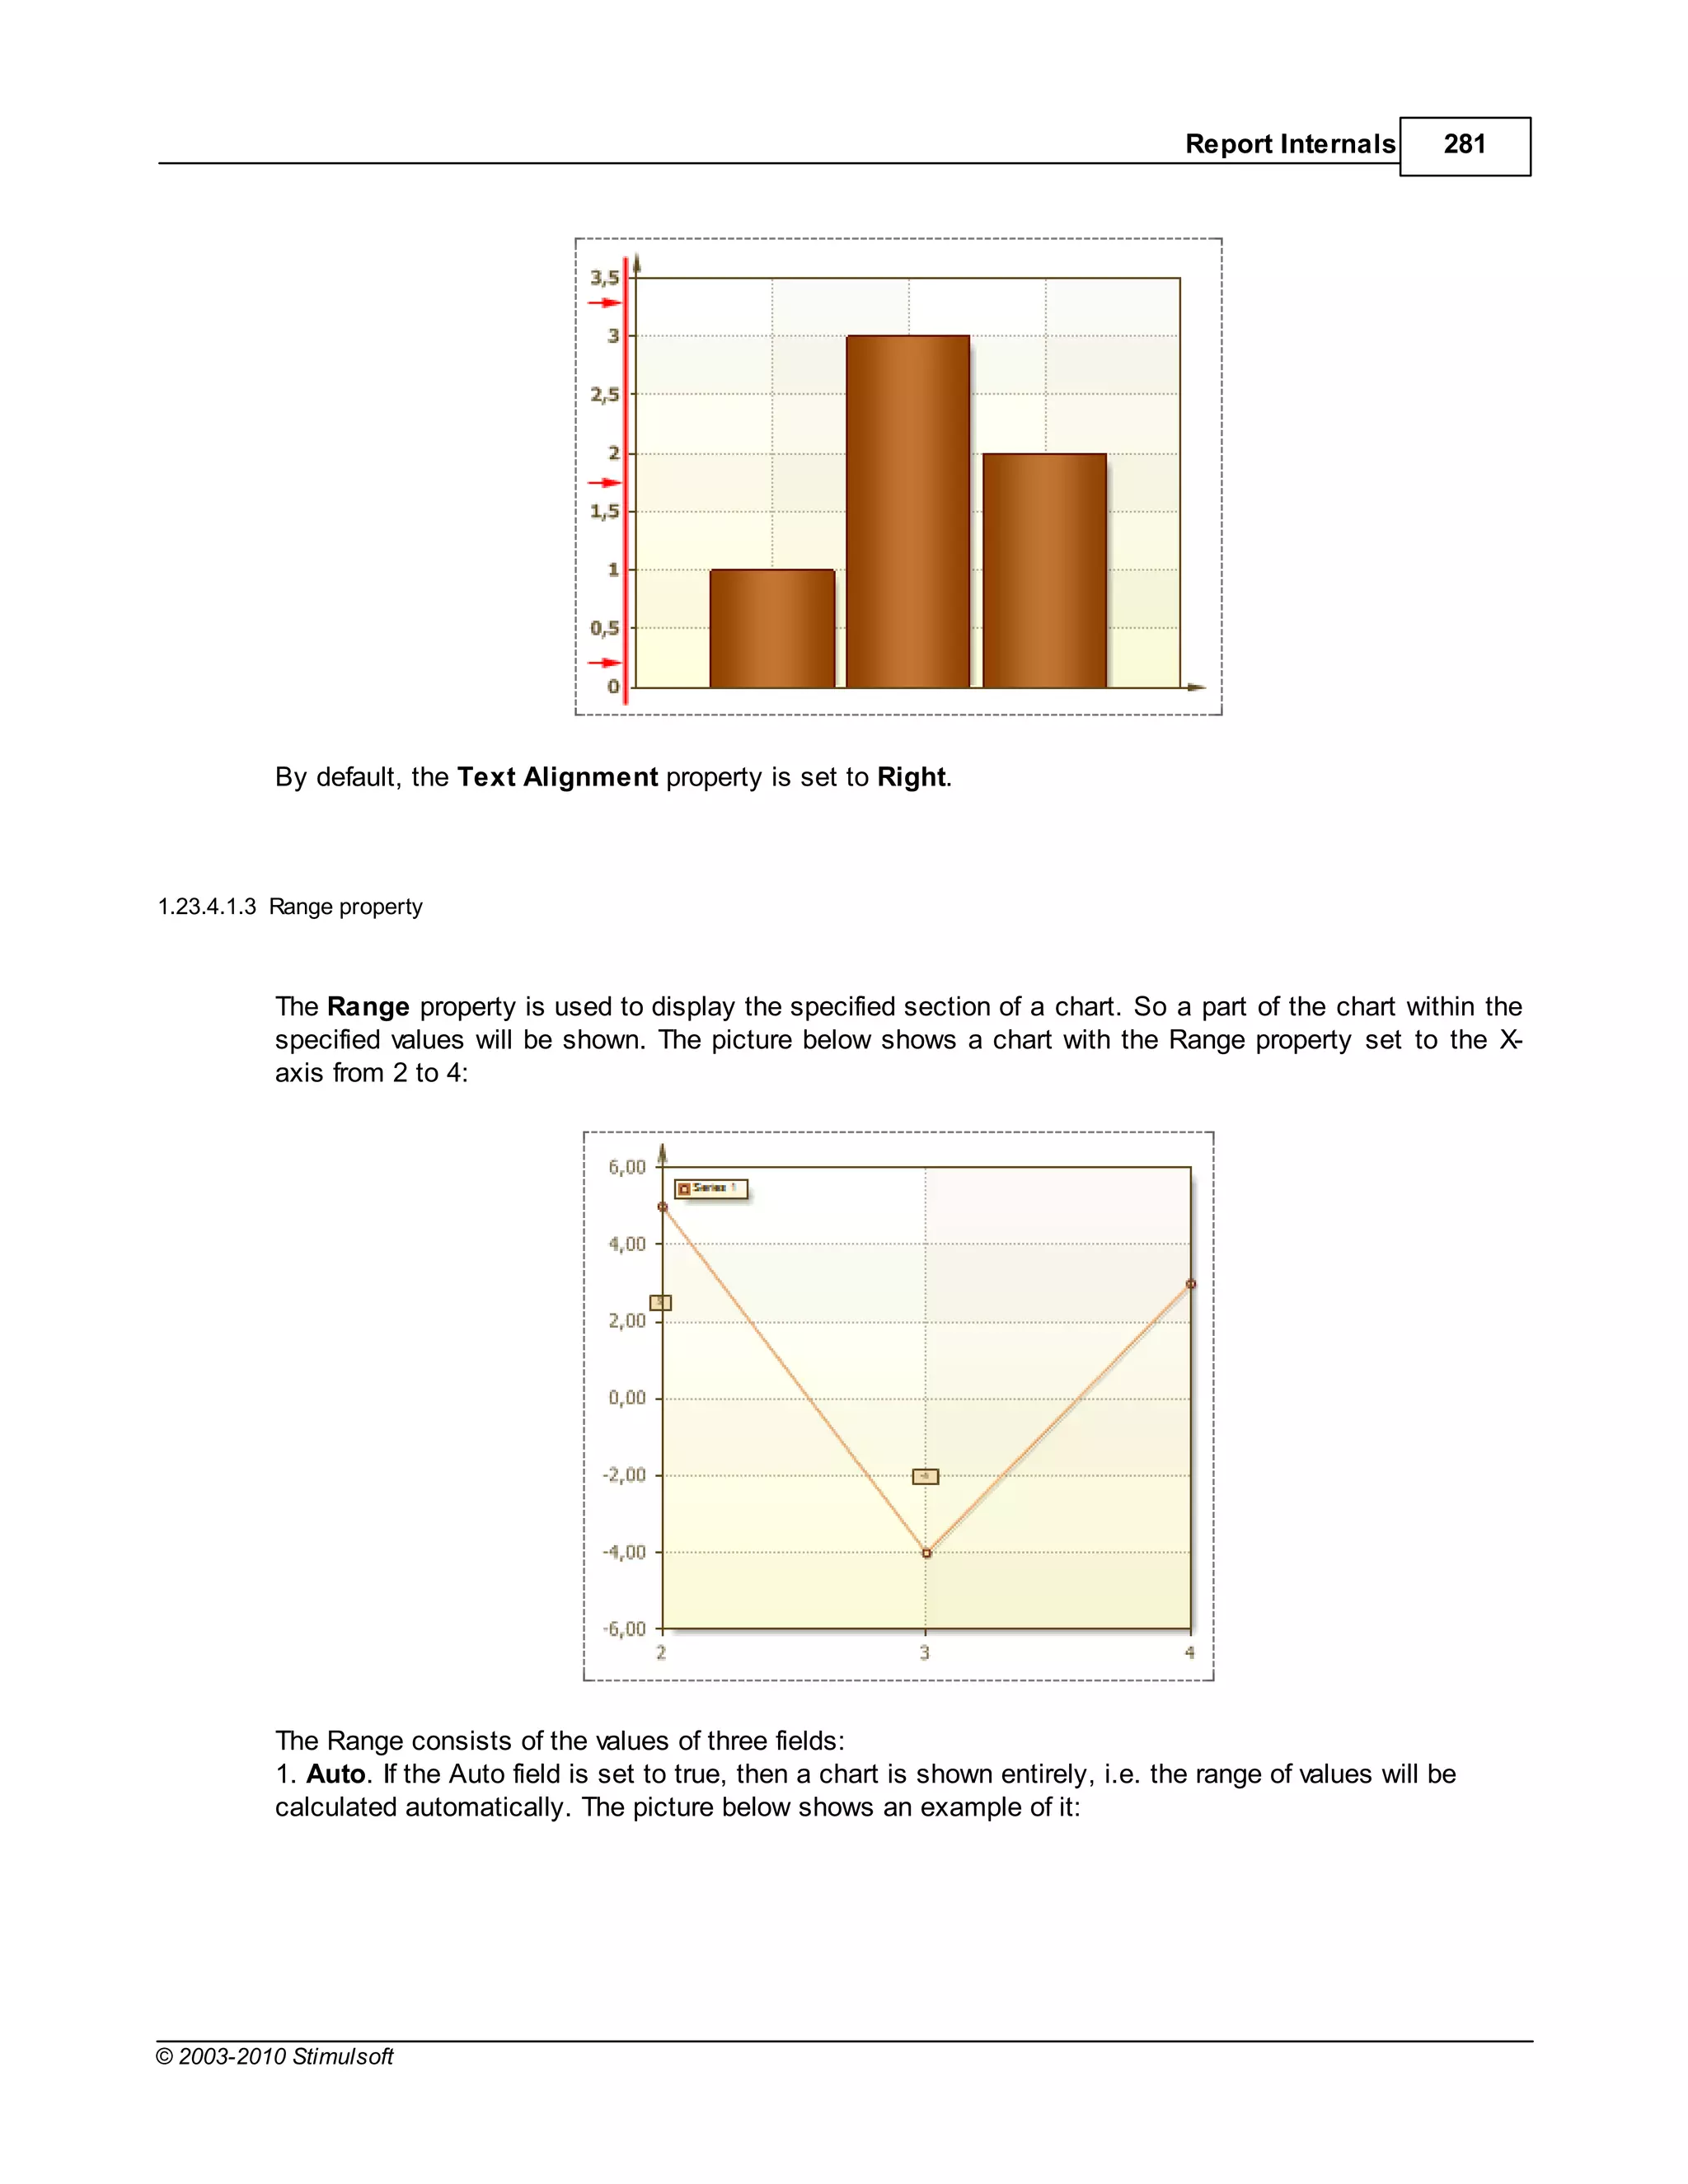
Each component in the report has a Component Style property. In the object inspector you can specify
any style that exists within the report by clicking the drop down button at the right of the property and
selecting it from the list. You can also create or edit styles by clicking the [Edit Styles] option:
© 2003-2010 Stimulsoft](https://image.slidesharecdn.com/usermanual-100720093903-phpapp01/75/User-manual-34-2048.jpg)
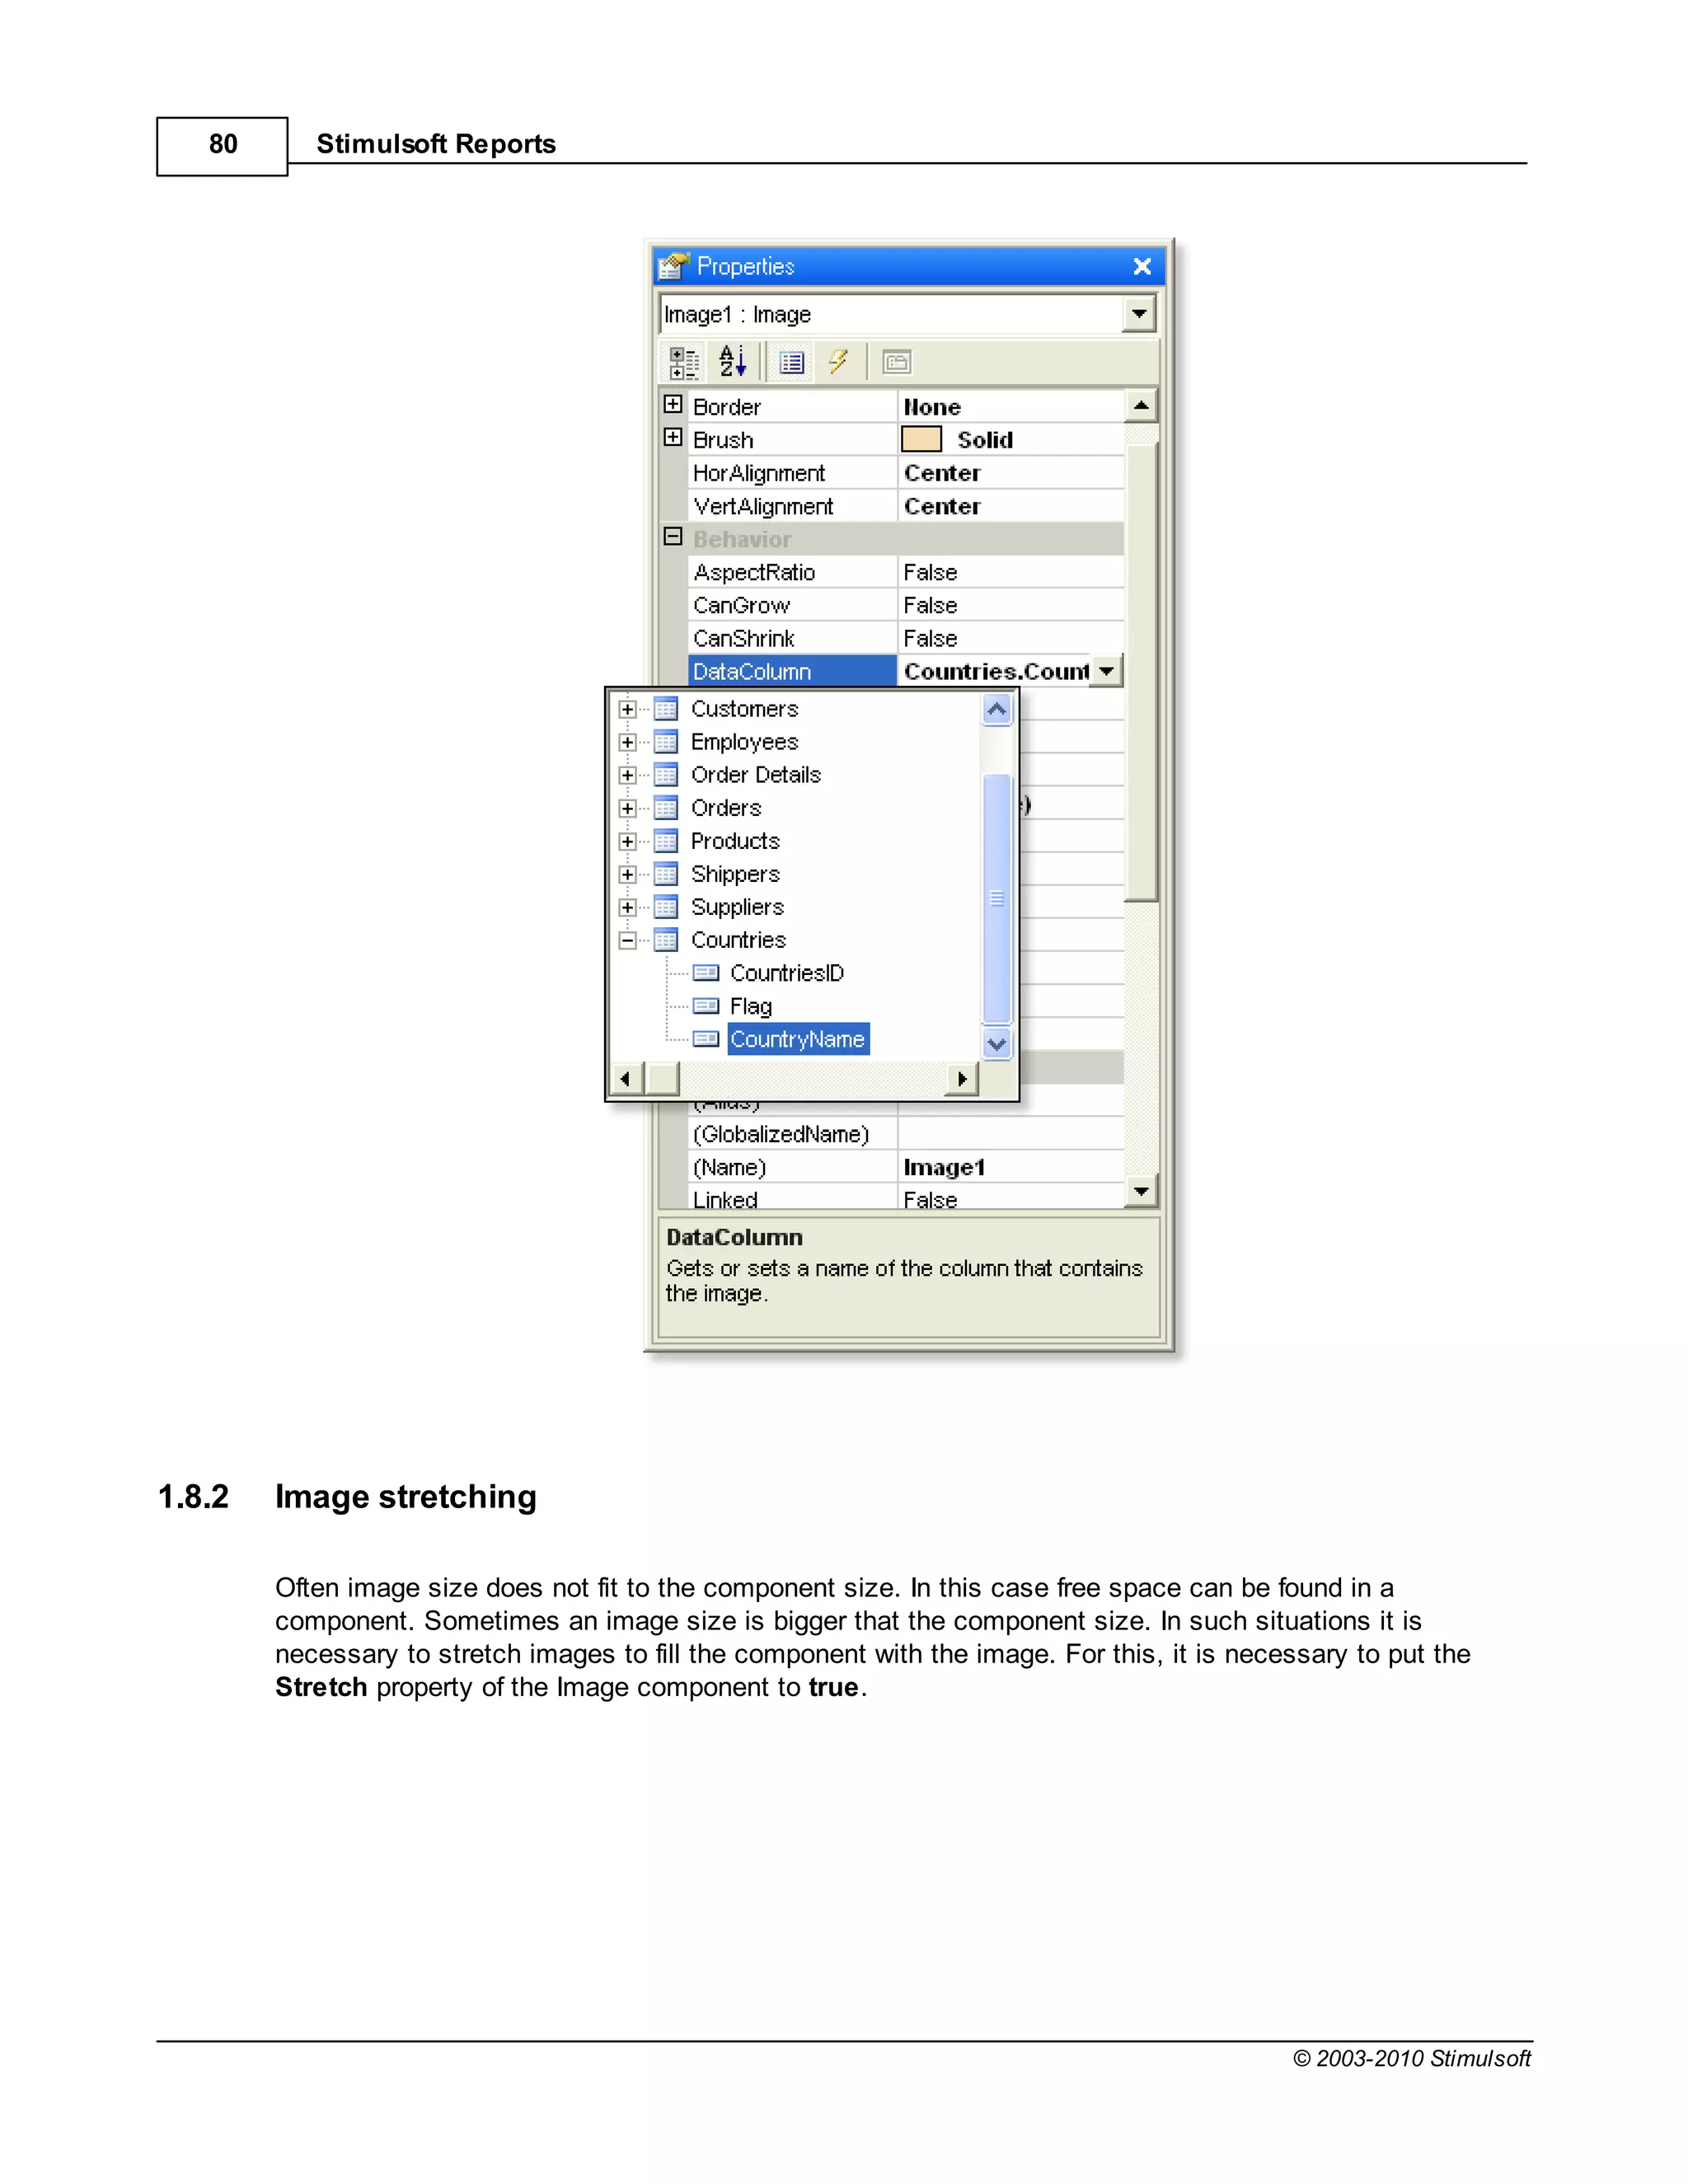


![Report Internals 85
Also it is possible to load images from a code of application before report rendering:
C#
StiReport report = new StiReport();
report.Load("D:myimage.mrt");
StiImage image = new StiImage();
image.Image = Image.FromFile("d:SomeImage.jpg");
report.Compile();
report["MyImage"] = image;
report.Show();
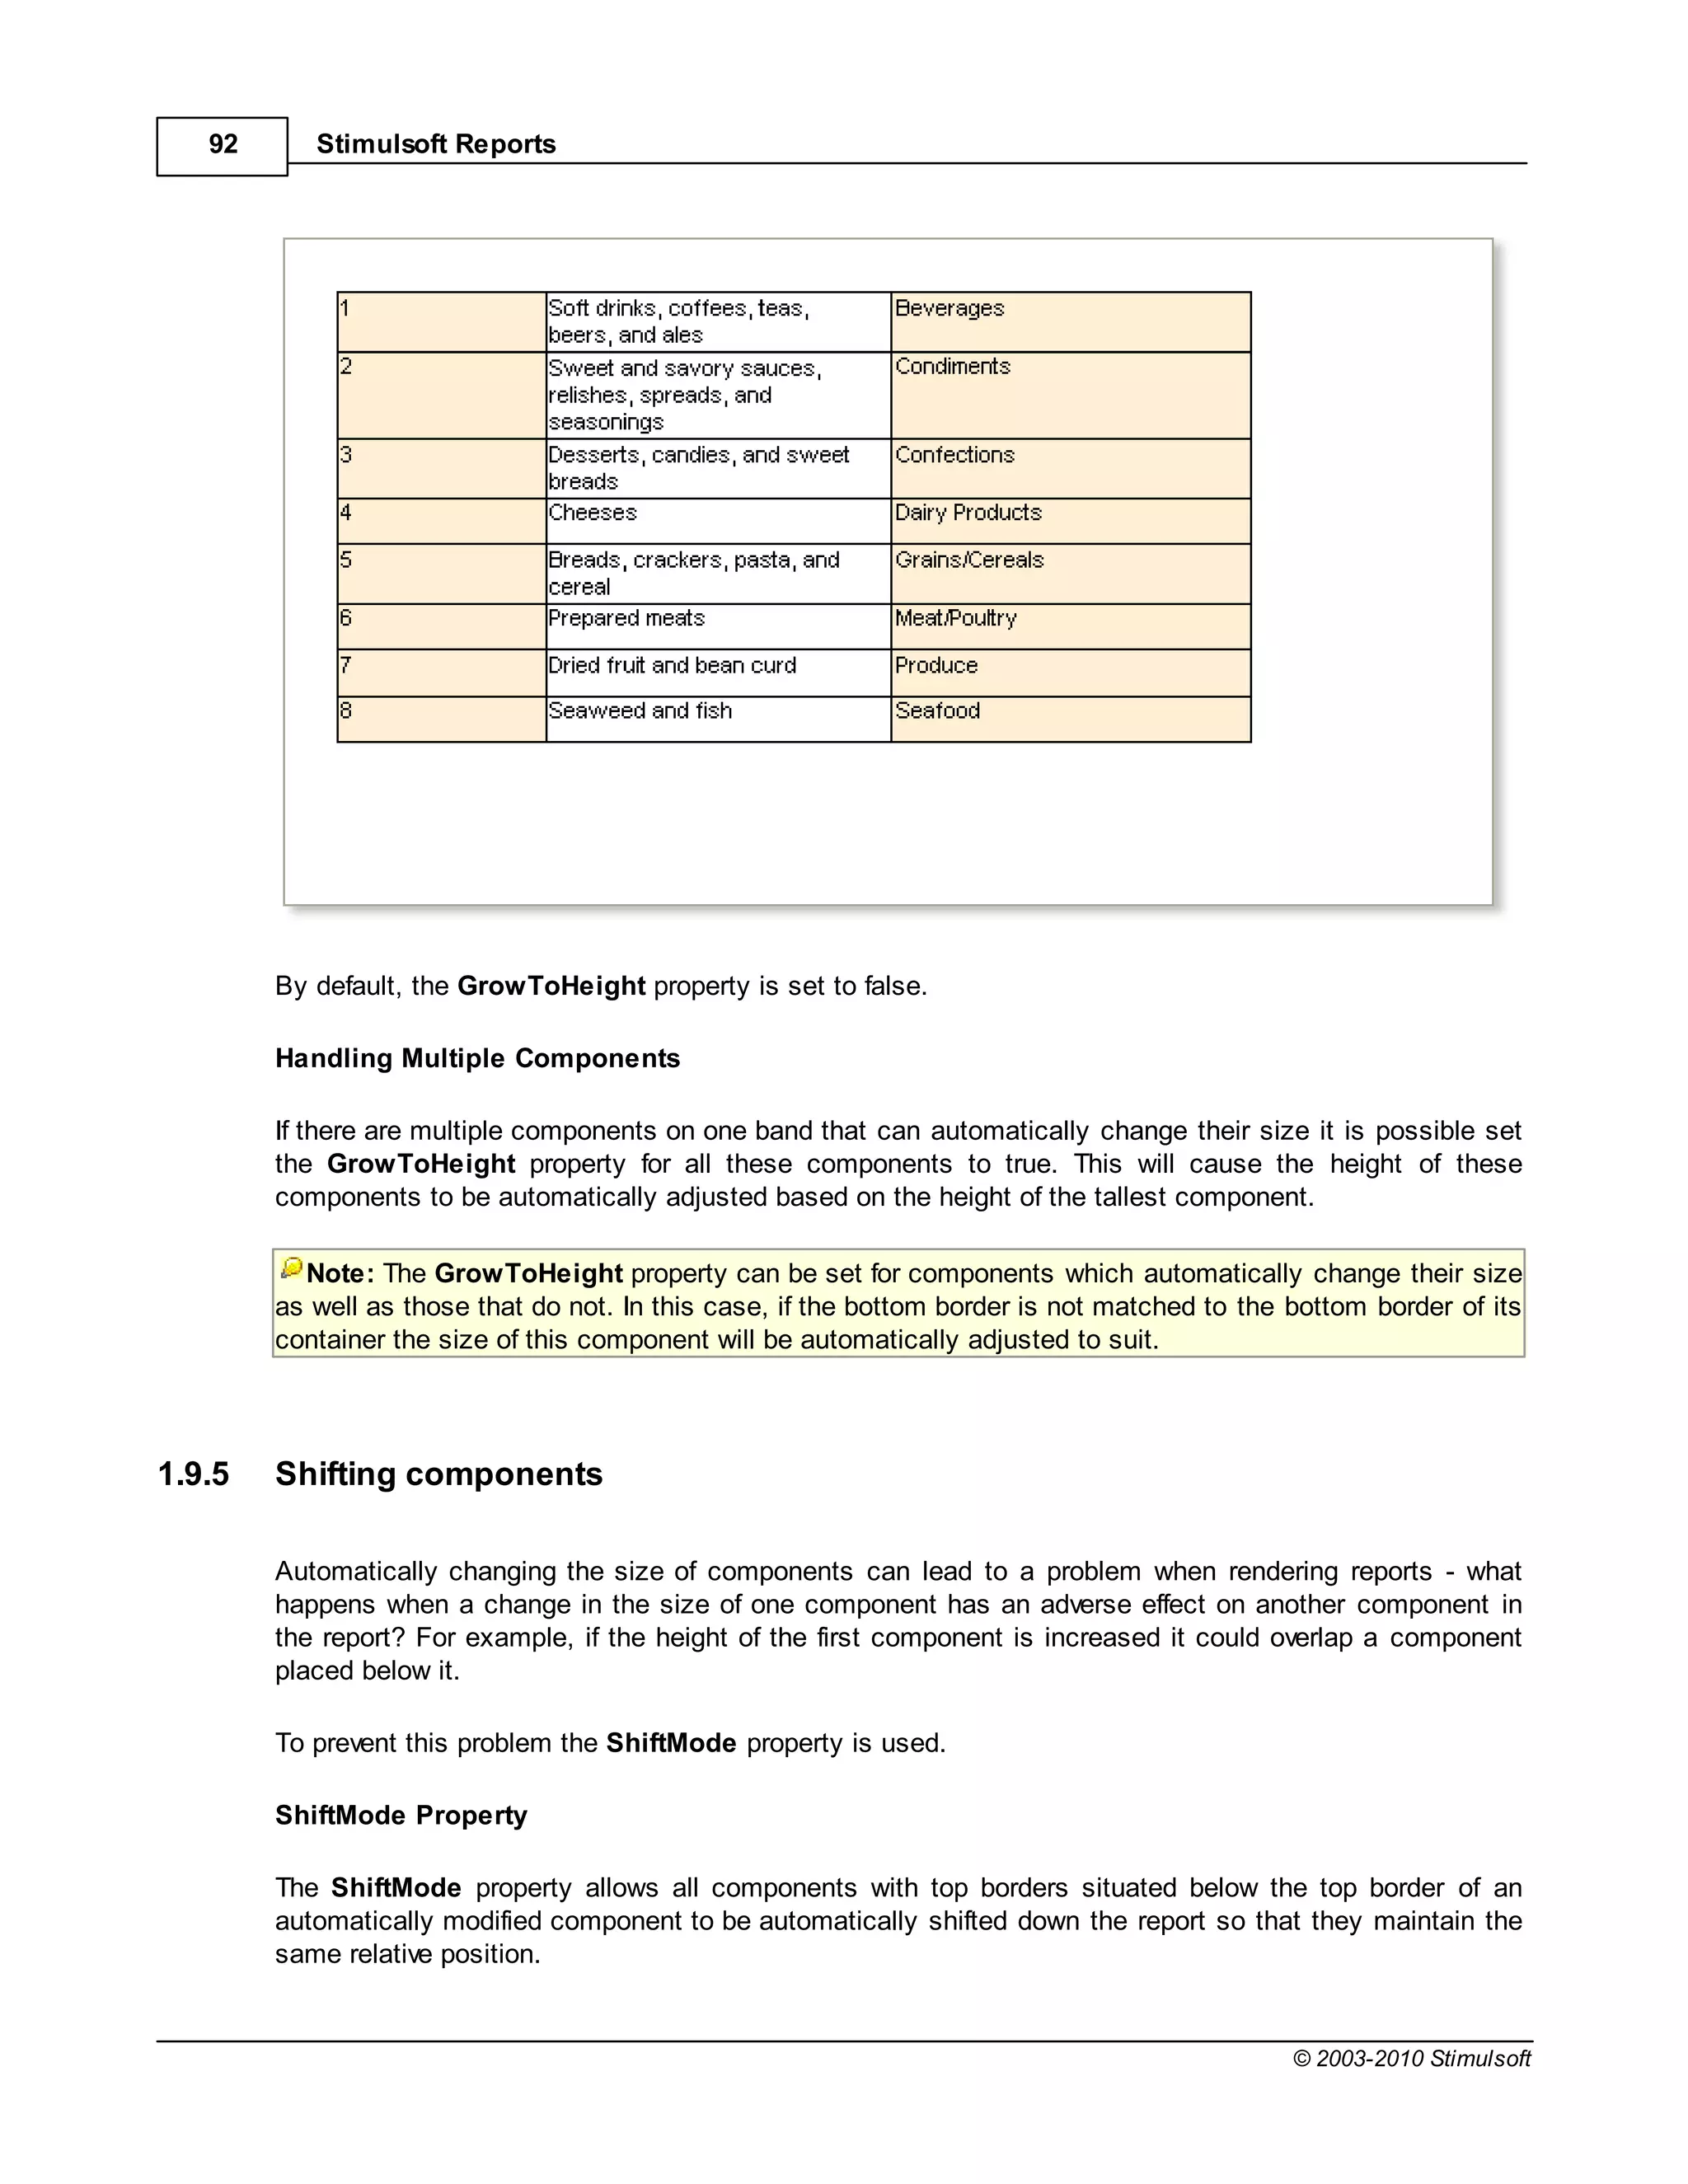
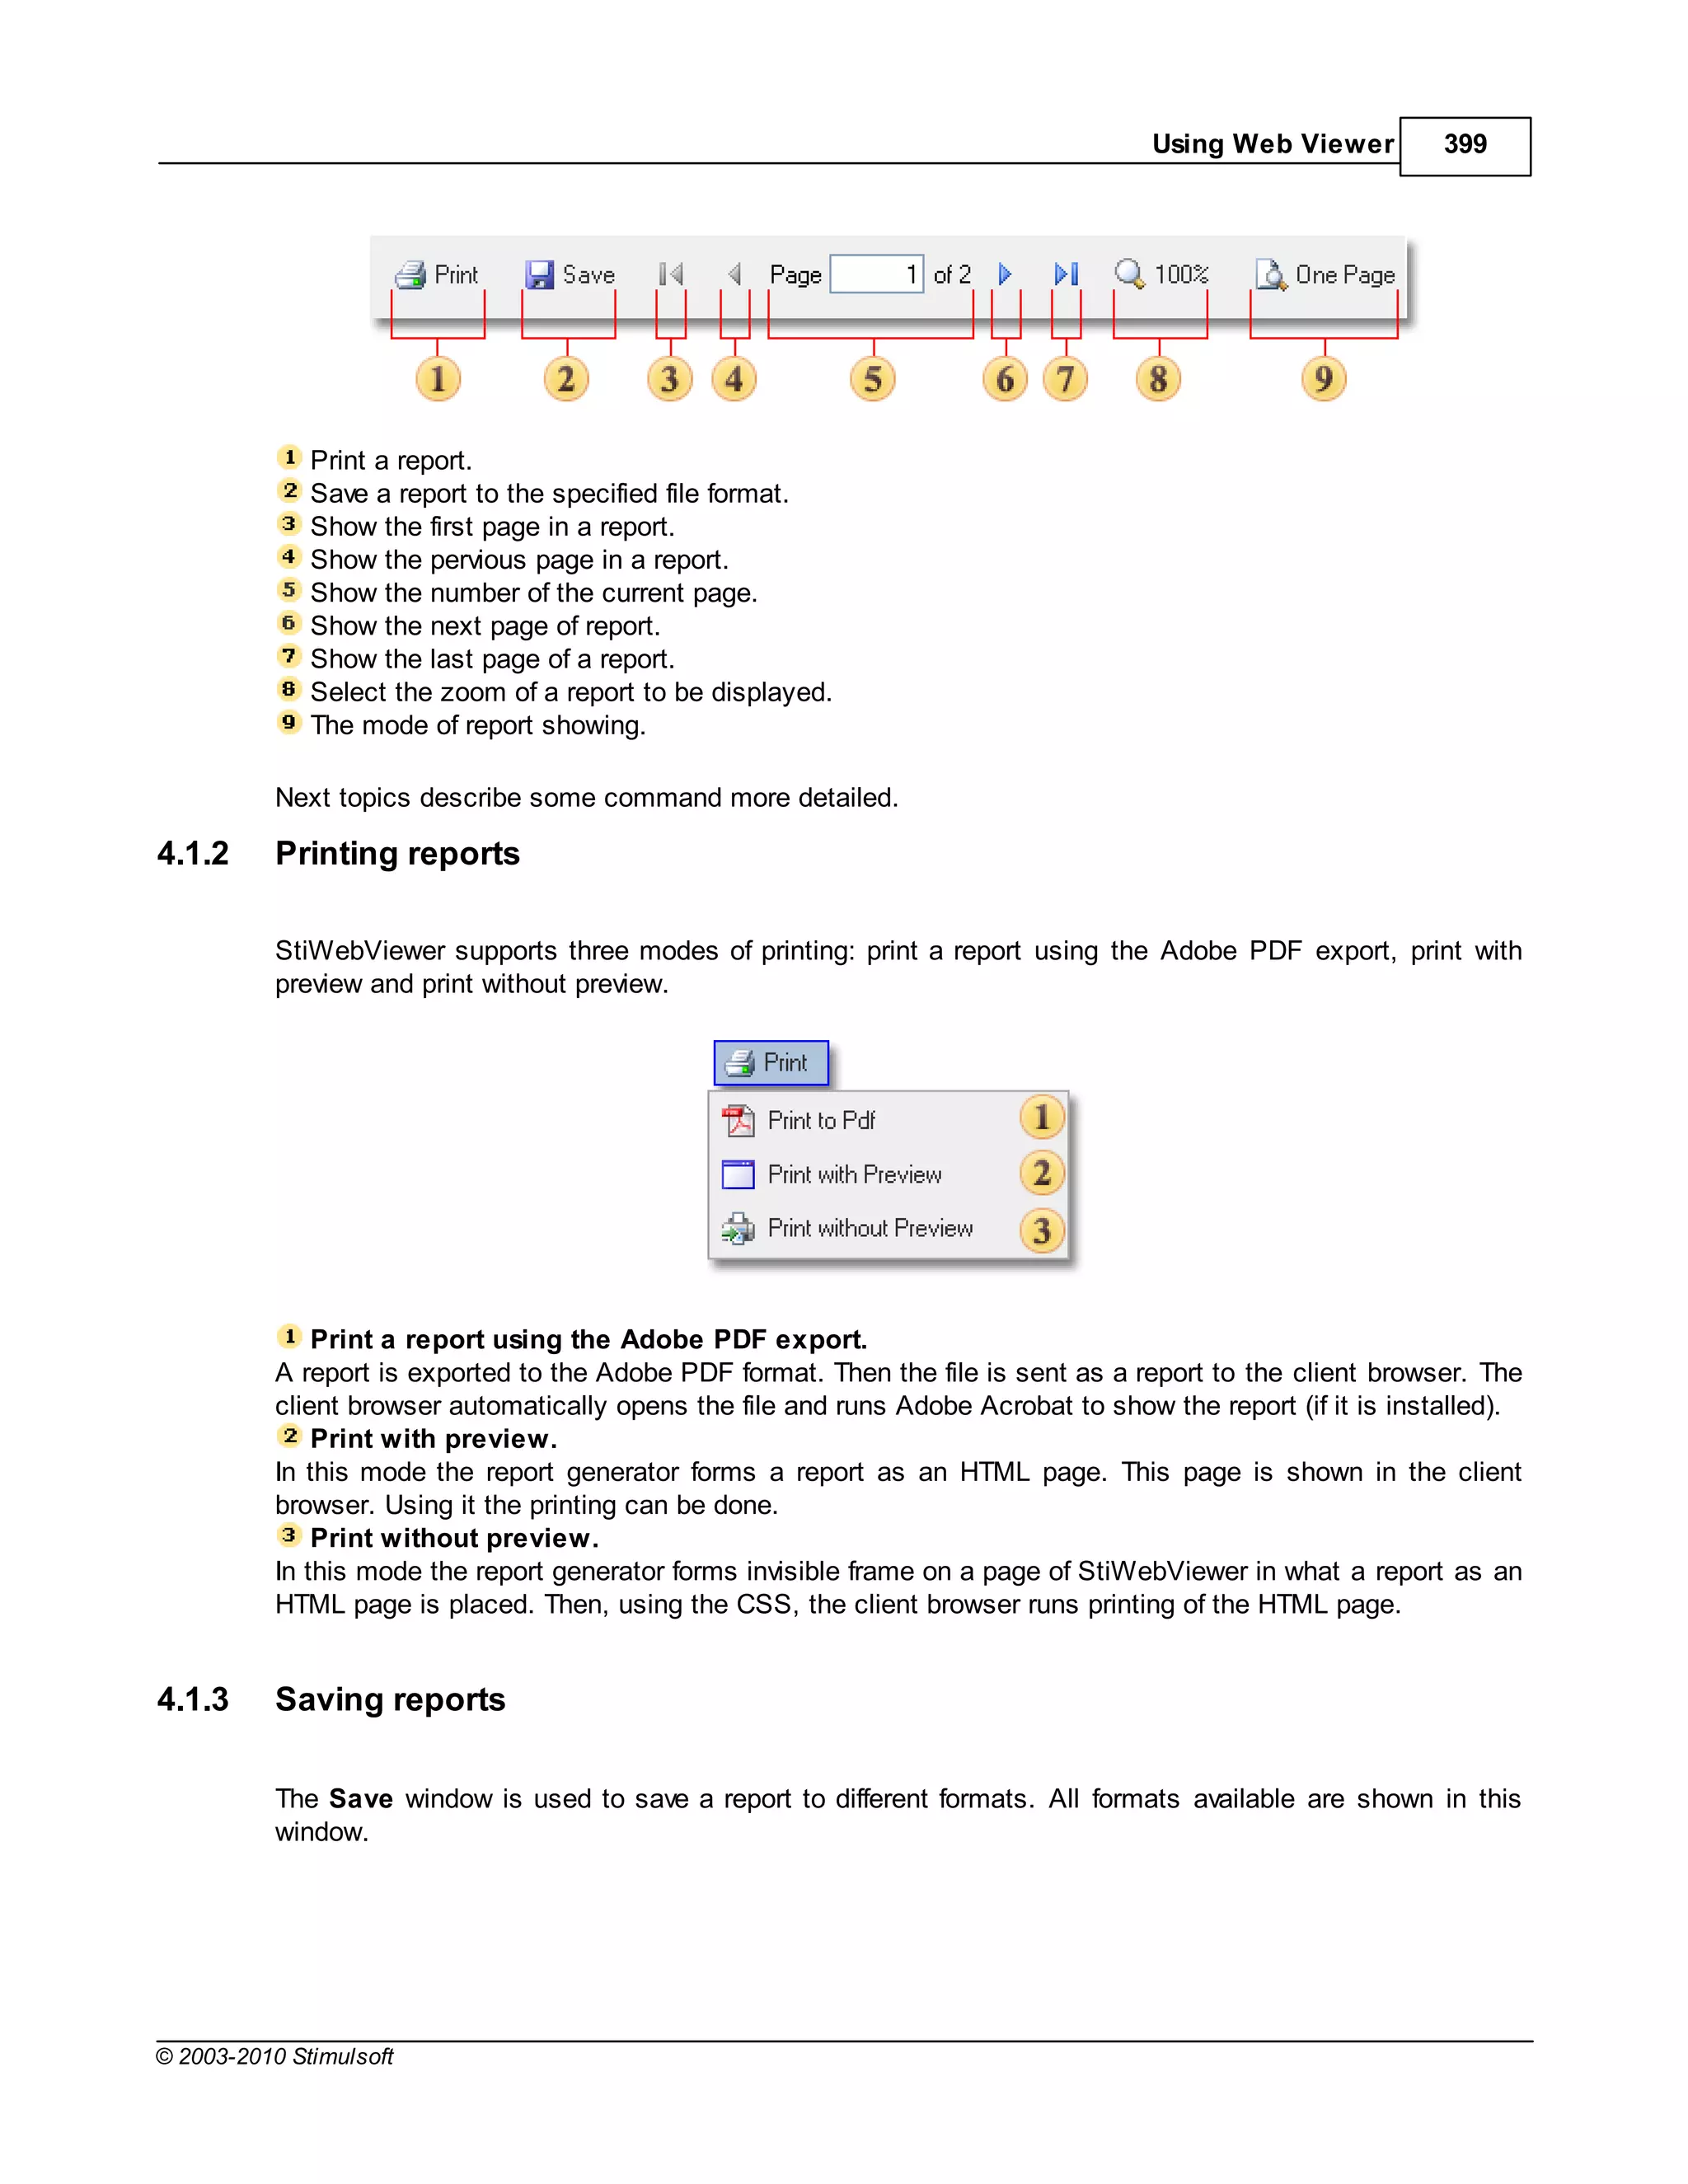
1.9 Autosize
Automatic resizing of components is controlled by two properties available in report components:
CanGrow and CanShrink.
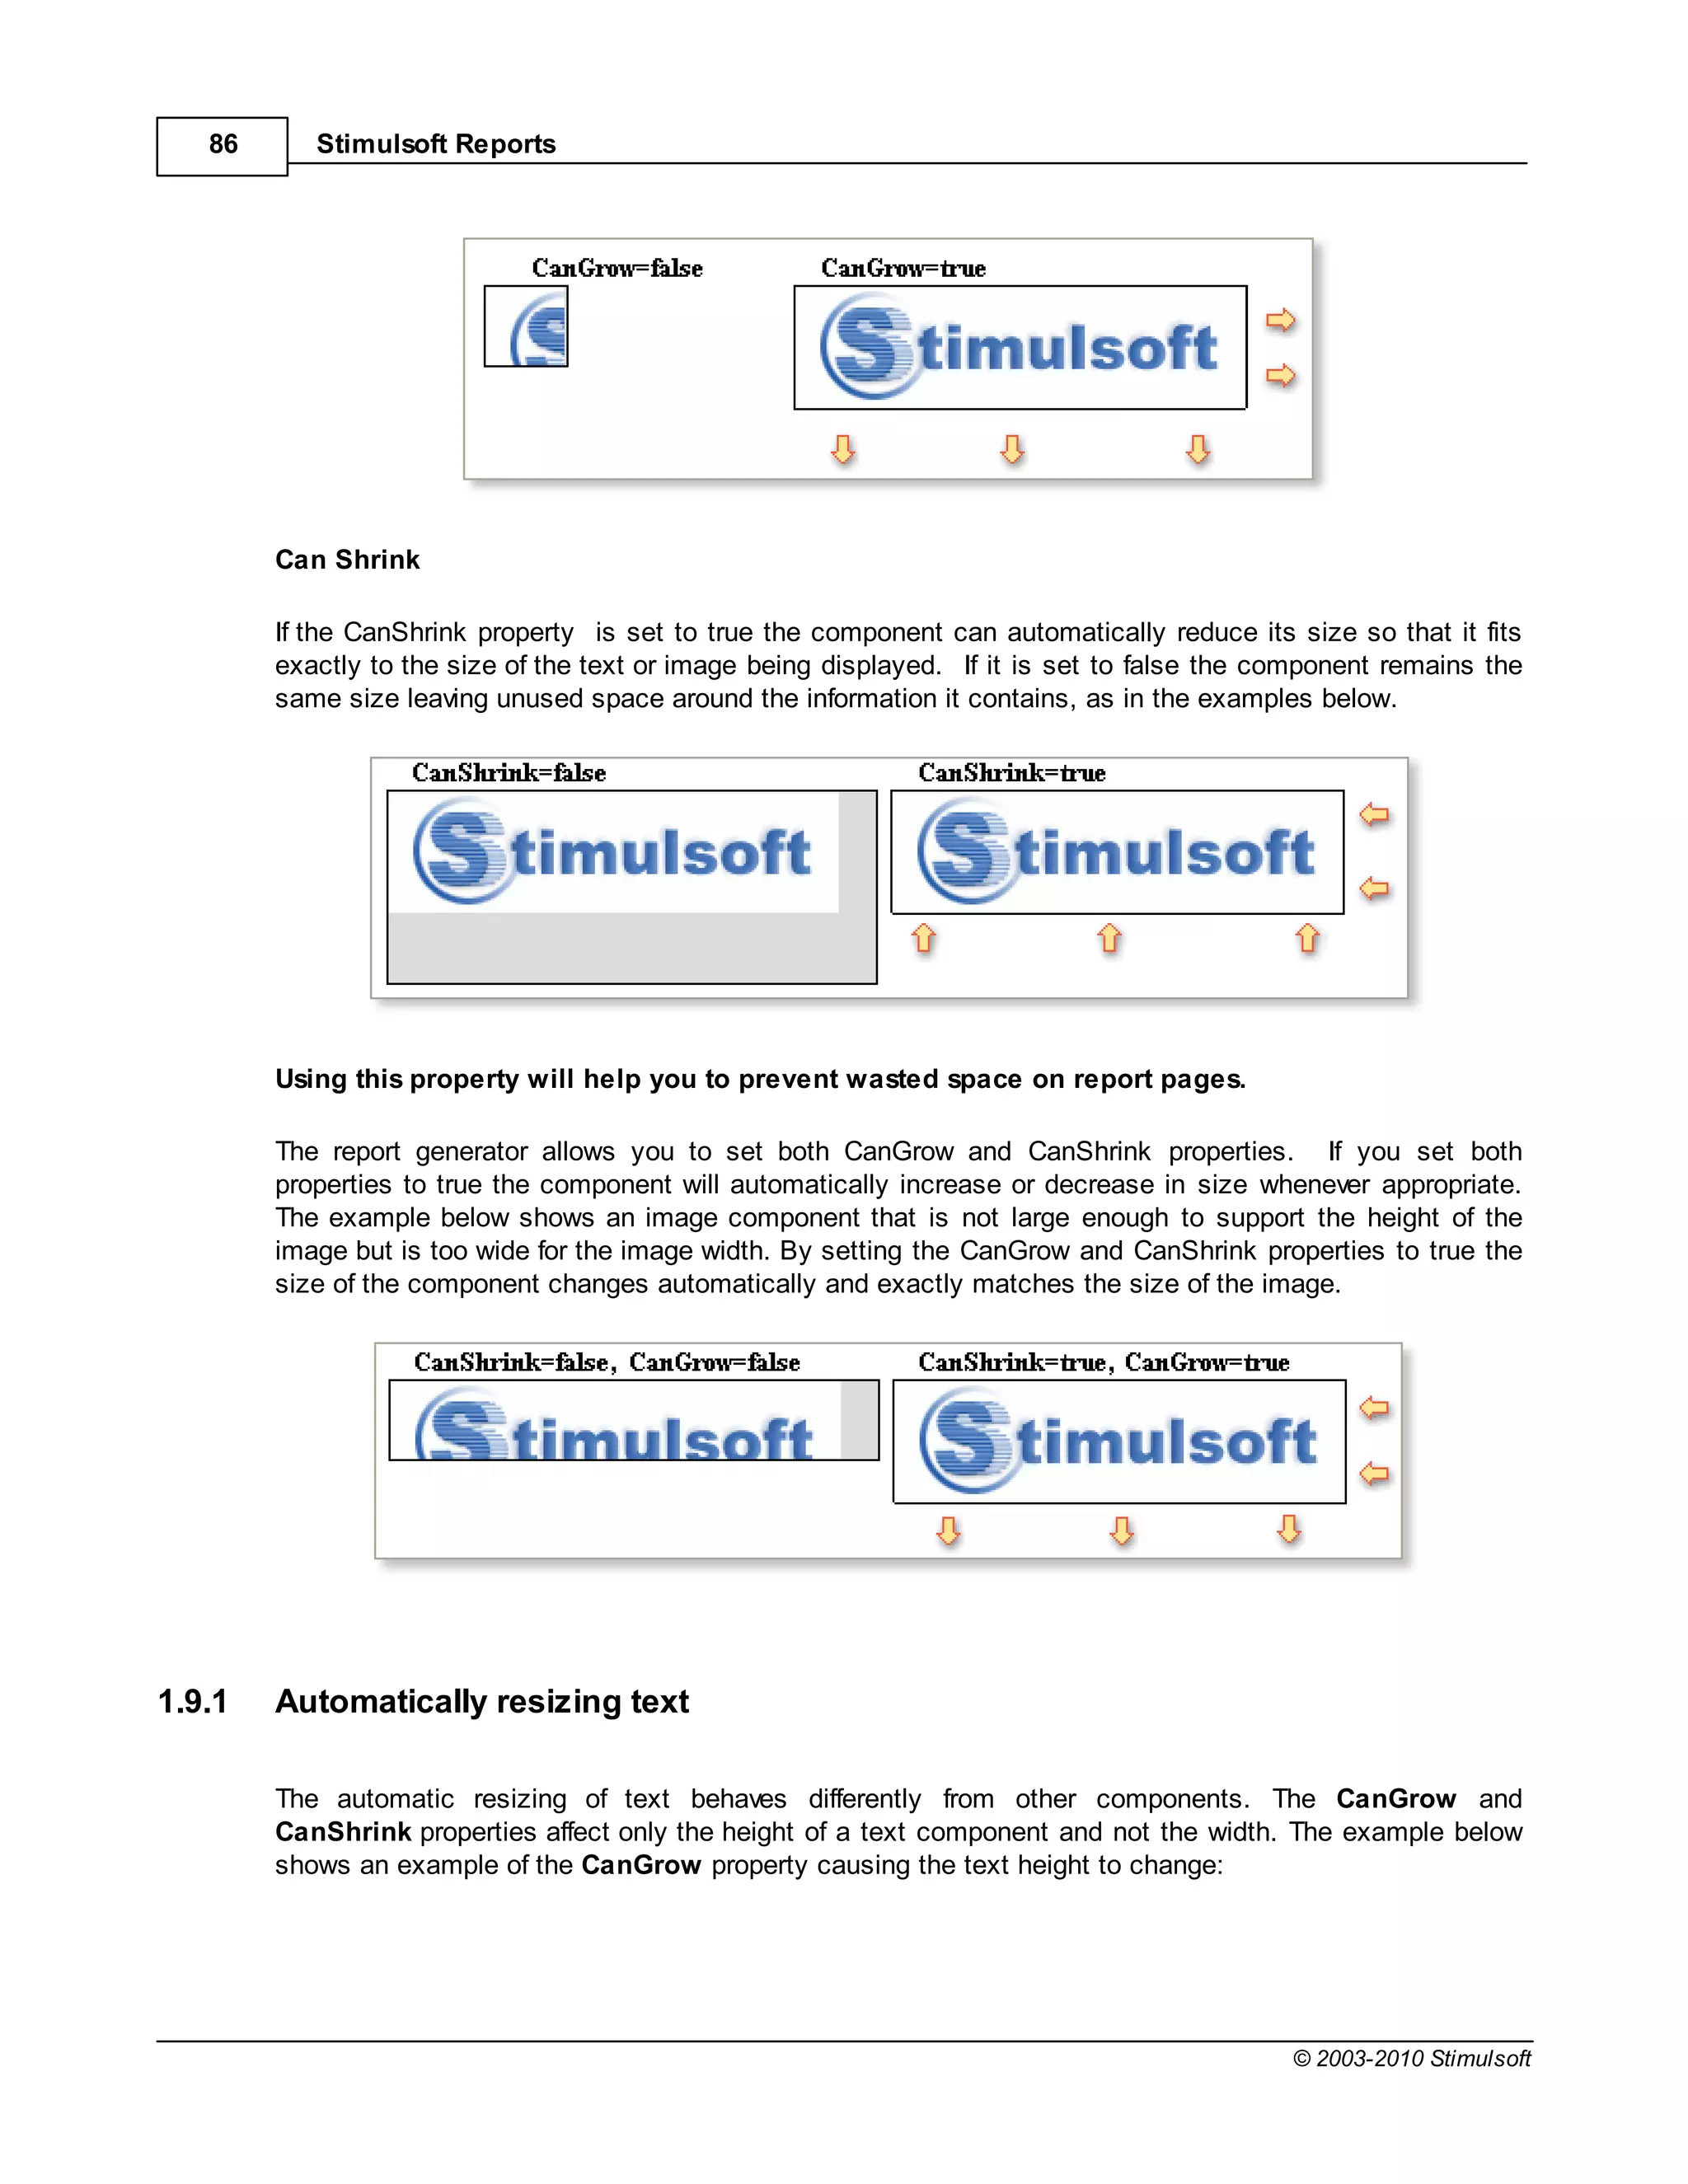
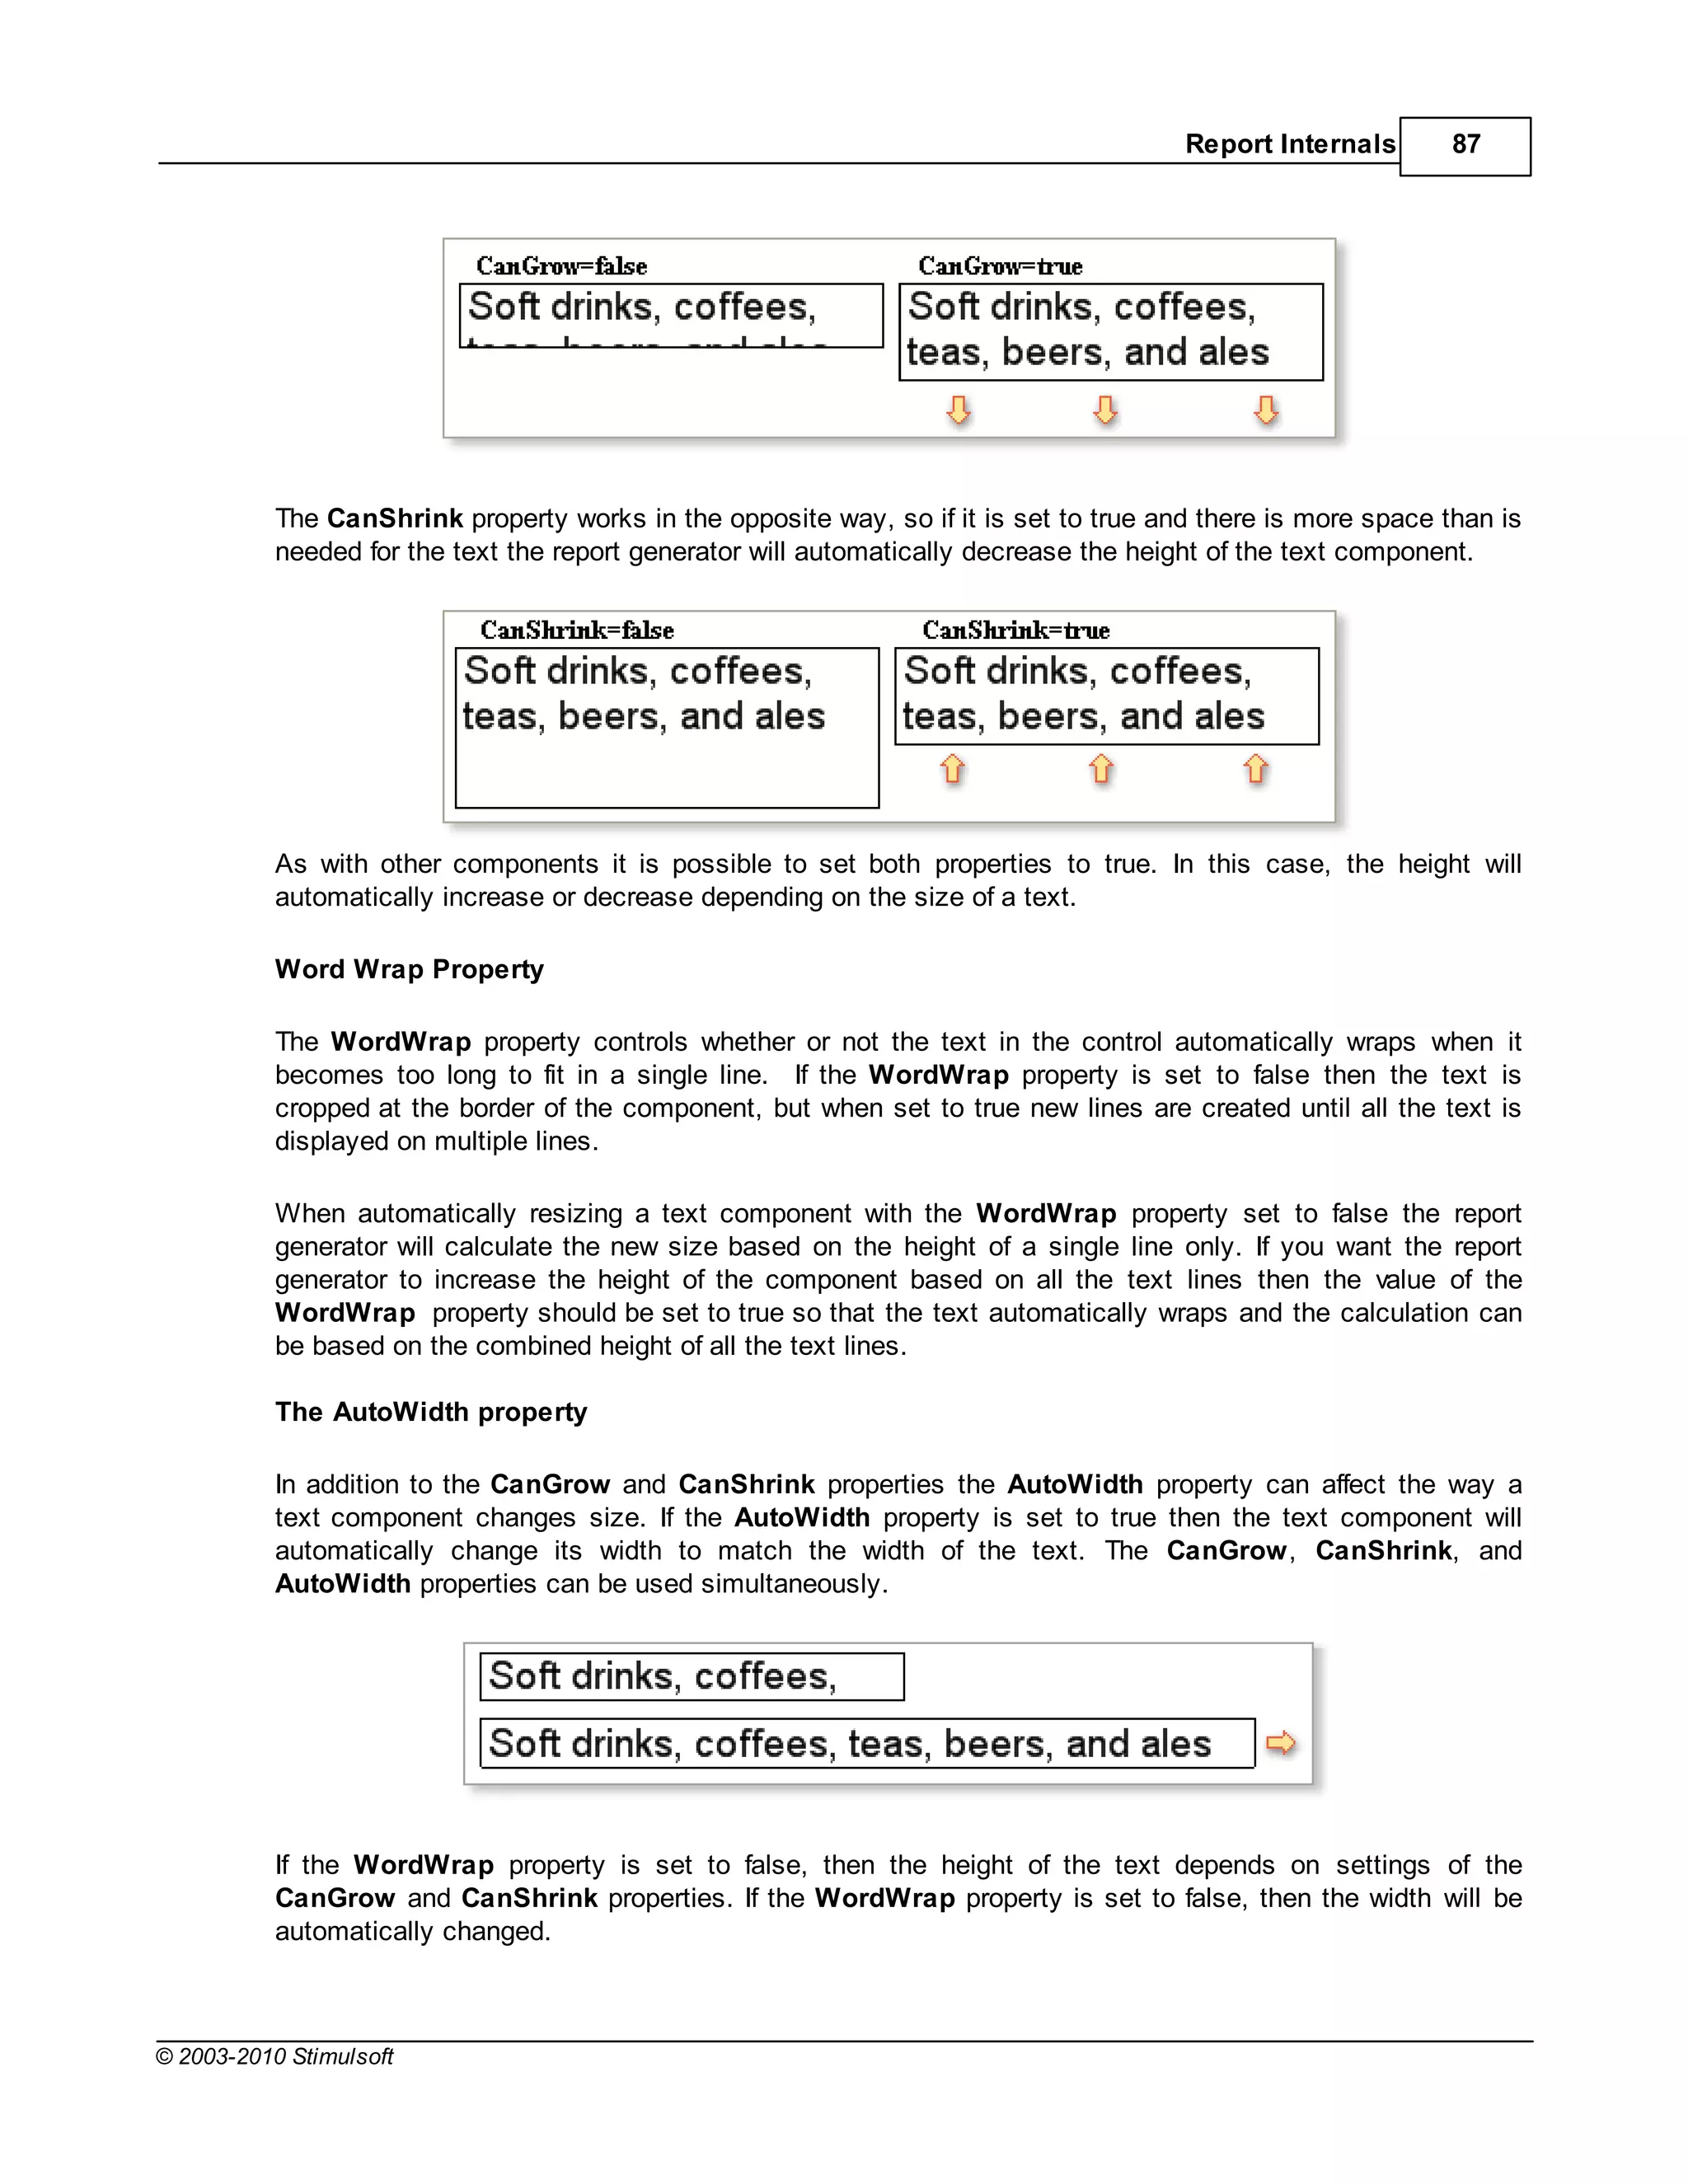
Can Grow
If the CanGrow property is set to true the component can automatically increase its size if the
information contained within it does not fit in the space available. If it is set to false the information will be
cropped to the component size, as in the examples below:
© 2003-2010 Stimulsoft](https://image.slidesharecdn.com/usermanual-100720093903-phpapp01/75/User-manual-85-2048.jpg)

![Report Internals 113
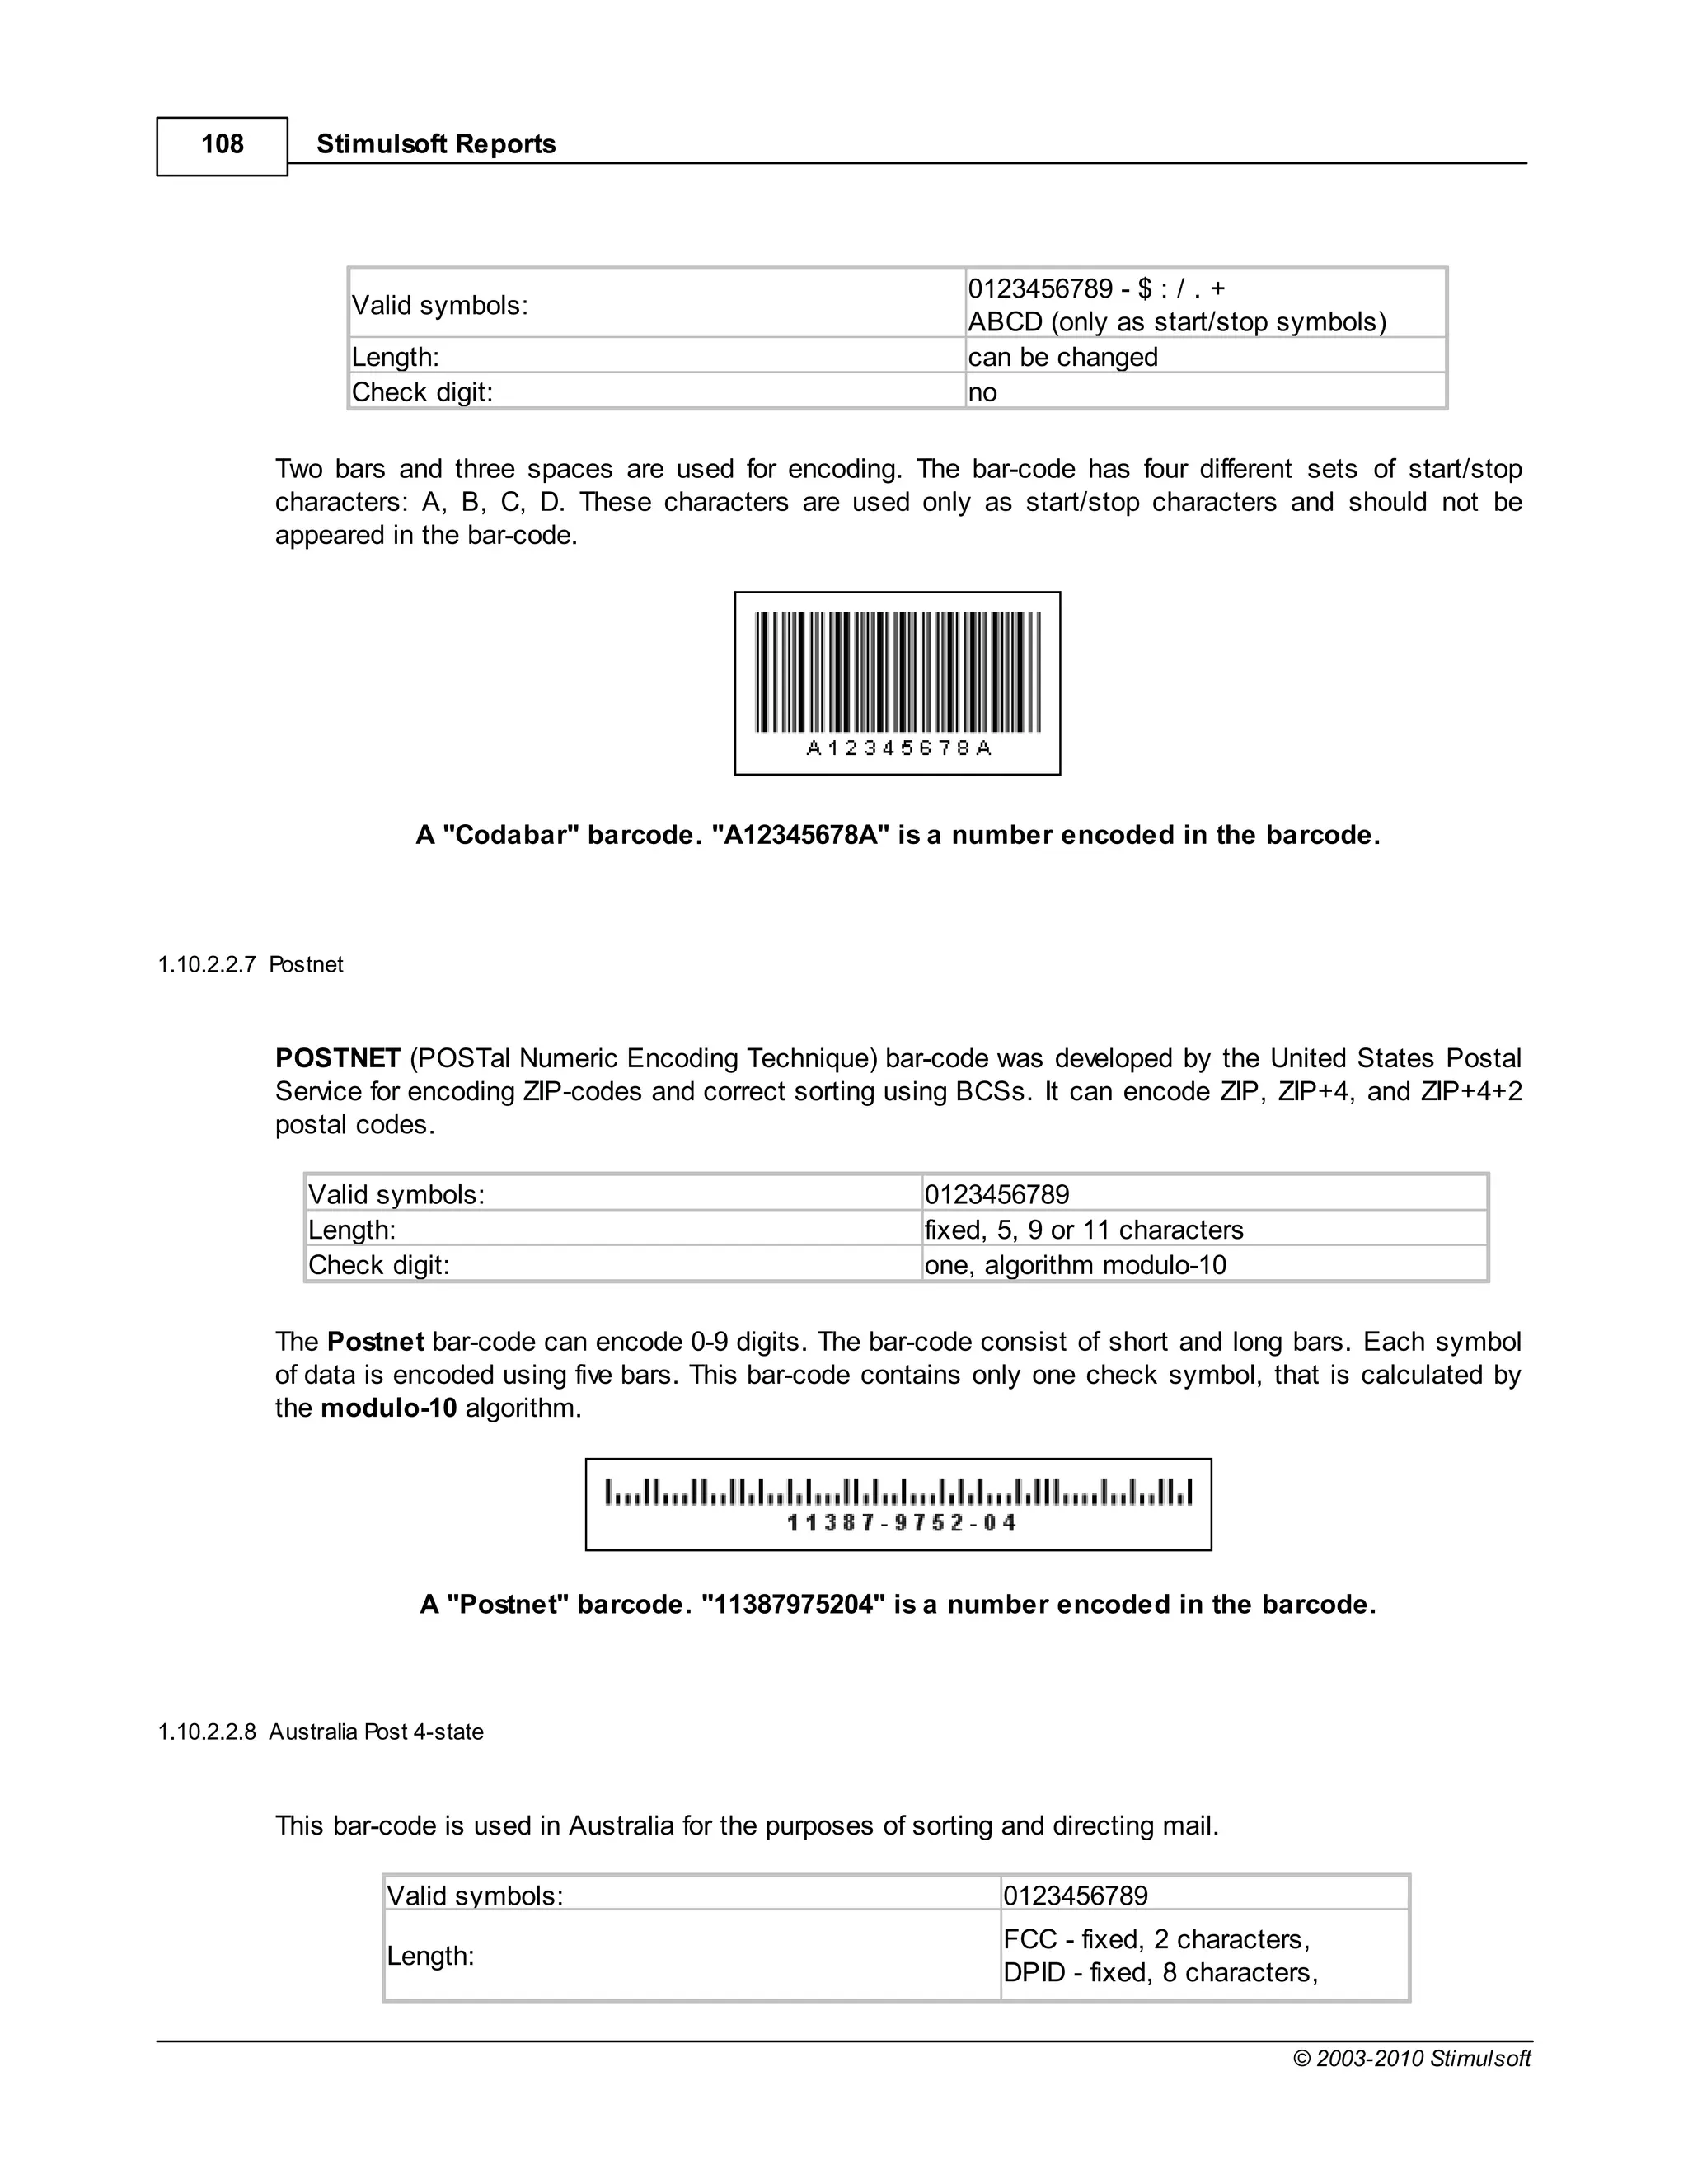
Codabar var - - + -$:/.+
Postnet 5, 9, 11 1 modulo-10 +
Australia Post 10[+var] 4 ReedSolomon +
Code 11 var 0-2, A modulo-11 + -
Code 39 var 0-1 modulo-43 + + - . $ / + % space
Code 39 ext var 0-1 modulo-43 + + + full ASCII
Code 93 var 2 modulo-47 + + -.$/+% space
Code 93 ext var 2 modulo-47 + + + full ASCII
Code128a var 1 modulo-103 + + ASCII 0 to 95
Code128b var 1 modulo-103 + + + ASCII 32 to 127
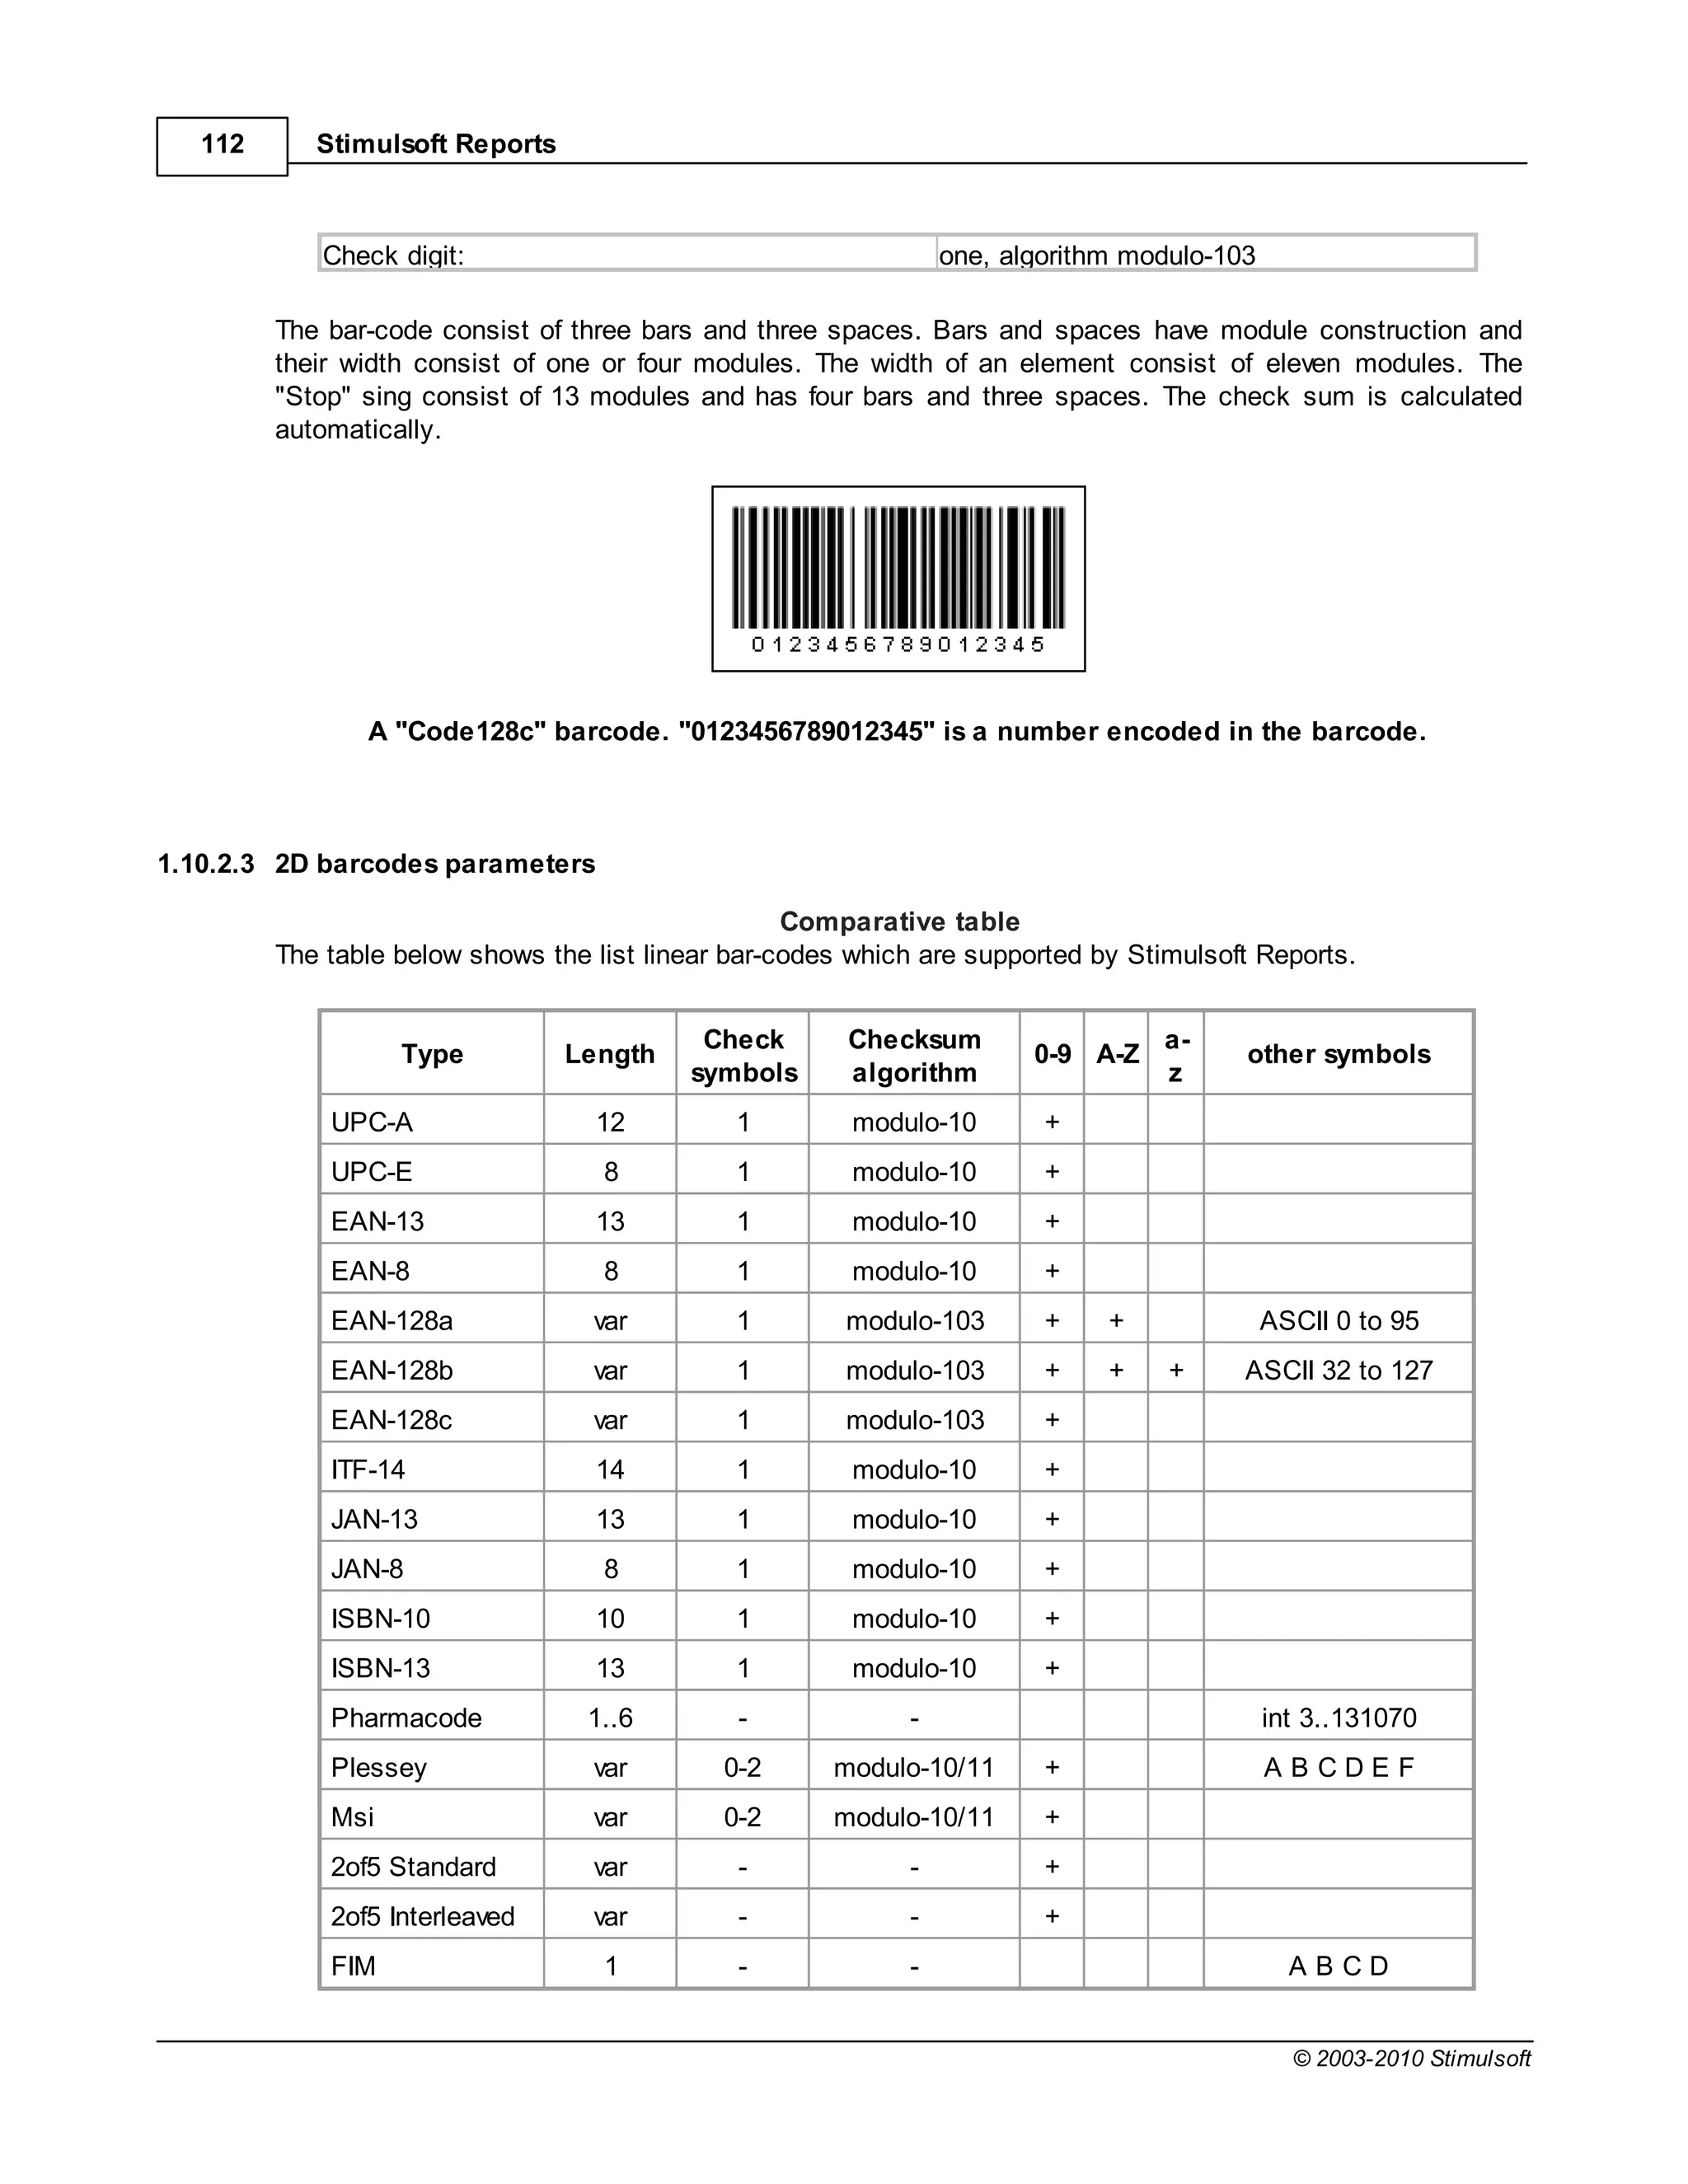
Code128c var 1 modulo-103 +
Explanation:
"Length" - is the data length, it is the number of characters, which can the bar-code can encode; "var"
means the variable length.
"Check symbols" - possible number of check digits; " " means that number of check digits can be
chosen automatically.
"Checksum algorithm" - the algorithm for calculating check digits.
"0-9", "A-Z", "a-z" - ranges of symbols; + means that the bar-code can encode characters of this
range.
"other symbols" - other symbols which the bar-code can encode.
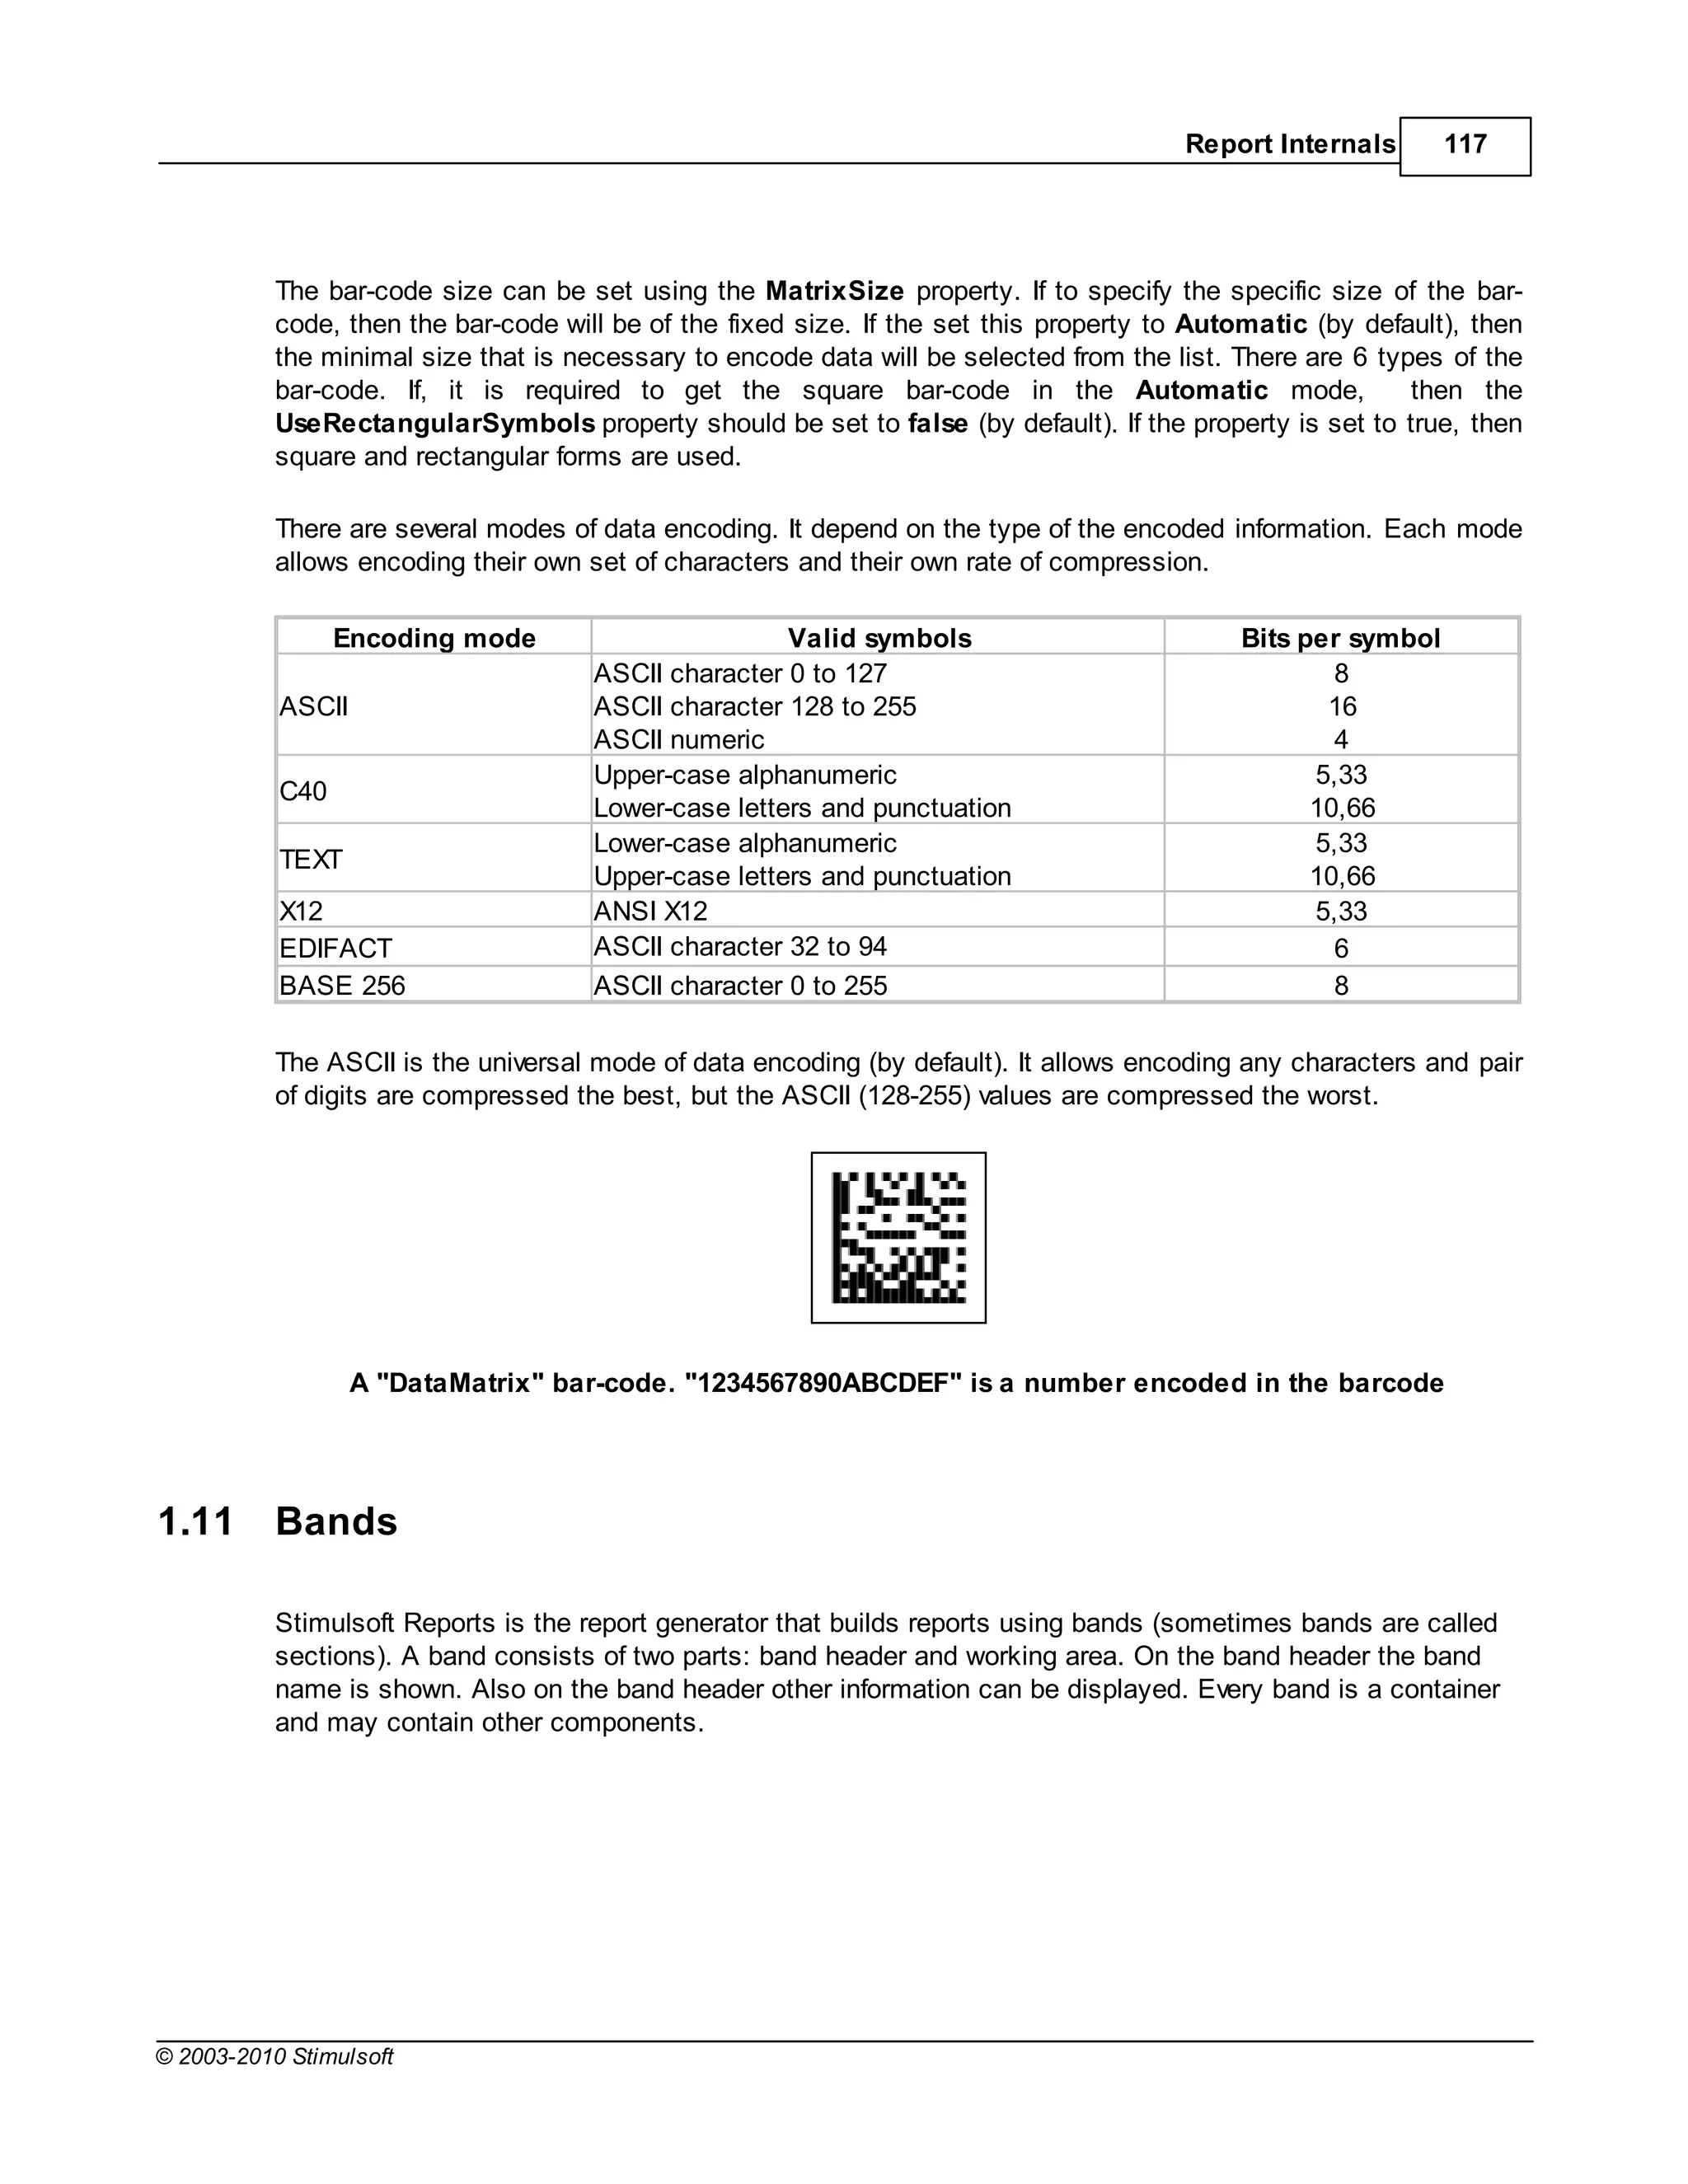
Minimal sizes
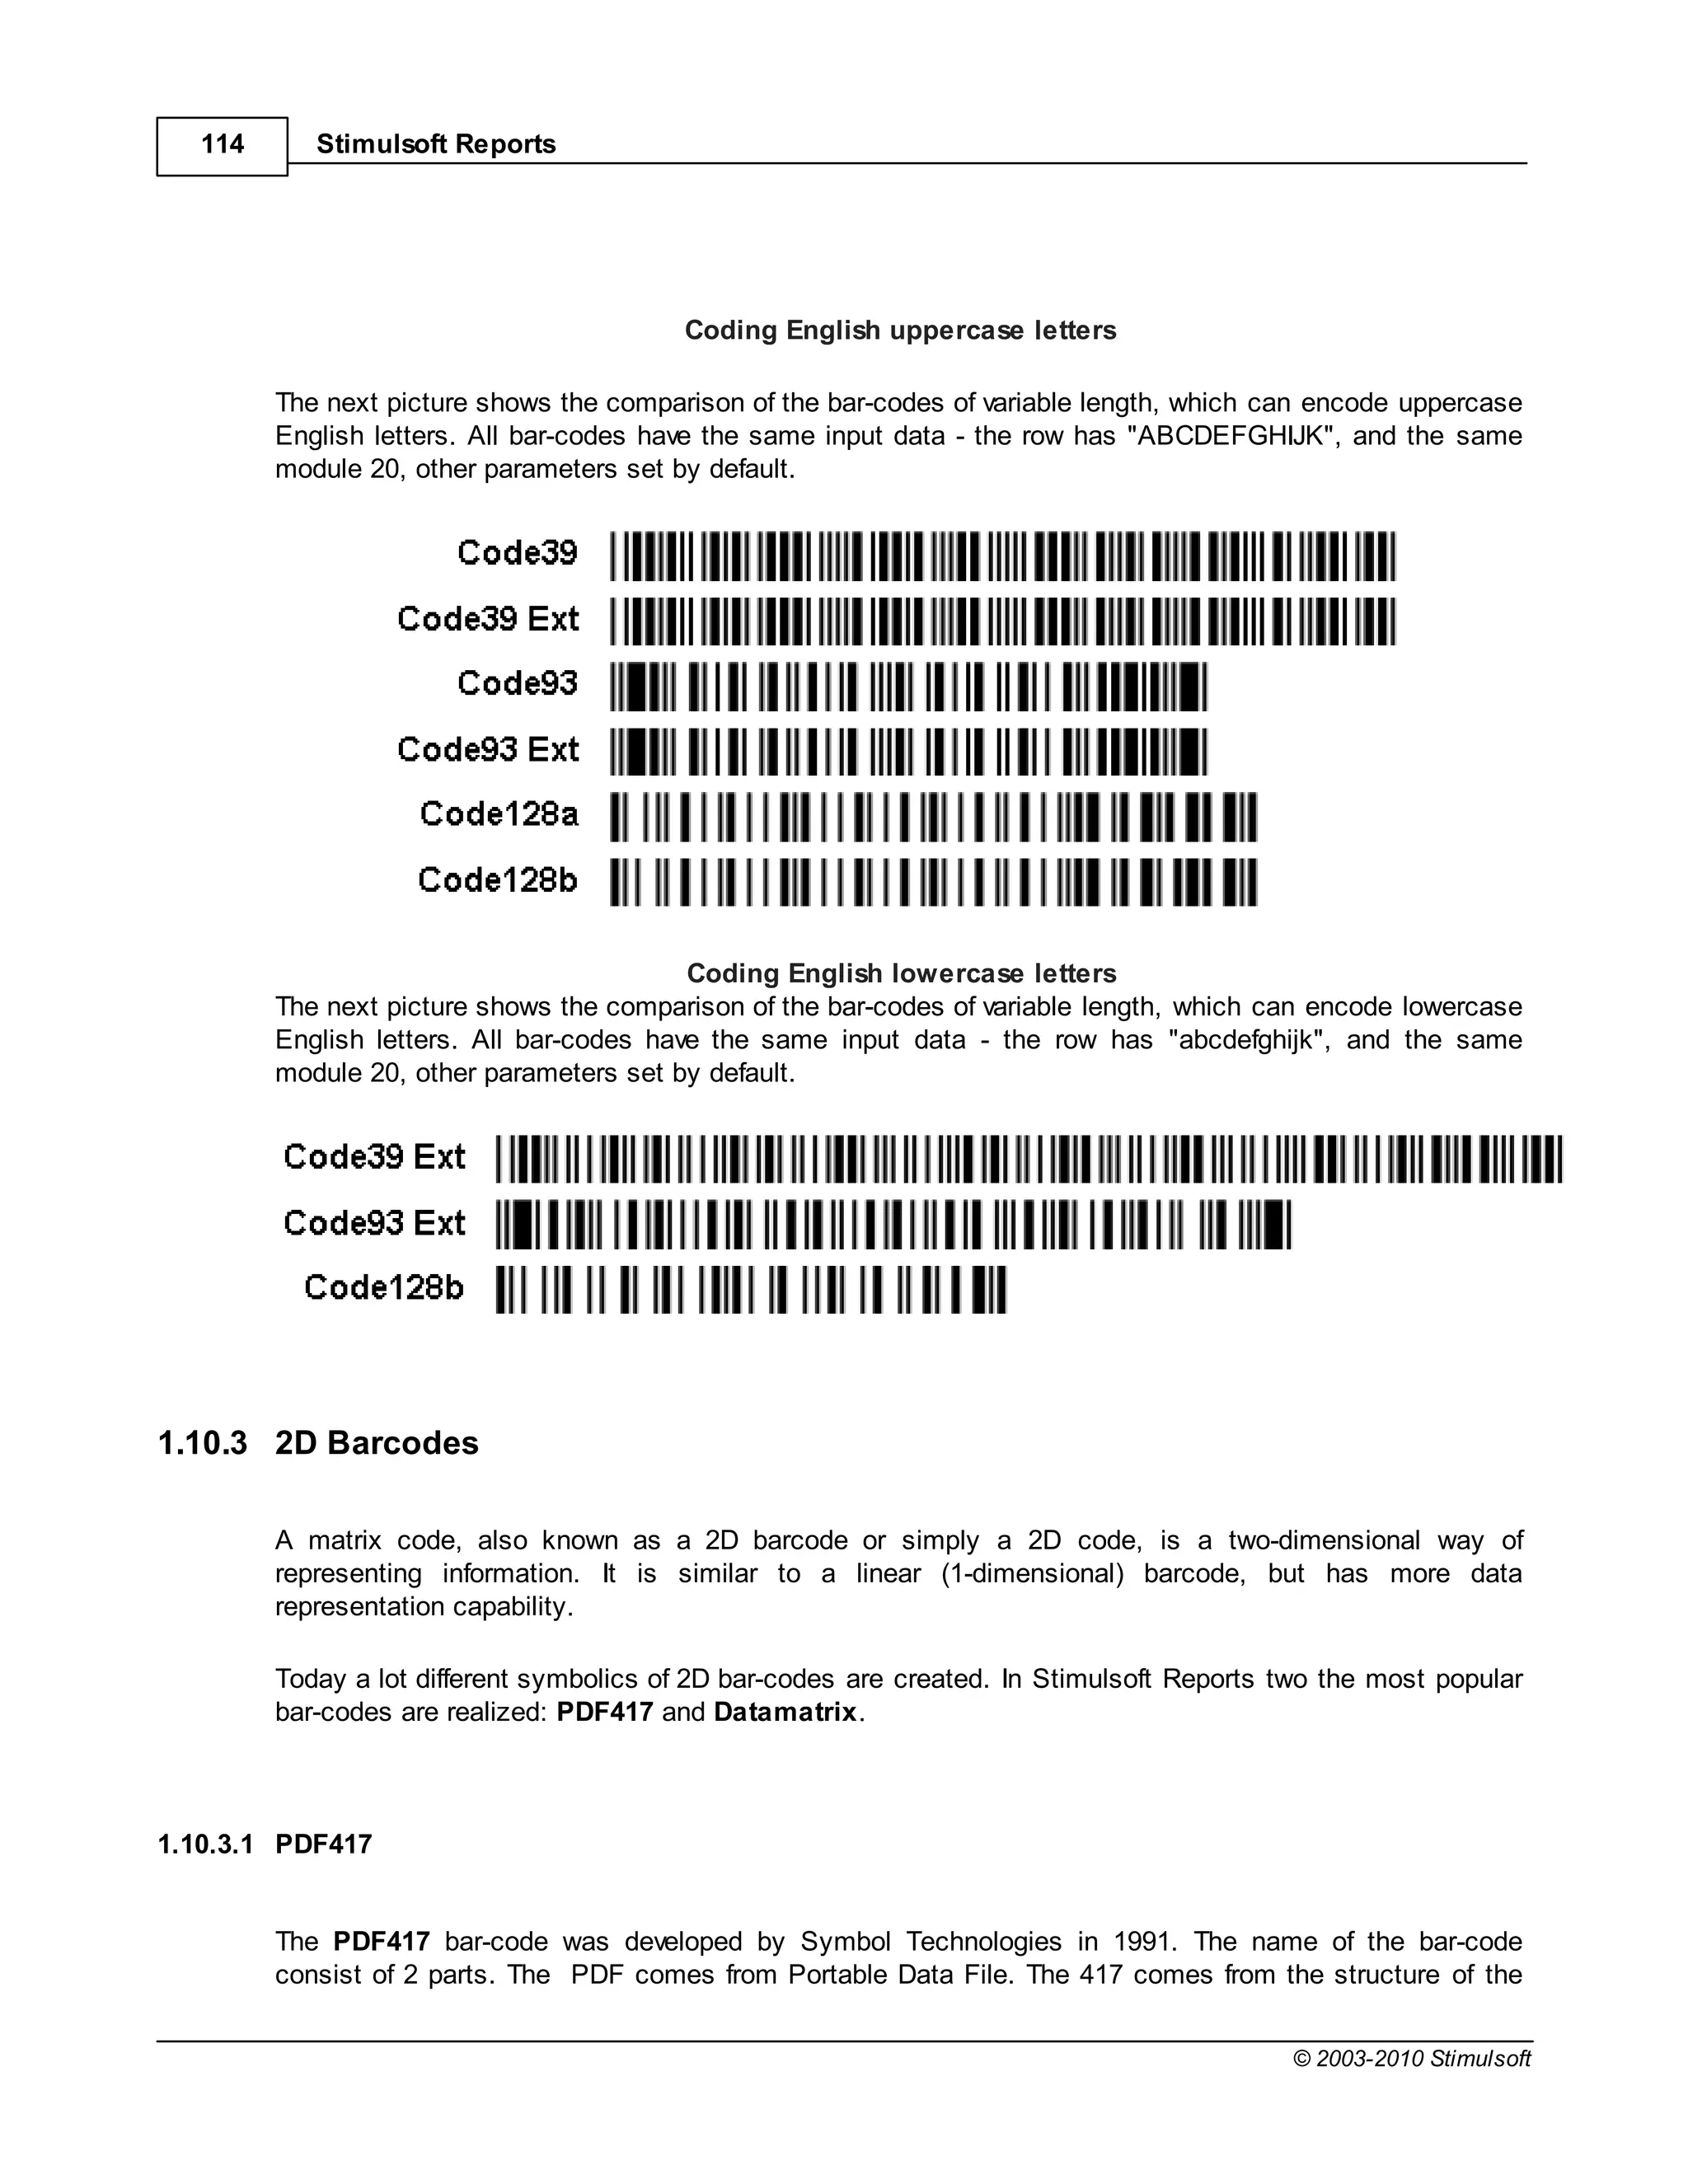
The following picture shows the comparison of bar-codes of variable length, which can encode the
numbers 0 to 9. All bar-codes have the same input data - the row has "ABCDEFGHIJK", and the same
module 20, other parameters set by default.
© 2003-2010 Stimulsoft](https://image.slidesharecdn.com/usermanual-100720093903-phpapp01/75/User-manual-113-2048.jpg)


![Report Internals 351
To add a bookmark of the second level to the tree it is necessary write the following code:
Bookmark["My Bookmark"].Add("Bookmark Level2");
...and for the third level:
Bookmark["My Bookmark"]["Level2"].Add("Bookmark Level3");
To create all three bookmarks the code sample shown above can be used. Stimulsoft Reports
automatically checks presence of each bookmark in a tree and will add ones which should be added.
Sometimes it is required to organize navigation using bookmarks. If it is necessary to find components
the Interaction.Bookmark property of these components should be logged. The value of the
Interaction.Bookmark property should be the same with the name of the created bookmark. For
example, add the bookmark:
Bookmark.Add(Customers.CompanyName);
So the values of the Interaction.Bookmark property should be as follow:
{Customers.CompanyName}
As a result all components will be marked with bookmark with the company name. The same company
name will be added to the report tree. And, when clicking on the bookmark node of the report tree, all
components will be found.
© 2003-2010 Stimulsoft](https://image.slidesharecdn.com/usermanual-100720093903-phpapp01/75/User-manual-351-2048.jpg)

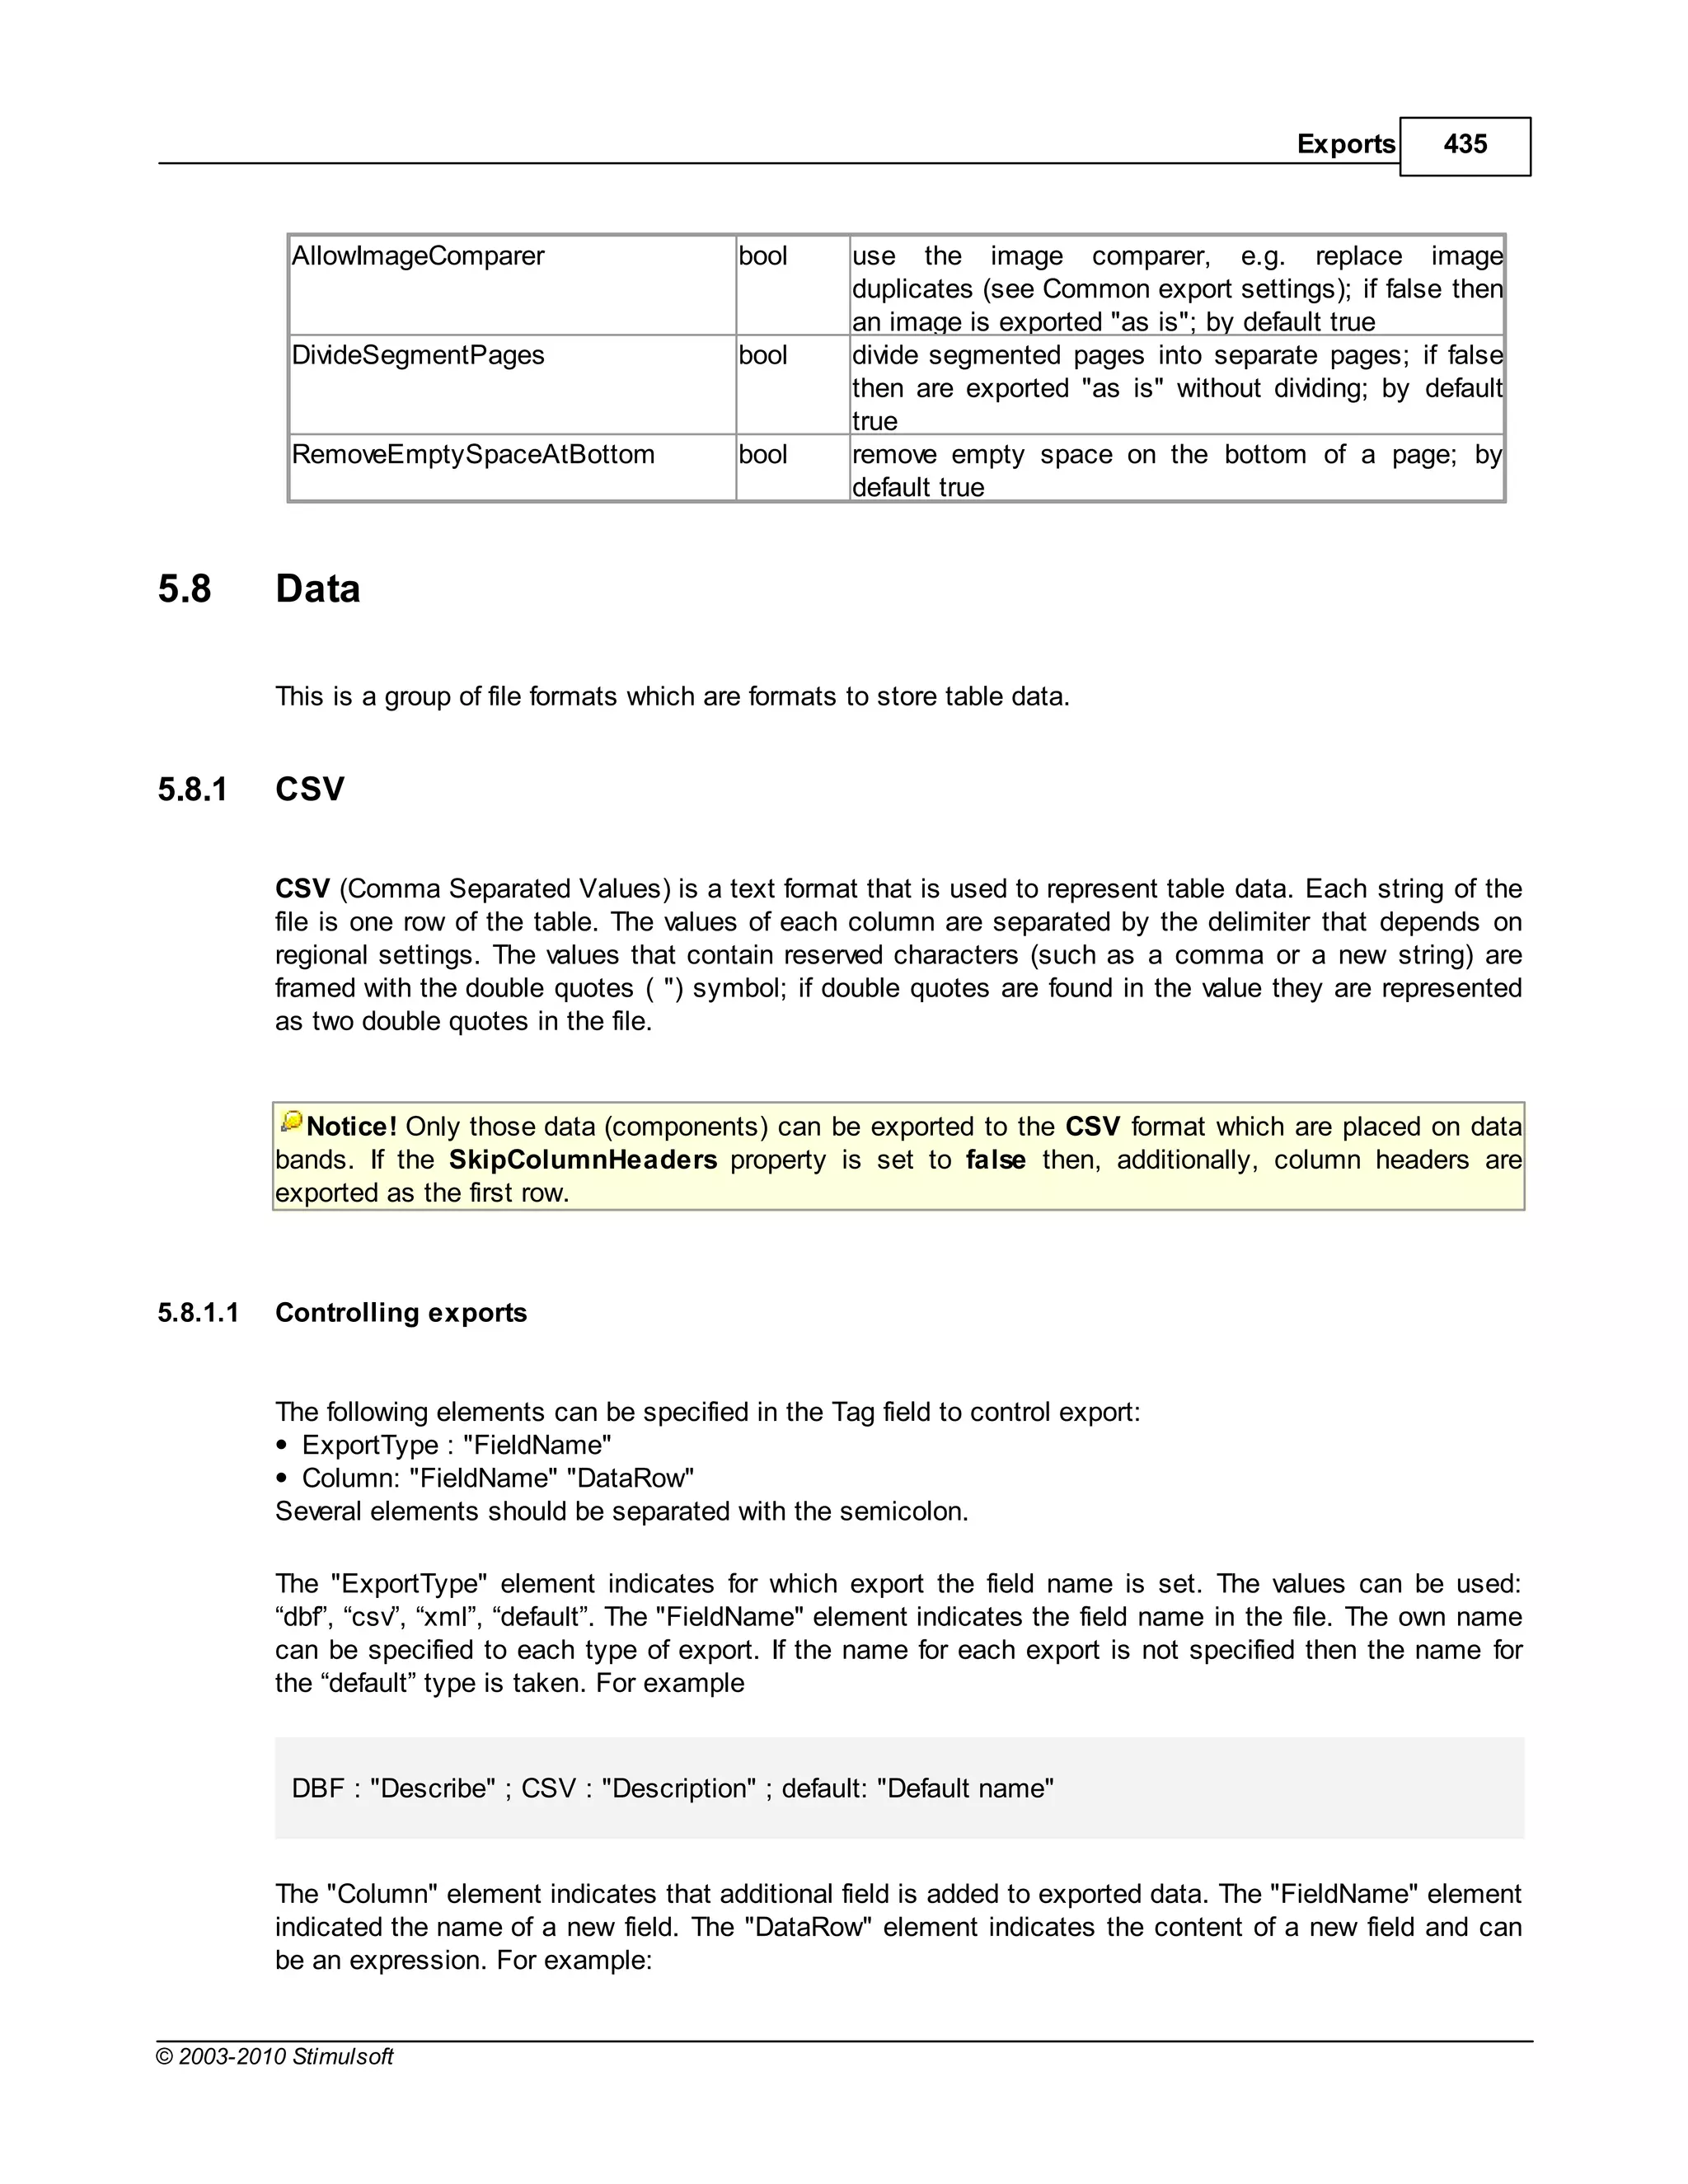
![436 Stimulsoft Reports
Column: "SortField" "{Products.Categories.CategoryName}"
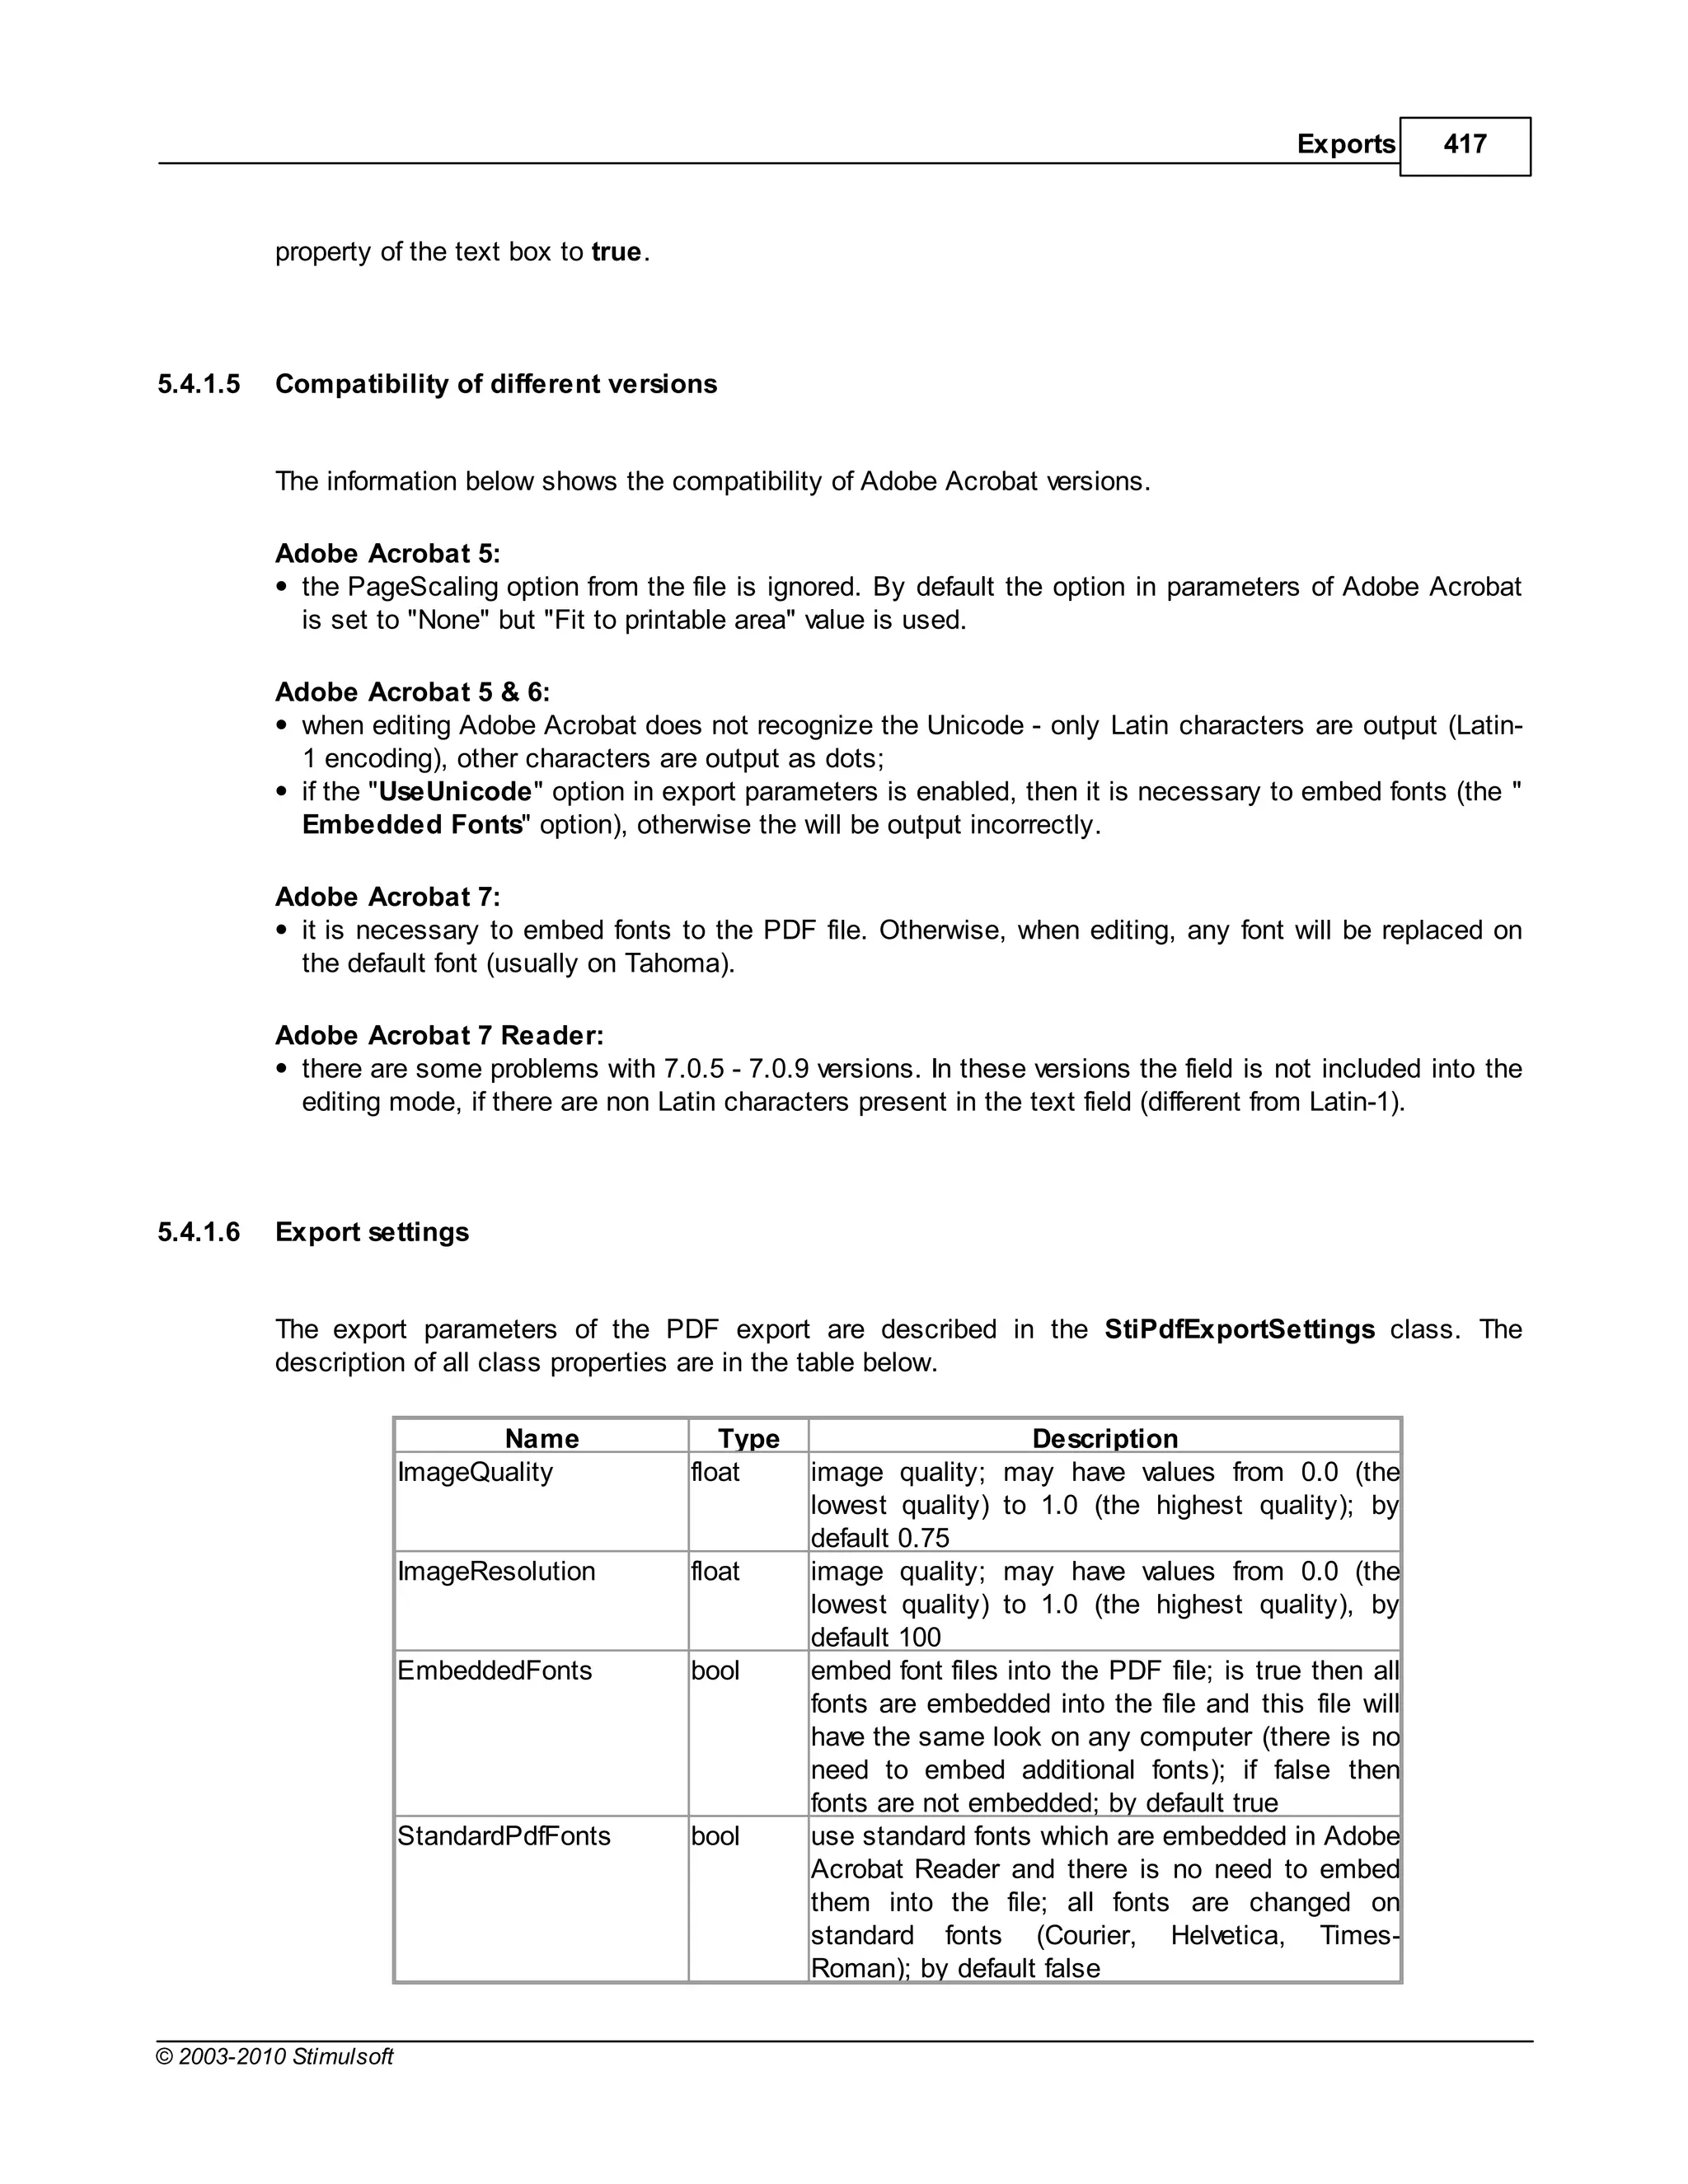
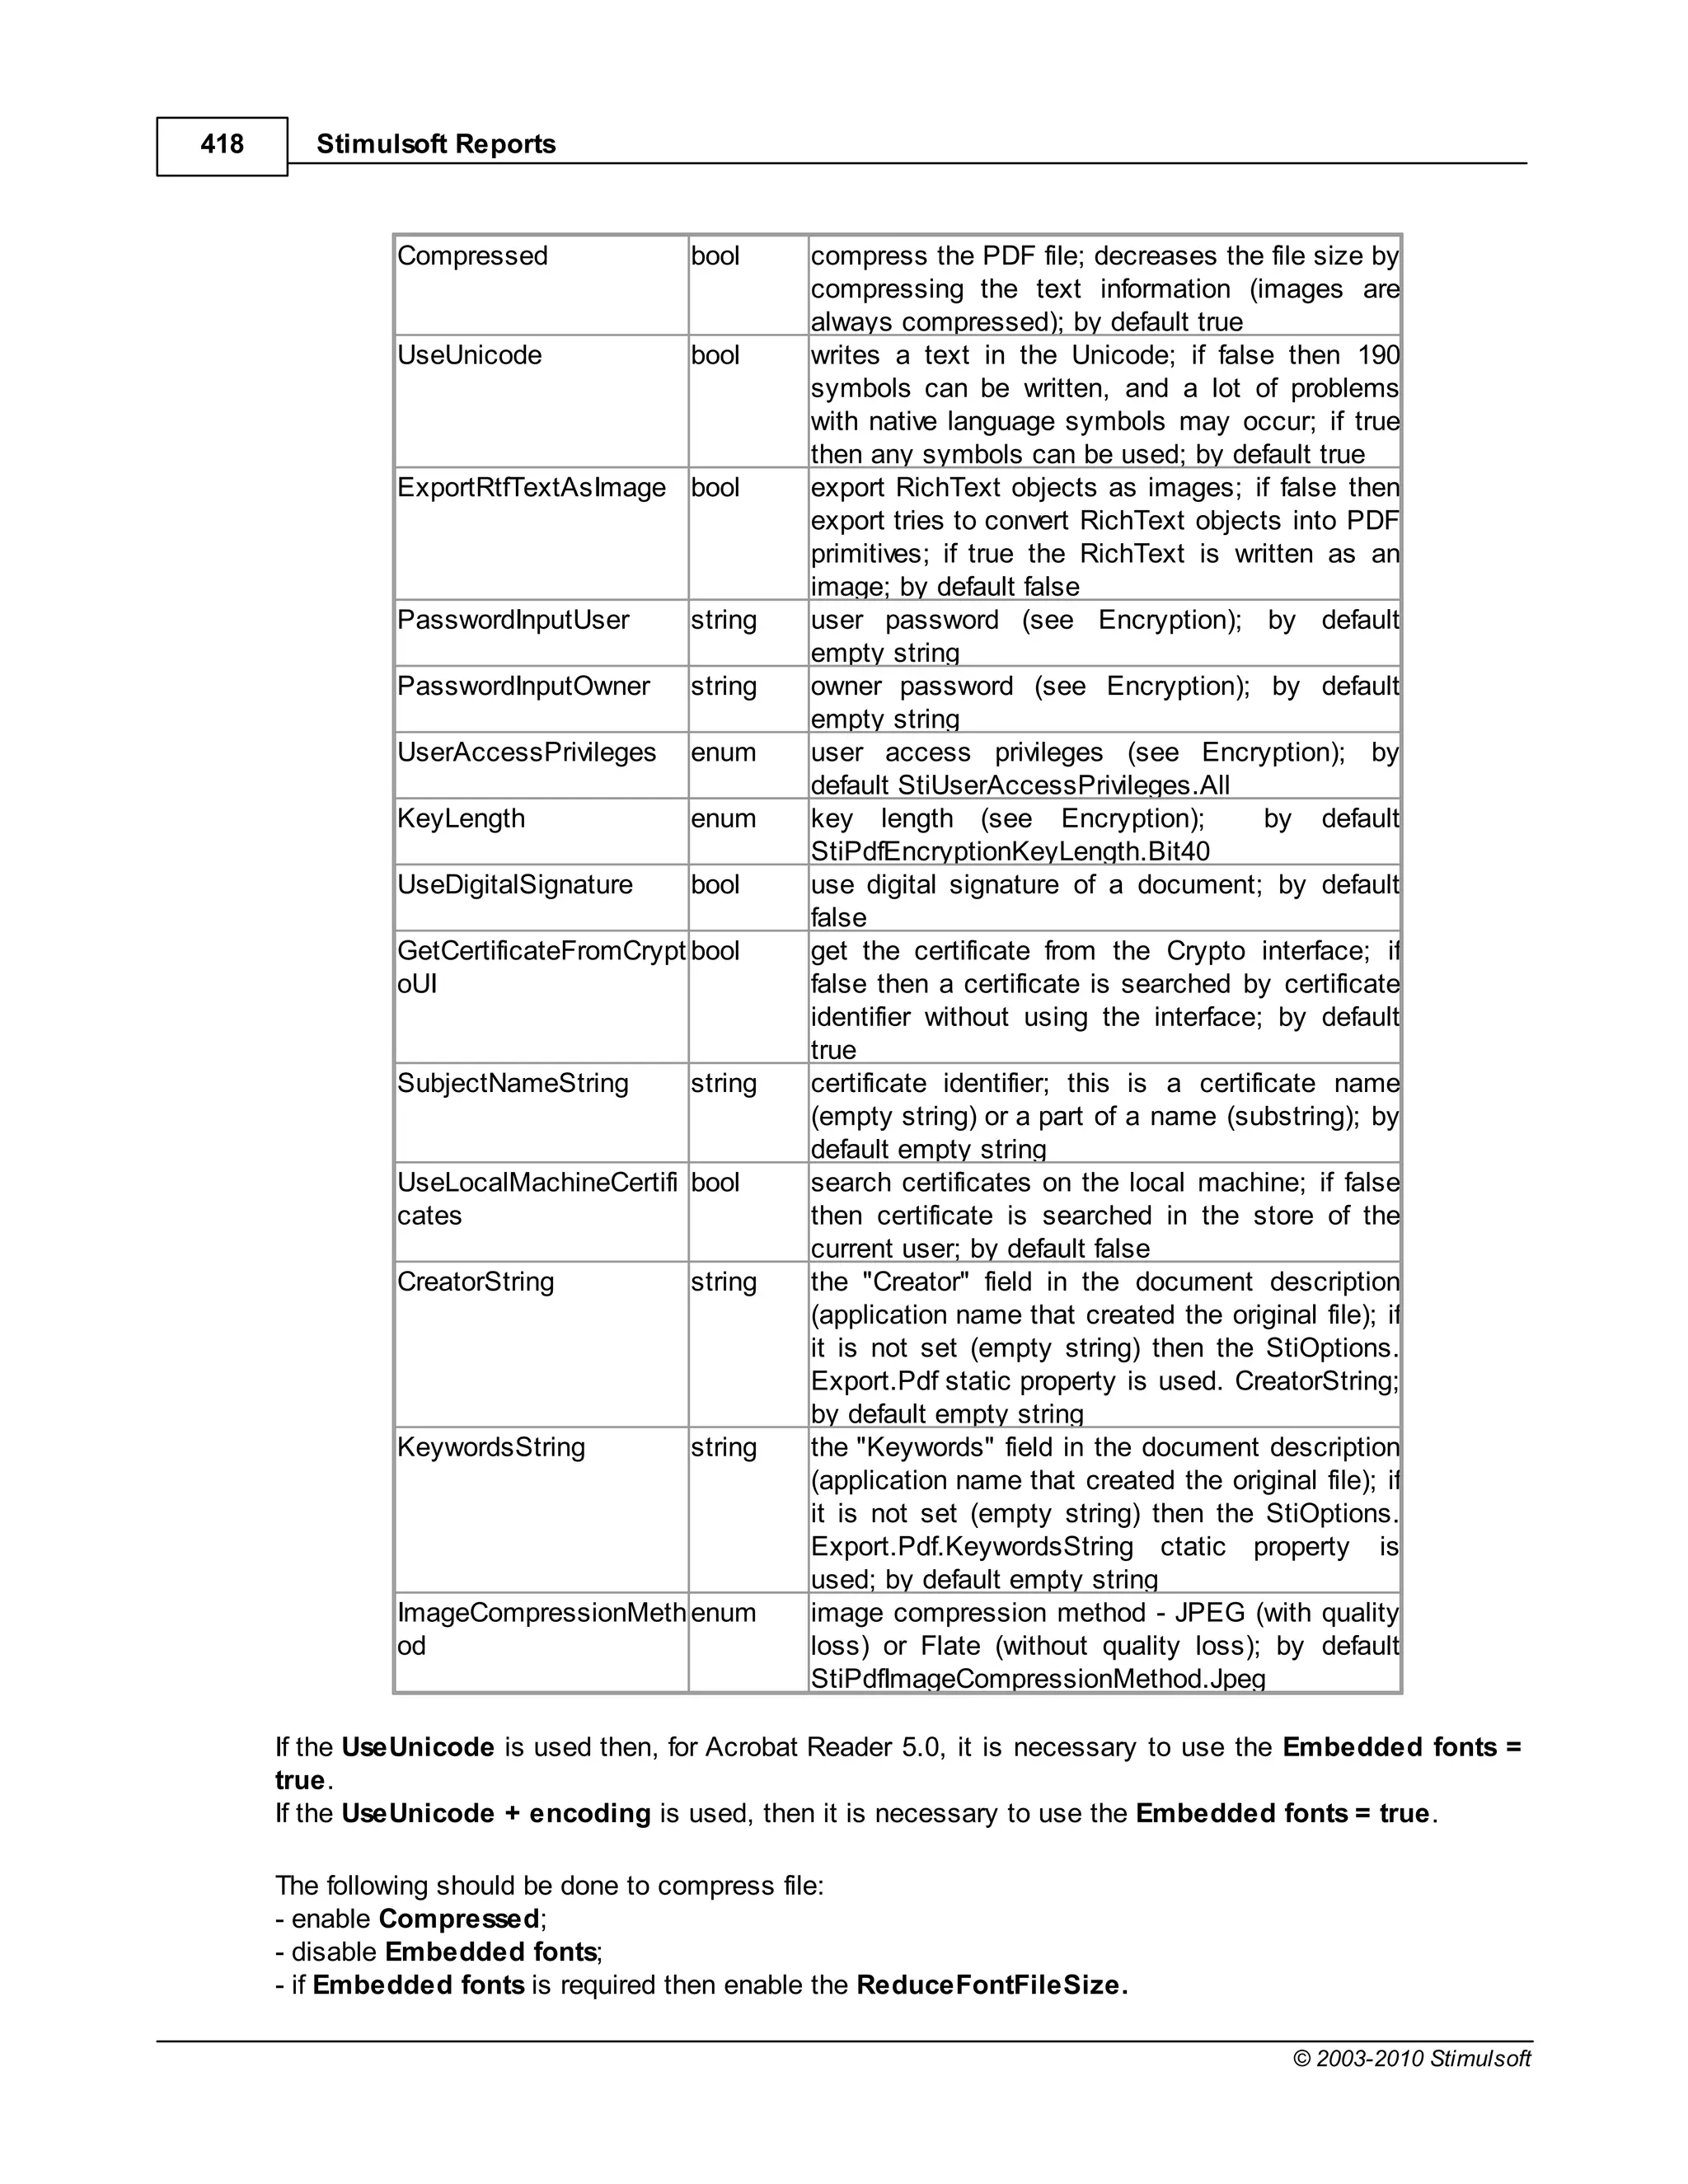
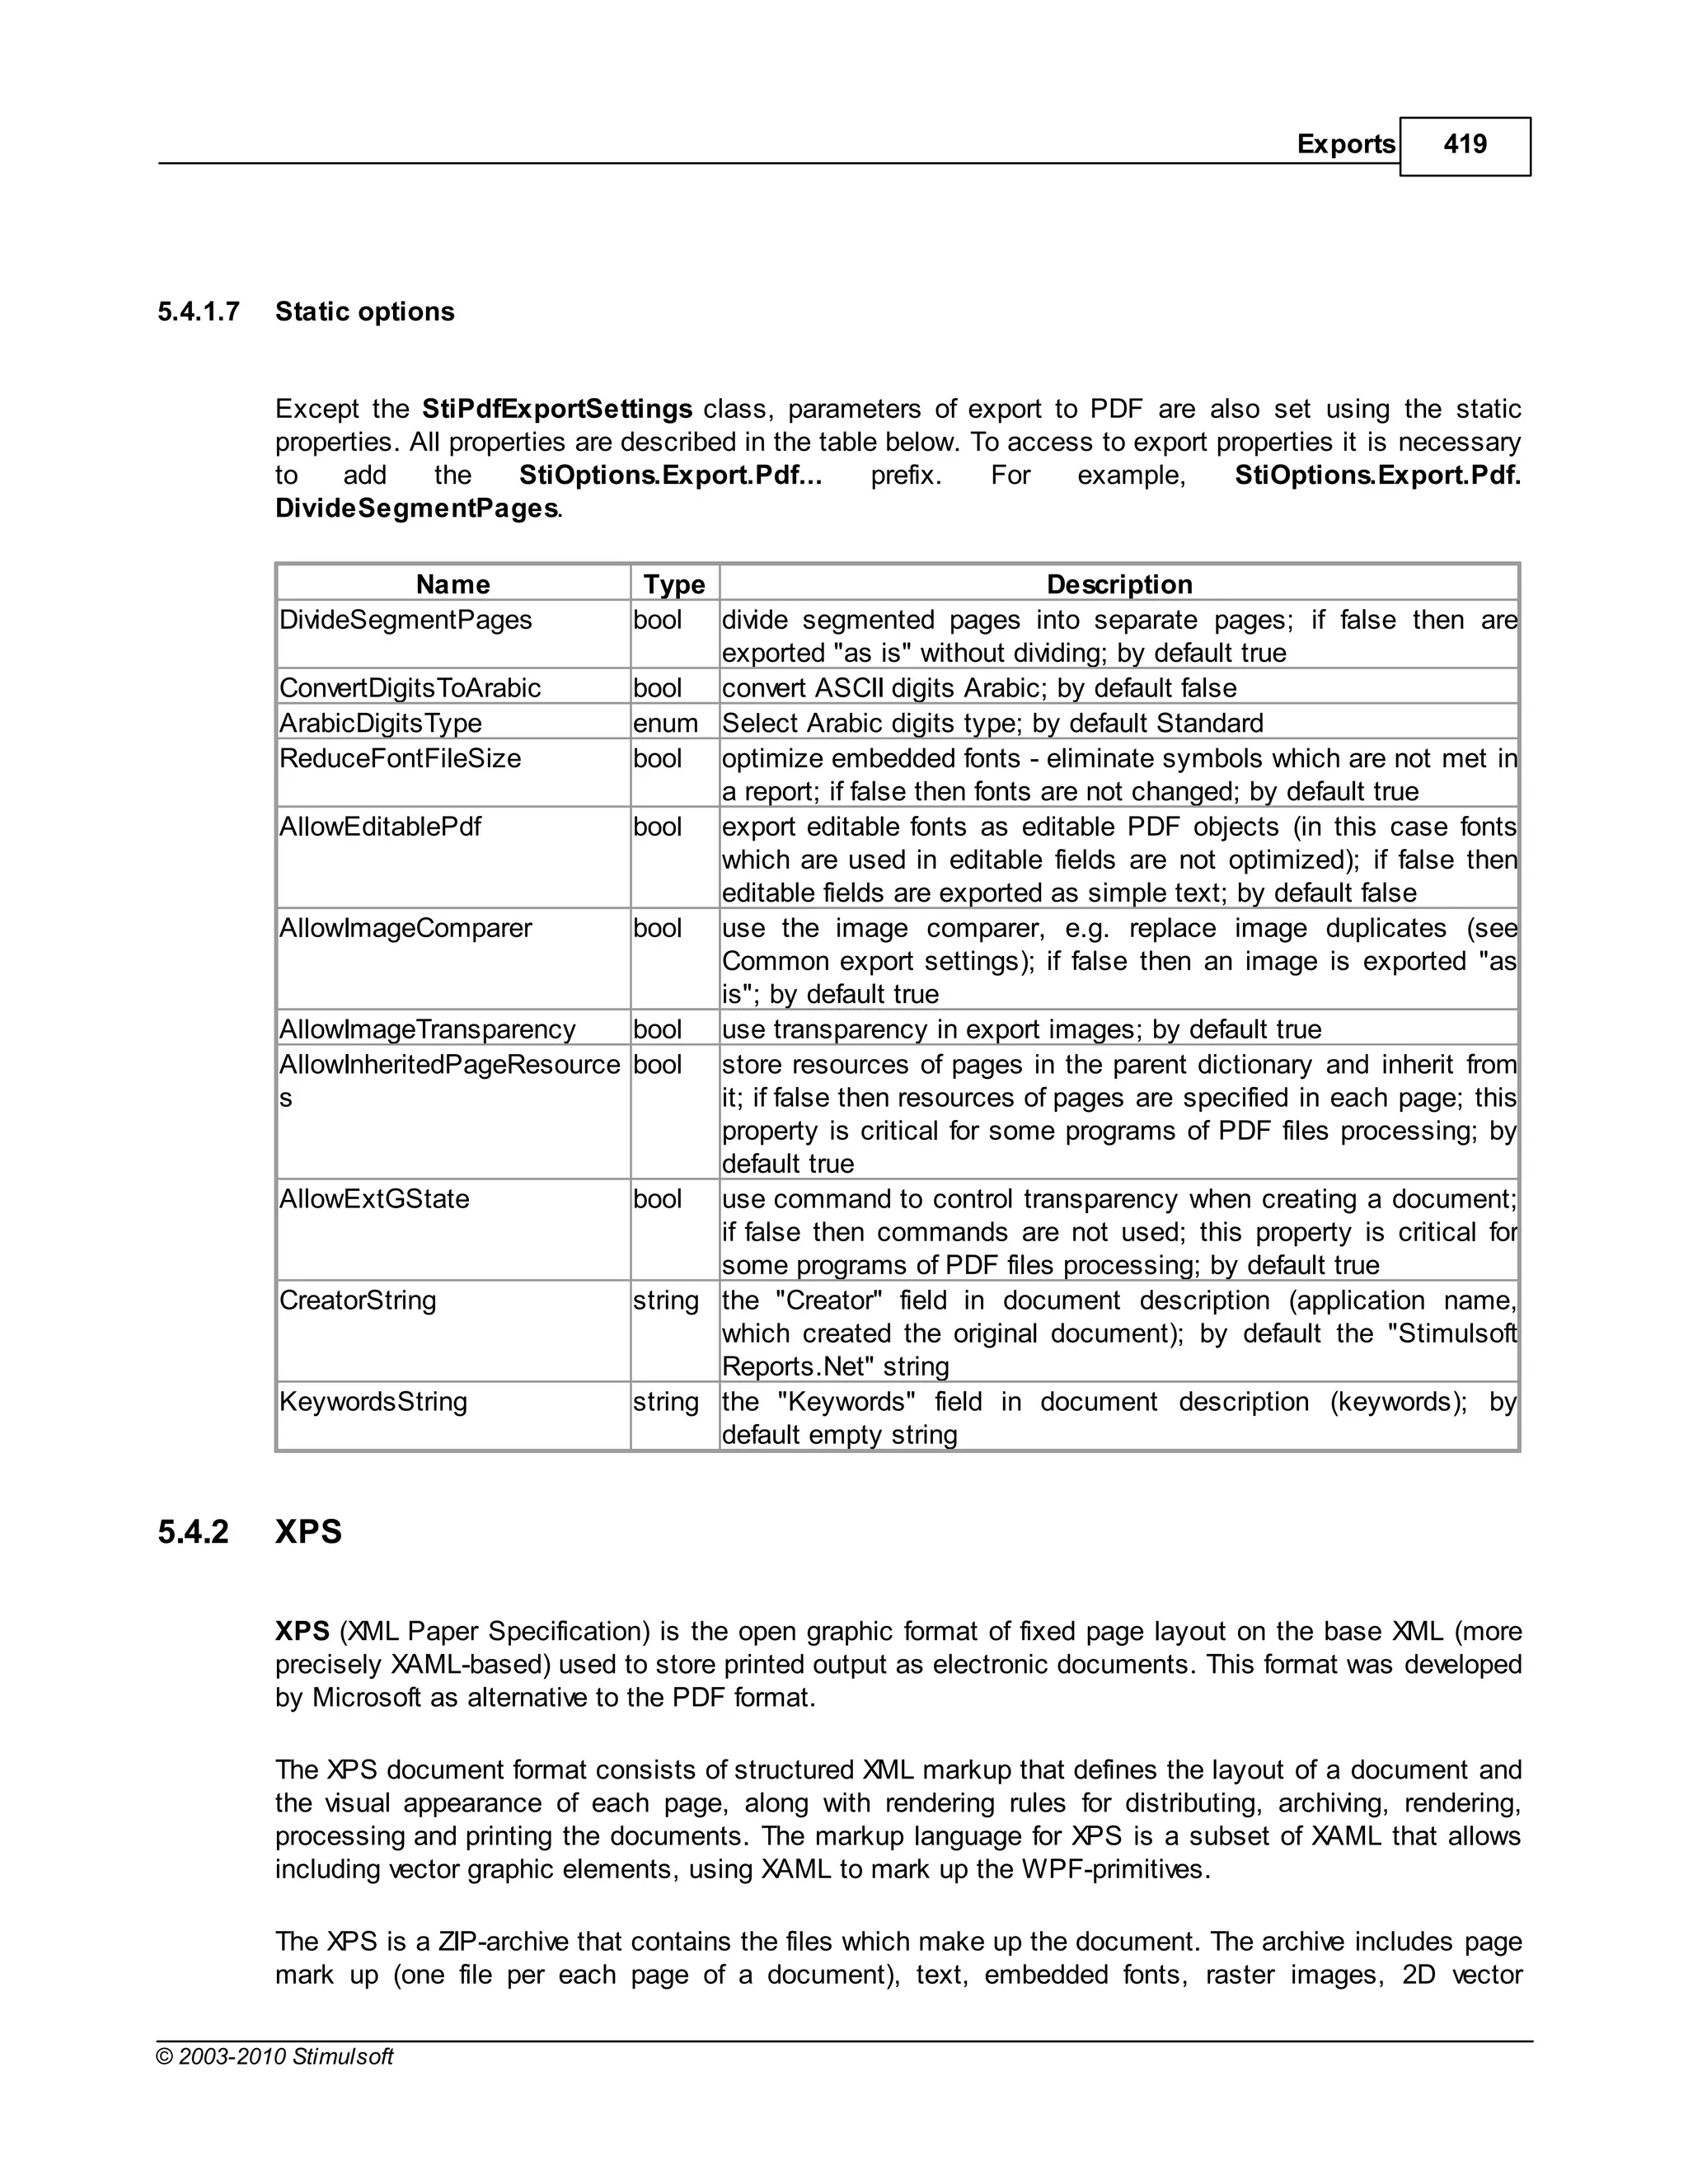
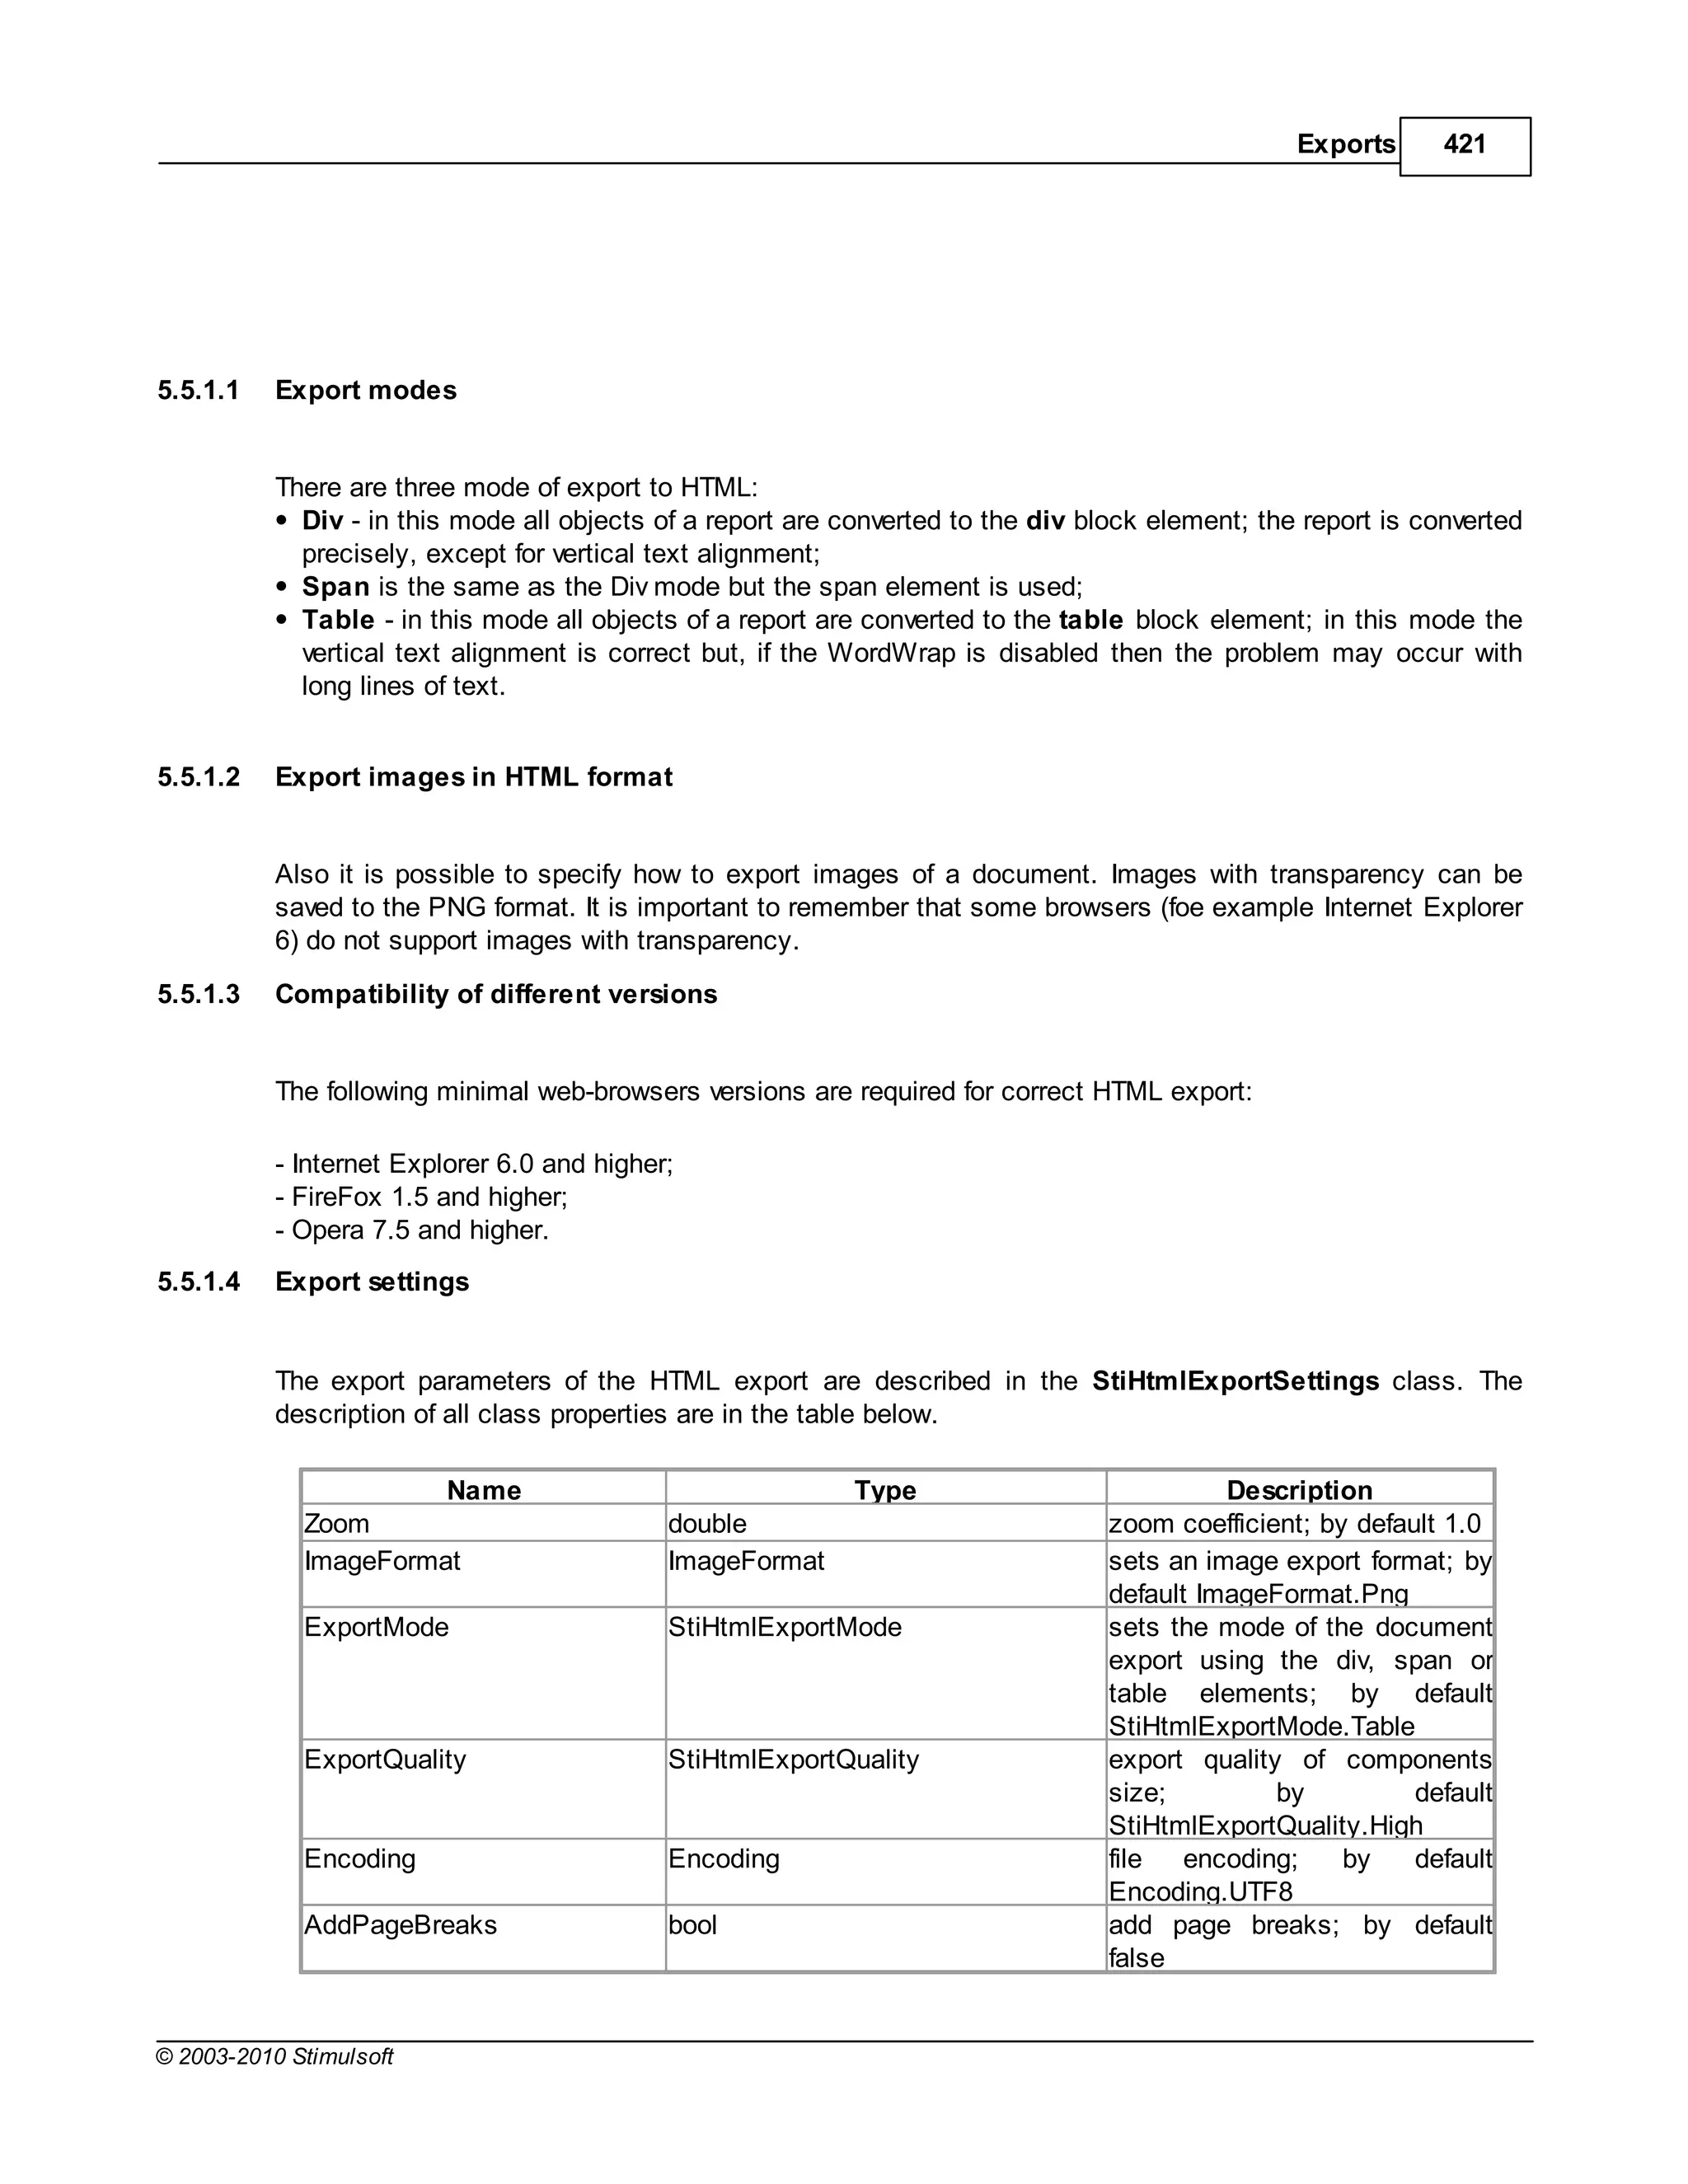
5.8.1.2 Export settings
The export parameters of the CSV export are described in the StiCsvExportSettings class. The
description of all class properties are in the table below.
Name Type Description
Separator string sets the symbol-separator of a list that is used when exporting; by
default CurrentCulture.TextInfo.ListSeparator
Encoding Encoding text file coding; by default Encoding.UTF8
SkipColumnHeaders bool skip headers of columns; by default false
5.8.1.3 Static options
Static properties of export to CSV. To access to export properties it is necessary to add the StiOptions.
Export.Csv... prefix. For example, StiOptions.Export.Csv.ForcedSeparator.
Name Type Description
ForcedSeparator string sets the separator forcibly which are used in
export; if the empty string is set then the symbol
from export settings in used; by default - empty
string
5.8.2 DBF
The DBF (DataBase File) is the format to store data and it is used as the standard way to store and
pass information. The DBF file consist of a header section for describing the structure of the data in the
file. There are several variations on the .dbf file structure.
Notice! Only data can be exported to the DBF format, in other words only the components, which are
placed on data bands.
5.8.2.1 Controlling exports
The following elements can be specified in the Tag field to control export:
DataType [ : FieldLength [ : DecimalPartLength ] ]
ExportType : "FieldName"
Column: "FieldName" "DataString"
Several elements should be separated with the semicolon. The “DataType" element should be only one
and should be placed first, other elements if necessary.
© 2003-2010 Stimulsoft](https://image.slidesharecdn.com/usermanual-100720093903-phpapp01/75/User-manual-436-2048.jpg)


![C sharp programming[1]](https://cdn.slidesharecdn.com/ss_thumbnails/csharpprogramming1-130330104844-phpapp01-thumbnail.jpg?width=640&height=640&fit=bounds)


