Download to read offline
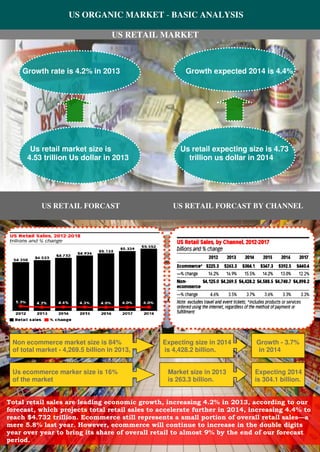
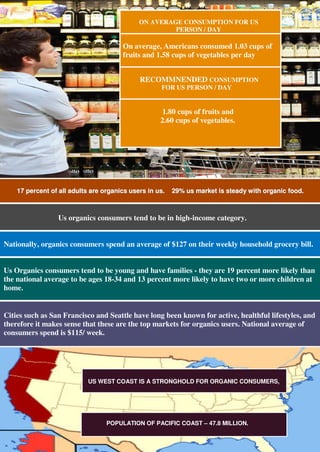
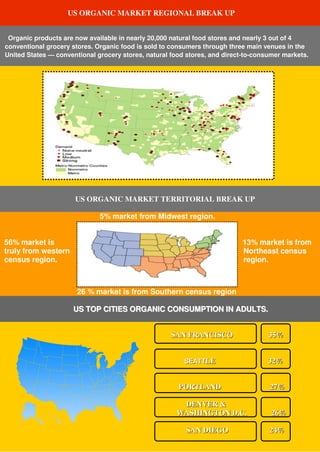
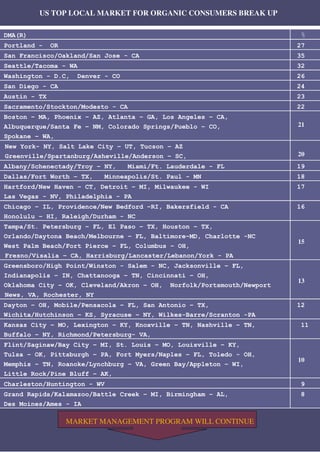

The US organic food market has shown strong double-digit growth in recent decades and was estimated to reach over $35 billion in 2013, accounting for 4% of total US food sales. Organic food purchases now account for about 43% of total at-home US food sales. Certified organic farmland has also expanded but not as fast as organic food sales. Two major US retailers recently announced initiatives to expand their organic product offerings, which could further boost demand. The western US, particularly cities like San Francisco, Portland, and Seattle, have the highest rates of organic consumers.


