Recommended

Recommended
More Related Content
Featured
Featured (20)
URCADCO
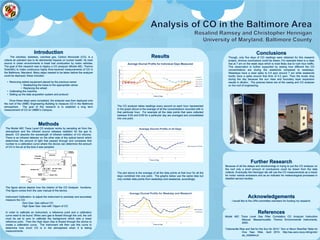
- 1. 0 0.1 0.2 0.3 0.4 0.5 0.6 0.7 0 5 10 15 20 ConcentrationofCO(ppm) Time of Day Average Diurnal Profile for Individual Days Measured 4/9/14 4/10/14 4/11/14 4/12/14 4/13/14 0 0.05 0.1 0.15 0.2 0.25 0.3 0.35 0.4 0.45 0.5 0 5 10 15 20 ConcentrationofCO(ppm) Time of Day Average Diurnal Profile of all Days Average of all Days 0 0.05 0.1 0.15 0.2 0.25 0.3 0.35 0.4 0.45 0.5 0 5 10 15 20 ConcentrationofCO(ppm) Time of Day Average Diurnal Profile for Weekday and Weekend Weekday Weekend