Download to read offline
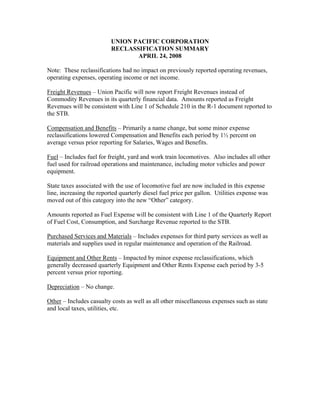
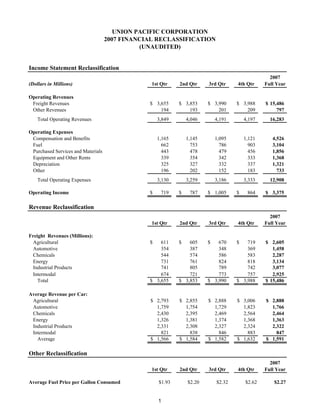
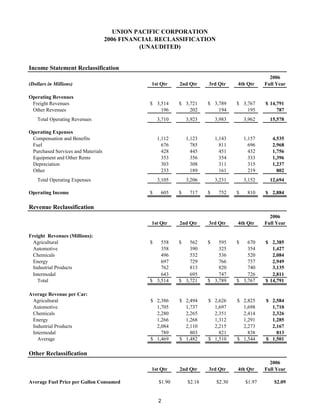
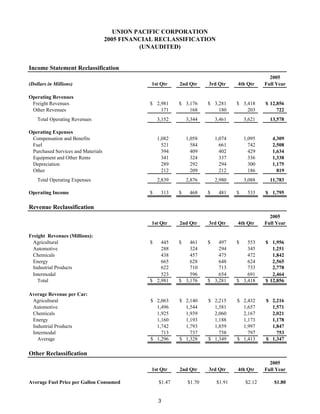
Union Pacific announced reclassifications to several items on its income statement for 2008 and prior years. Freight Revenues replaced Commodity Revenues as the label for line 1 operating revenues. Compensation and Benefits was also renamed but decreased slightly due to minor reclassifications. Fuel now includes locomotive fuel costs and taxes, as well as other fuel used for operations. Utilities were moved out of Fuel into the new Other category. Purchased Services and Materials, Equipment and Other Rents, Depreciation, and Other were also impacted by minor changes. These reclassifications had no impact on previously reported operating revenues, expenses, income or net income.


