Download to read offline

![V
Emissions Gap Report 2023: Broken Record
The United Nations Environment Programme (UNEP) would
like to thank the members of the steering committee, the lead
and contributing authors, the reviewers and the Secretariat
for their contribution to the preparation of this assessment
report. Authors and reviewers have contributed to the report
in their individual capacities. Their affiliations are only
mentioned for identification purposes.
Steering committee
Muna Alamoodi (Ministry of Climate Change and Environment,
United Arab Emirates), Juliane Berger (German Environment
Agency), Ruta Bubniene (Secretariat of the United Nations
Framework Convention on Climate Change [UNFCCC]); John
Christensen (UNEP Copenhagen Climate Centre [UNEP-
CCC]), María Paz Cigaran (Libélula); Navroz K. Dubash (Centre
for Policy Research), Simon Evans (Carbon Brief) (steering
committee observer), Jian Liu (UNEP), Gerd Leipold (Climate
Transparency) (steering committee observer), Simon
Maxwell (independent), Shonali Pachauri (International
Institute for Applied Systems Analysis [IIASA]); Dan Plechaty
(ClimateWorks Foundation), Katia Simeonova (independent),
Youba Sokona (Intergovernmental Panel on Climate Change
[IPCC]), Oksana Tarasova (World Meteorological Organization)
and Iman Ustadi (Office of the UAE Special Envoy for Climate
Change, United Arab Emirates)
Authors
Chapter 1
Authors: Anne Olhoff (CONCITO – Denmark’s green think
tank, Denmark) and John Christensen (UNEP-CCC, Denmark)
Chapter 2
Lead authors: William F. Lamb (Mercator Research Institute
on Global Commons and Climate Change, Germany; University
of Leeds, United Kingdom of Great Britain and Northern
Ireland) and Minal Pathak (Ahmedabad University, India)
Contributing authors: Lucas Chancel (World Inequality Lab,
Paris School of Economics, France), Monica Crippa (European
Commission, Joint Research Centre [JRC], Italy), Giacomo
Grassi (European Commission, JRC, Italy), Diego Guizzardi
(European Commission, JRC, Italy), Jing Meng (University
College London, United Kingdom), Glen P. Peters (CICERO
Center for International Climate Research, Norway) and Julia
Pongratz (Ludwig-Maximilians University Munich, Germany)
Chapter 3
Lead authors: Takeshi Kuramochi (NewClimate Institute,
Germany), Michel den Elzen (PBL Netherlands Environmental
Assessment Agency, the Netherlands) and Taryn Fransen
(World Resources Institute, United States of America)
Contributing authors: Jesse Burton (University of Cape Town
and E3G, South Africa), Ioannis Dafnomilis (PBL Netherlands
Environmental Assessment Agency, the Netherlands), Ipek
Gençsü (ODI, United Kingdom), Archie Gilmour (ODI, United
Kingdom), Mariana Gutiérrez Grados (Climate Transparency,
Germany), Frederic Hans (NewClimate Institute, Germany),
Sarah Heck (Climate Analytics, Germany), Niklas Höhne
(NewClimate Institute, Germany), Camilla Hyslop (Oxford
University, United Kingdom), Anna Kanduth (Canadian Climate
Institute, Canada), Ben King (Rhodium Group, United States
of America), Hannah Kolus (Rhodium Group, United States
of America), Ho-Mi Lee (Korea Energy Economics Institute,
Republic of Korea), Jared Lewis (Climate Resource, Australia),
Swithin Lui (NewClimate Institute, Germany), Natasha Lutz
(Oxford University, United Kingdom), Andrew Marquard
(University of Cape Town, South Africa), Silke Mooldijk
(NewClimate Institute, Germany), Leonardo Nascimento
(NewClimate Institute, Germany), Analuz Presbítero (Iniciativa
Climática de México [ICM], Mexico), Jazmín Rocco Predassi
(Farn, Argentina), Joeri Rogelj (Imperial College London,
United Kingdom; International Institute for Applied Systems
Analysis [IIASA], Austria), Clea Schumer (World Resources
Institute, United States of America), Alister Self (Climate
Resource, Australia), Kentaro Tamura (Institute for Global
Environmental Strategies [IGES], Japan) and Jorge Villarreal
(ICM, Mexico)
Data contributors: Johannes Gütschow (Potsdam Institute for
Climate Impact Research, Germany), Christopher Henderson
(World Resources Institute, United States of America), Elena
Hooijschuur (PBL Netherlands Environmental Assessment
Agency, the Netherlands), Kimon Keramidas (European
Commission, JRC, Spain), Mia Moisio (NewClimate Institute,
Germany), Mika Pflüger (Climate Resource, Germany) and
Claire Stockwell (Climate Analytics, Germany)
Chapter 4
Lead authors: Joeri Rogelj (Imperial College London, United
Kingdom; IIASA, Austria), Michel den Elzen (PBL Netherlands
Environmental Assessment Agency, the Netherlands) and
Joana Portugal-Pereira (Graduate School of Engineering
[COPPE], Universidade Federal do Rio de Janeiro, Brazil)
Contributing authors: Taryn Fransen (World Resources
Institute, United States of America), Jarmo Kikstra (Imperial
College London, United Kingdom), Robin Lamboll (Imperial
College London, United Kingdom), Malte Meinshausen
(University of Melbourne, Australia) and Isabela Schmidt
Tagomori (PBL Netherlands Environmental Assessment
Agency, the Netherlands)
Data contributors: Ioannis Dafnomilis (PBL Netherlands
Environmental Assessment Agency, the Netherlands) and
Kimon Keramidas (European Commission, JRC, Spain)
Acknowledgements](https://image.slidesharecdn.com/egr2023-231120142833-c45394b7/85/UNEP-Emission-Gap-Report-2023-5-320.jpg)
![VI
Emissions Gap Report 2023: Broken Record
Chapter 5
Lead authors: Jesse Burton (University of Cape Town and
E3G, South Africa) and Greg Muttitt (International Institute for
Sustainable Development [IISD], United Kingdom)
Contributing authors: Fatima Denton (United Nations
University Institute for Natural Resources in Africa, Ghana),
Sivan Kartha (Stockholm Environment Institute, United
States of America), Narasimha Rao (Yale School of the
Environment, Yale University, United States of America),
Joeri Rogelj (Imperial College London, United Kingdom;
IIASA, Austria), Saritha Sudharmma Vishwanathan (Indian
Institute of Management Ahmedabad, India; National
Institute for Environmental Studies, Japan), Dan Tong
(Tsinghua University, China), Marta Torres Gunfaus (IDDRI,
France) and William Wills (Centro Brasil no Clima, Brazil; Eos
Consulting, Brazil)
Chapter 6
Lead authors: Narasimha Rao (Yale School of the
Environment, Yale University, United States of America) and
Yacob Mulugetta (University College London, United Kingdom)
Contributing authors: Jesse Burton (University Cape Town
and E3G, South Africa), Joisa Dutra Saraiva (Getulio Vargas
Foundation [FGV], Brazil), Ashwin Gambhir (Prayas Energy
Group, India), Jessica Omukuti (University of Oxford, United
Kingdom), Nadia S. Ouedraogo (United Nations Economic
Commission for Africa [UNECA], Ethiopia), Setu Pelz (IIASA,
Austria), Fei Teng (Tsinghua University, China) and Meron
Tesfamichael (University College London, United Kingdom)
Chapter 7
Lead authors: Oliver Geden (German Institute of International
and Security Affairs, Germany), Mai Bui (Imperial College
London, United Kingdom), Matthew Gidden (IIASA, Austria)
and Mercedes Bustamante (Universidade de Brasília, Brazil)
Contributing authors: HollyBuck(StateUniversityofNewYork
at Buffalo, United States of America), Sabine Fuss (Mercator
Research Institute on Global Commons and Climate Change,
Germany), Jan Minx (Mercator Research Institute on Global
Commons and Climate Change, Germany), Gregory Nemet
(University of Wisconsin-Madison, United States of America),
Joana Portugal-Pereira (COPPE, Universidade Federal do Rio
de Janeiro, Brazil), Gaurav Ganti (Climate Analytics, Germany),
Stephanie Roe (World Wide Fund for Nature [WWF], United
States of America), Steve Smith (University of Oxford, United
Kingdom), and Julia Pongratz (University of Munich and Max
Planck Institute for Meteorology, Germany)
Reviewers
Muna Alamoodi (Ministry of Climate Change and
Environment, United Arab Emirates), Jesica Lelynn Andrews
(UNEP Finance Initiative), Oluleke Babayomi (Shandong
University), Juliane Berger (German Environment Agency),
Marie Blanche Ting (UNEP-CCC), Pierre Boileau (UNEP),
Olivier Bois von Kursk (IISD), Raymond Brandes (UNEP), Ruta
Bubniene (Secretariat of the UNFCCC), David Carlin (UNEP
Finance Initiative), Rob Dellink (Organisation for Economic
Co-operation and Development [OECD]), Subash Dhar (UNEP-
CCC), Paul Dowling (European Commission), Swati Dsouza
(International Energy Agency [IEA]), Simon Evans (Carbon
Brief), Ivetta Gerasimchuk (IISD), Niklas Hagelberg (UNEP),
Yasuko Kameyama (University of Tokyo), Maarten Kappelle
(UNEP), Alaa Al Khourdajie (Imperial College London),
Thaddeus Idi Kiplimo (UNEP), Andrea Klaric (European
Commission), Gabriel Labbate (UNEP), Kate Larsen (Rhodium
Group), Gerd Leipold (Climate Transparency), Jian Liu (UNEP),
Bert Metz (independent), Bavelyne Mibei (UNEP), Shonali
Pachauri (IIASA), María Paz Cigaran (Libélula), Balakrishna
Pisupati (UNEP), Dan Plechaty (ClimateWorks Foundation),
Rula Qalyoubi (UNEP), Mark Radka (independent), Zoltán
Rakonczay (European Commission), Andy Reisinger
(Independent), Jade Roberts Maron (UNEP), Yann Robiou
du Pont (Climate Energy College, Utrecht University), Gregor
Semieniuk (University of Massachusetts Amherst), Yuli Shan
(University of Birmingham), Katia Simeonova (independent),
Jim Skea (Imperial College London/IPCC), Youba Sokona
(IPCC), Masahiro Sugiyama (University of Tokyo), Oksana
Tarasova (WMO), Iman Ustadi (Office of the UAE Special
Envoy for Climate Change, United Arab Emirates), José Maria
Valenzuela (University of Oxford), Chris Vivian (Joint Group
of Experts on the Scientific Aspects of Marine Environmental
Protection [GESAMP]), Adrien Vogt-Schilb (Inter-American
Development Bank [IDB]), Daniel Wetzel (IEA), Zhao Xiusheng
(Tshingua University), Maya Zenko Ulezic (European
Commission) and Jinhua Zhang (UNEP)
Chief scientific editors
Anne Olhoff (CONCITO – Denmark’s green think tank), John
Christensen (UNEP-CCC), Simon Maxwell (independent) and
Navroz Dubash (Centre for Policy Research)
Secretariat, production and coordination
Anne Olhoff (CONCITO - Denmark’s green think tank), Julia
Rocha Romero (UNEP-CCC), Kaisa Uusimaa (UNEP) and
Maarten Kappelle (UNEP)
Media and launch support
UNEP Communication Division and UNEP-CCC
communication team](https://image.slidesharecdn.com/egr2023-231120142833-c45394b7/85/UNEP-Emission-Gap-Report-2023-6-320.jpg)


![1
Emissions Gap Report 2023: Broken Record
Introduction
Authors:
Anne Olhoff (CONCITO – Denmark’s green think tank, Denmark) and John Christensen ((UNEP Copenhagen Climate Centre
[UNEP-CCC], Denmark)
1
1.1 Context and framing of the Emissions
Gap Report 2023
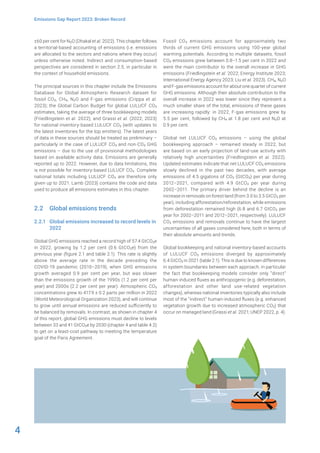
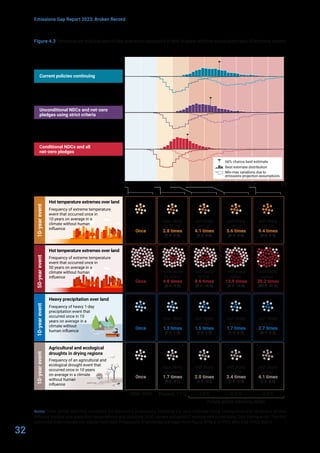
The world is witnessing a disturbing acceleration in the
number, speed and scale of broken climate records: 2023 is
on track to become the warmest year on record. At the time
of writing, 86 days have been recorded with temperatures
exceeding 1.5°C above pre-industrial levels. Not only
was September the hottest month ever, it exceeded the
previous record by an unprecedented 0.5°C, with global
average temperatures at 1.8°C above pre-industrial levels
(Copernicus Climate Change Services 2023a; Copernicus
Climate Change Services 2023b). This does not imply
that the world has exceeded the 1.5°C temperature limit
specified in the Paris Agreement, which refers to global
warming levels based on multi-decadal averages. However,
it does signal that we are getting closer to that point. These
temperature records were accompanied by devastating
extreme events, which the Intergovernmental Panel on
Climate Change (IPCC) has warned us are merely a meek
beginning. Every increment of warming results in rapidly
escalating hazards with extensive implications for human
livelihoods and ecosystems (IPCC 2023).
This is the fourteenth Emissions Gap Report by UNEP,
published ahead of the twenty-eighth session of the
Conference of the Parties to the United Nations Framework
Convention on Climate Change (COP 28). COP 28 is special,
as it marks the conclusion of the first global stocktake
under the Paris Agreement. The global stocktakes are held
every five years to assess the global response to the climate
crisis and chart a better way forward. This objective closely
mirrors that of the Emissions Gap Report, which is to provide
an annual, independent science-based assessment of the
gap between pledged greenhouse gas (GHG) emissions
reductions and the reductions required to align with the
long-term temperature goal of the Paris Agreement, and
opportunities to bridge this gap.
To inform the discussions at COP 28 – including on the
outcomes needed from the global stocktake – and set
the scene for the next round of nationally determined
contributions (NDCs) that countries are requested to submit
in 2025, which will include emissions reduction targets for
2035, this report looks at what is required this decade and
beyond 2030 to maintain the possibility of achieving the
long-term temperature goal of the Paris Agreement.
The IPCC concluded that global emissions levels by 2030
resulting from the implementation of the current NDCs will
make it impossible to limit warming to 1.5°C with no or limited
overshoot, and strongly increase the challenge of limiting
warming to 2°C (Pathak et al. 2022). This finding is reiterated
in this report. It highlights that maintaining the possibility of
achieving the long-term goal of the Paris Agreement hinges
on relentlessly strengthening ambition and implementation
this decade, thereby facilitating significantly more ambitious
targets for 2035 in the next round of NDCs and paving the
way for operationalizing and implementing the net-zero
pledges by countries that currently cover around 80 per cent
of global emissions.
The report shows that movement on the NDCs has been
negligible since COP 27, and although the ambition of the
NDCs has been strengthened since the adoption of the Paris
Agreement at COP 21 in 2015, it has been insufficient to
narrow the 2030 emissions gap.
Progress since the adoption of the Paris Agreement is more
visible on the policy implementation side. Globally, GHG
emissions in 2030 based on policies in place were projected
to increase by 16 per cent at the time of the adoption of the
Paris Agreement. Now the projected increase is 3 per cent.
However, the challenge remains immense. In just seven
years, global GHG emissions must be reduced by 28–42
per cent compared to where they are headed under policies
currently in place, to get to levels consistent with pathways
that limit global warming to well below 2.0°C and 1.5°C
respectively.
Due to the failure to stringently reduce emissions in high-
income countries – which bear the greatest responsibility
for past emissions – and to limit emissions growth in
low- and middle-income countries, which account for the
majority of current emissions, unprecedented action is now](https://image.slidesharecdn.com/egr2023-231120142833-c45394b7/85/UNEP-Emission-Gap-Report-2023-27-320.jpg)
![3
Emissions Gap Report 2023: Broken Record
Global emissions trends
Lead authors:
William F. Lamb (Mercator Research Institute on Global Commons and Climate Change, Germany; University of Leeds,
United Kingdom of Great Britain and Northern Ireland) and Minal Pathak (Ahmedabad University, India)
Contributing authors:
Lucas Chancel (World Inequality Lab, Paris School of Economics, France), Monica Crippa (European Commission, Joint
Research Centre [JRC], Italy), Giacomo Grassi (European Commission, JRC, Italy), Diego Guizzardi (European Commission,
JRC, Italy), Jing Meng (University College London, United Kingdom), Glen P. Peters (CICERO Center for International Climate
Research, Norway) and Julia Pongratz (Ludwig-Maximilians University Munich, Germany)
2
2.1 Introduction
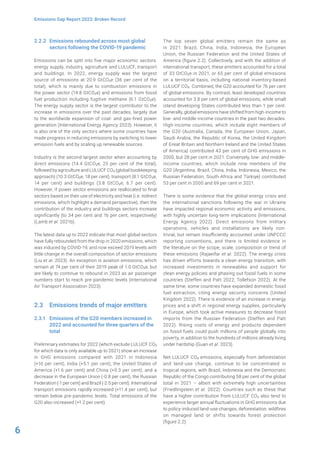
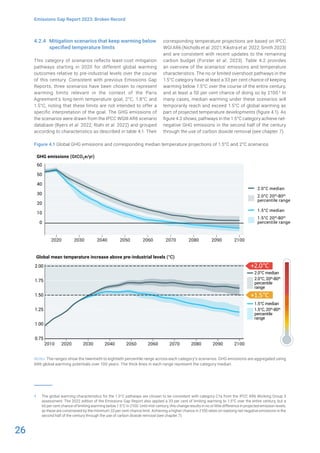
This chapter assesses greenhouse gas (GHG) emissions
trends up to and including 2022. Starting from global
emissions trends by GHG and sector (section 2.2), it describes
the emissions of the G20 and top emitters (section 2.3)
before covering household and consumption-based
emissions (sections 2.4 and 2.5). In doing so, it sets the
stage for subsequent chapters on G20 policies and the
emissions gap.1 Importantly, this chapter provides multiple
perspectives on national emissions, including absolute, per
capita and historical cumulative emissions. Each of these
perspectives offer insight into inequalities in contributions
to climate change, while highlighting that turning around
global emissions growth now requires ambitious and
urgent efforts from all countries to reduce fossil fuel use
and deforestation.
As in previous years, the Emissions Gap Report focuses
on total net GHG emissions across all major groups of
anthropogenic sources and sinks reported under the
United Nations Framework Convention on Climate Change
(UNFCCC). This includes carbon dioxide (CO2) emissions
from fossil fuel and industry (fossil CO2), CO2 emissions
and removals from land use, land-use change and forestry
(LULUCF CO2), methane (CH4) and nitrous oxide (N2O)
emissions. It includes fluorinated gas (F-gas) emissions
reported under the UNFCCC, but excludes F-gas emissions
regulated under the Montreal Protocol on ozone depleting
substances, which accounted for approximately 1.6 gigatons
1 The African Union became a permanent member of the G20 in September 2023, which was after the assessments for this report had been completed.
Consequently, the African Union is not included in the G20 assessment this year.
of CO2 equivalent (GtCO2e) in 2021 (Forster et al. 2023).
Non-CO2 LULUCF emissions are also excluded due to data
limitations.
Following the change in methodology outlined in the
Emissions Gap Report 2022 (United Nations Environment
Programme [UNEP] 2022), the global bookkeeping approach
is used to report global estimates of net LULUCF CO2
emissions and the national inventory approach to report
national estimates of net LULUCF CO2 emissions. This
ensures that global estimates are consistent with the
mitigation scenarios presented in chapter 4, as well as the
carbon cycle and climate science literature; while national
estimates are consistent with those reported by countries
to the UNFCCC. As this chapter reports, total net LULUCF
CO2 emissions differ substantially between these two
approaches, due to known differences in system boundaries
and other assumptions.
Where GHG emissions are aggregated to CO2 equivalents
in this report, 100-year global warming potentials from the
latest Intergovernmental Panel on Climate Change (IPCC)
Working Group (WG) I Sixth Assessment Report (AR6)
(Forster et al. 2021) are used. Alternative metrics can be
used – for instance, global warming potentials with a
20-year time horizon would highlight the relative importance
of CH4 on near-term warming – but are not explored here.
Uncertainties in emissions estimates are reported following
the IPCC WGIII AR6 of ±8 per cent for fossil CO2, ±70 per cent
for LULUCF CO2, ±30 per cent for CH4 and F-gases, and](https://image.slidesharecdn.com/egr2023-231120142833-c45394b7/85/UNEP-Emission-Gap-Report-2023-29-320.jpg)

![11
Emissions Gap Report 2023: Broken Record
Nationally determined contributions and
long-term pledges: The global landscape
and G20 member progress
Lead authors:
Takeshi Kuramochi (NewClimate Institute, Germany), Michel den Elzen (PBL Netherlands Environmental Assessment
Agency, the Netherlands) and Taryn Fransen (World Resources Institute, United States of America)
Contributing authors:
Jesse Burton (University of Cape Town and E3G, South Africa), Ioannis Dafnomilis (PBL Netherlands Environmental
Assessment Agency, the Netherlands), Ipek Gençsü (Overseas Development Institute [ODI], United Kingdom), Archie Gilmour
(ODI, United Kingdom), Mariana Gutiérrez Grados (Climate Transparency, Germany), Frederic Hans (NewClimate Institute,
Germany), Sarah Heck (Climate Analytics, Germany), Niklas Höhne (NewClimate Institute, Germany), Camilla Hyslop (Oxford
University, United Kingdom), Anna Kanduth (Canadian Climate Institute, Canada), Ben King (Rhodium Group, United States
of America), Hannah Kolus (Rhodium Group, United States of America), Ho-Mi Lee (Korea Energy Economics Institute,
Republic of Korea), Jared Lewis (Climate Resource, Australia), Swithin Lui (NewClimate Institute, Germany), Natasha Lutz
(Oxford University, United Kingdom), Andrew Marquard (University of Cape Town, South Africa), Silke Mooldijk (NewClimate
Institute, Germany), Leonardo Nascimento (NewClimate Institute, Germany), Analuz Presbítero (Iniciativa Climática de
México [ICM], Mexico), Jazmín Rocco Predassi (Farn, Argentina), Joeri Rogelj (Imperial College London, United Kingdom;
International Institute for Applied Systems Analysis [IIASA], Austria), Clea Schumer (World Resources Institute, United States
of America), Alister Self (Climate Resource, Australia), Kentaro Tamura (Institute for Global Environmental Strategies, Japan)
and Jorge Villarreal (ICM, Mexico)
Data contributors:
Johannes Gütschow (Potsdam Institute for Climate Impact Research, Germany), Christopher Henderson (World Resources
Institute, United States of America), Elena Hooijschuur (PBL Netherlands Environmental Assessment Agency, the
Netherlands), Kimon Keramidas (European Commission, Joint Research Centre, Spain), Mia Moisio (NewClimate Institute,
Germany), Mika Pflüger (Climate Resource, Germany) and Claire Stockwell (Climate Analytics, Germany)
3
3.1 Introduction
This chapter provides a global update of greenhouse gas
(GHG) emissions reduction pledges for 2030 and beyond,
as well as an assessment of G20 members’ implementation
progress. The chapter addresses the following three
questions:
1 How have the nationally determined contributions
(NDCs) evolved since the twenty-seventh session of
the Conference of the Parties to the United Nations
Framework Convention on Climate Change (COP 27)
and since the Paris Agreement was adopted, and
what does this imply for global GHG emissions in
2030? (section 3.2)
2 What progress have G20 members made towards
achieving their NDC targets since COP 27, and what
new policies are they implementing? (section 3.3)
3 To what extent have net-zero targets been
strengthened and moved towards implementation
since COP 27? (section 3.4)
The cut-off date for the literature and data assessed in
this chapter is 25 September 2023. In line with the other
chapters of this report, all GHG emissions numbers are
expressed using the 100-year global warming potentials
from the Intergovernmental Panel on Climate Change Sixth
Assessment Report (IPCC AR6). For historical emissions,
this chapter refers to the national inventory reports
submitted to the United Nations Framework Convention on
Climate Change (UNFCCC), unless otherwise noted. The
methodology and preliminary findings of this chapter were
made available to the Governments of the G20 members
to provide them with the opportunity to comment on
the findings.](https://image.slidesharecdn.com/egr2023-231120142833-c45394b7/85/UNEP-Emission-Gap-Report-2023-37-320.jpg)
![13
Emissions Gap Report 2023: Broken Record
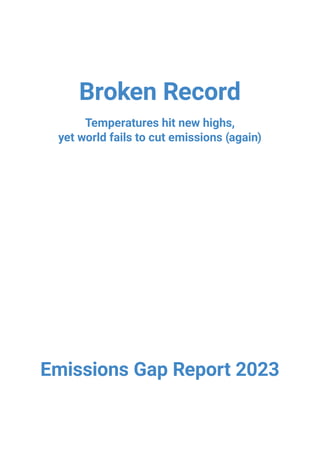
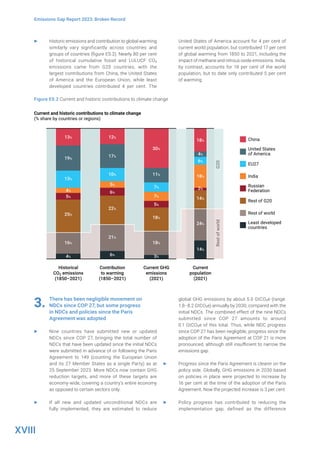
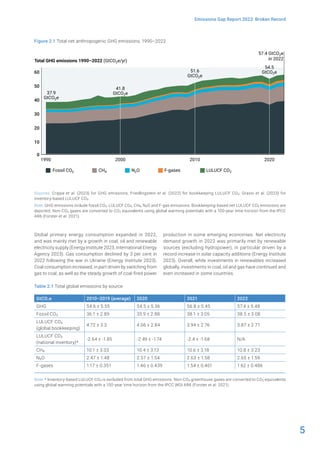
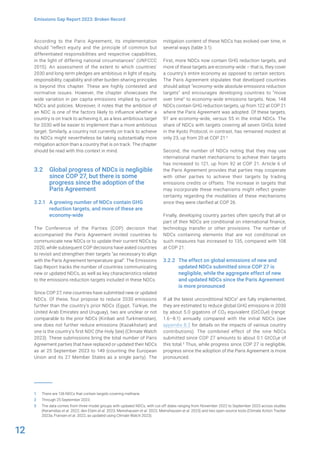
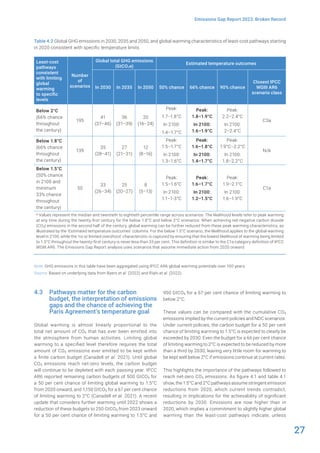
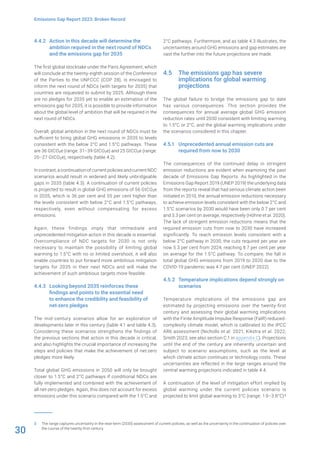
Table 3.1 Trends in global NDC characteristics since the Paris Agreement
NDC characteristics
COP 28
(2023)
COP 27
(2022)
COP 26
(2021)
COP 21
(2015)
Number of NDCs Number (percentage of global emissions)
That reduce 2030 emissions relative to initial NDCs 81 (79%) 79 (79%) 65 (63%) N/A
That contain a GHG reduction target 148 (90%) 147 (90%) 143 (89%) 122 (85%)
That contain a GHG target covering all sectors (energy,
industry, waste; agriculture, forestry and other land-use
change; or agriculture and land use, land-use change and
forestry [LULUCF])
97 (54%) 96 (53%) 91 (52%) 55 (44%)
That contain a GHG target covering all GHGs listed in the
Kyoto Protocol (carbon dioxide [CO2], methane, nitrous oxide,
hydrofluorocarbons, perfluorocarbons, sulfur hexafluoride and
nitrogen trifluoride)
23 (30%) 23 (30%) 23 (30%) 20 (29%)
That may be achieved using international market mechanisms 121 (39%) 120 (39%) 120 (37%) 92 (24%)
That contain elements not conditional on international support 135 (82%) 134 (82%) 131 (81%) 108 (77%)
Note: Numbers in parentheses refer to the share of global GHG emissions from countries communicating NDCs with the characteristic
shown in the first column. The last day of each COP is used as the cut-off date for each column, except for COP 28, for which the cut-off
date is 25 September 2023.
3.3 Implementation progress of G20
members continues, but must be
accelerated
This section provides an update on the progress of G20
members towards their latest NDC targets. It assesses
collective and individual progress of G20 members in
bridging the implementation gap, defined as the difference
between projected emissions under current policies and
projected emissions under full implementation of the NDCs
(section 3.3.1). This is accompanied by consideration of
recent major policy developments that are not yet fully
reflected in emissions projection studies (section 3.3.2).
To take stock, box 3.1 concludes on the predecessor of
the NDCs (the Cancun Pledges for 2020) against which the
Emissions Gap Reports (until 2015) assessed the emissions
gap for 2020.
Box 3.1 Did the G20 achieve the Cancun Pledges for 2020?
As part of the 2010 Cancun Agreements, developed
country parties communicated emissions reduction
targets for 2020 and developing country parties
communicated nationally appropriate mitigation
actions, many of which also contained 2020 emissions
targets (UNFCCC 2011). Thirteen of the G20 members
made such pledges (counting the European Union
Members – France, Germany, Italy and the United
Kingdom – as a single entity), while three countries
(Argentina, Saudi Arabia and Türkiye) did not. GHG
inventory data for 2020 are now available for all
Annex I countries and some non-Annex I countries,
making it possible to assess whether these pledges
were achieved.
Collectively, G20 members achieved the Cancun
Pledges (see appendix B.1). Ten G20 members
(Australia, Brazil, China, the European Union [including
the United Kingdom], India, Japan, Mexico, South
Africa, the Russian Federation and the United States
of America) achieved their Cancun Pledges, while two
members (Canada and the Republic of Korea) did not
achieve them. Some countries, such as Indonesia,
need to update their national data and information to
enable tracking progress towards their pledges.
However, the achievement of the Cancun Pledges still
resulted in a large emissions gap in 2020. The failure
to bridge the 2020 emissions gap has added further to
the present mitigation challenge and the feasibility of
bridging the 2030 emissions gap.
The assessment is based on a comparison of 2020
GHG emissions with the trajectories associated
with the achievement of these parties’ pledges (see
appendix B.1 for further detail). Emissions data is
sourced from official GHG inventories (where available)
or from independent data sources (chapter 2).](https://image.slidesharecdn.com/egr2023-231120142833-c45394b7/85/UNEP-Emission-Gap-Report-2023-39-320.jpg)
![17
Emissions Gap Report 2023: Broken Record
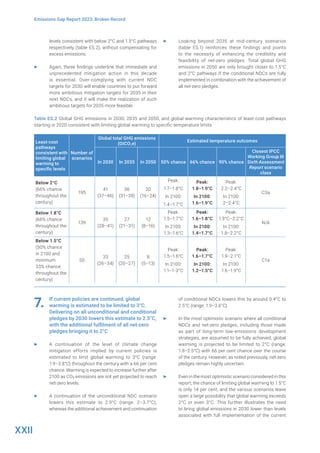
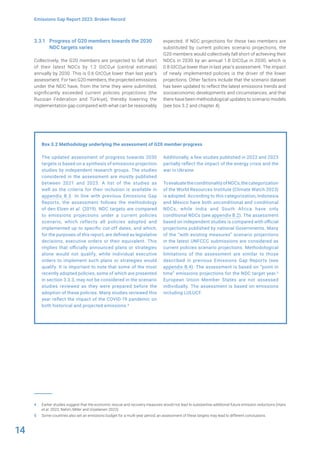
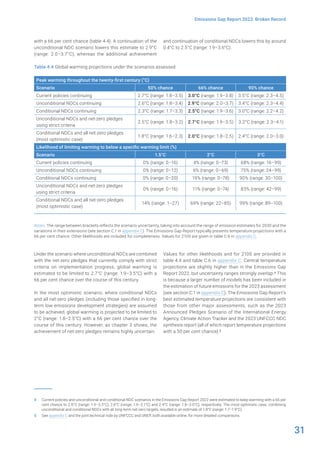
NDC targets and current policies scenario.6 There are only
small changes compared with last year. The average per
capita emissions in 2030 of G20 members under the latest
NDCs are projected to be only marginally lower (6.8 tons
of CO2 equivalent [tCO2e]) than under the current policies
scenario (7.1 tCO2e). They are still very far from the median
estimates implied by 2°C and 1.5°C scenarios by 2050,
which are 2.2 tCO2e (fifth and ninety-fifth percentile range:
1.4–2.8) and 1.0 tCO2e (0.1–1.6), respectively.7
Echoing the findings of chapter 2, table 3.3 shows that
per capita emissions range widely across G20 members.
6 Note that the 2015 estimates are not identical to those of chapter 2, due to the differences in data sources and the consideration of LULUCF emissions.
7 Estimated based on the IPCC AR6 scenario database (Byers et al. 2022; Riahi et al. 2022) and United Nations population projections, medium fertility
variant (United Nations 2022).
Australia, the European Union, the United Kingdom and the
United States of America are projected to reduce their per
capita emissions by more than one-third between 2015 and
2030 under current policies, and by between 40 per cent
and 50 per cent under unconditional NDCs. For five G20
members (China, India, Mexico, the Russian Federation and
Türkiye), per capita emissions are projected to increase
between 2015 and 2030 under both current unconditional
NDC targets and current policies. Furthermore, per capita
emissions are projected to stay above 10 tCO2e in 2030 for
several G20 members, both under current policies and under
full implementation of the unconditional NDCs.
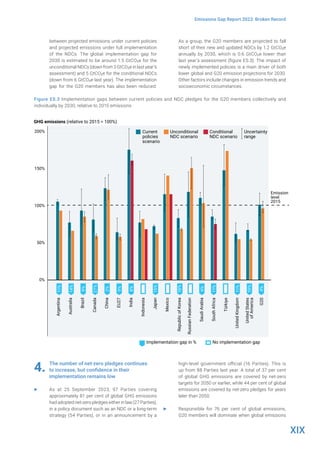
Table 3.3 G20 member per capita emissions implied by current policies and unconditional NDCs
Country
Unconditional NDC: Per capita GHG emissions 1 Current policies scenario: Per capita GHG
emissions 1
tCO2e/cap in 2030 2, 3
vs. 2015 levels tCO2e/cap in 2030 2, 3
vs. 2015 levels
G20 4
6.8 -10% 7.1 -6%
Argentina 7.5 -16% 8.4 -5%
Australia 12.7 -44% 14.7 -35%
Brazil 6.1 -23% 6.7 -15%
Canada 10.5 -49% 14.5 -30%
China 10.0 +19% 10.2 +21%
EU27 4.6 -42% 5.0 -37%
India 4
2.8 +40% 3.1 +52%
Indonesia 6.9 -28% 6.5 -32%
Japan 6.5 -35% 7.6 -23%
Mexico 5.8 +25% 4.8 +3%
Republic of Korea 8.7 -32% 10.6 -18%
Russian Federation 15.8 +54% 12.4 +21%
Saudi Arabia 16.1 -16% 17.2 -11%
South Africa 4
6.0 -35% 6.8 -27%
Türkiye 7.9 +55% 6.7 +31%
United Kingdom 4.0 -49% 4.5 -43%
United States of
America
9.4 -50% 11.7 -38%
Notes: The figures presented here may not exactly match those presented in other chapters of this report (including figure 2.2) and official
estimates by the national Governments, due to the differences in data sources.
1 Emissions estimates include LULUCF.
2 Central estimates are the median value when five or more studies were available, otherwise they are average values.
3 Data on historical and projected (medium fertility variant) population per country are taken from the United Nations World Population
Prospects 2022 (United Nations 2022).
4 To estimate G20 total emissions for the NDC pledges scenario, emissions projections under the current policies scenario were used
for India, the Russian Federation and Türkiye.](https://image.slidesharecdn.com/egr2023-231120142833-c45394b7/85/UNEP-Emission-Gap-Report-2023-43-320.jpg)
![19
Emissions Gap Report 2023: Broken Record
2022). The federal Government’s Clean Fuel Regulations
were finalized in June 2022 and came into effect in July 2023
(Canada 2022). The regulations require all fuel importers
or producers to gradually reduce the life-cycle emissions
intensity of their fuels. Beginning in 2023, the federal
carbon price rose from CA$50/tCO2e to CA$65/tCO2e, and
is scheduled to increase linearly to CA$170/tCO2e in 2030.
Additionally, the 2023 budget made significant investments
to expand clean electricity and accelerate low-carbon
growth. The federal budget contained over CA$40 billion
in new or reallocated funds for emissions-reducing actions
by 2034/2035, including a number of new investment tax
credits for carbon capture, utilization and storage, clean
electricity, clean hydrogen, clean technology and clean
technology manufacturing. While some of the tax credits
are not yet in force, once legislated, many of the credits will
be retroactively available to businesses. The implementation
of legislated and developing policies in Canada results in
emissions at approximately 520 MtCO2e in 2030, bringing
Canada more than halfway through meeting its 2030 target
(Sawyer et al. 2022) and roughly 100 MtCO2e lower than last
year without the policies (Climate Action Tracker 2022a).
Fossil fuel expansion in the G20: Although many policies
constitute progress in the past year, an opposite trend of
fossil fuel infrastructure expansion is at odds with global
climate goals. Over the past year, many countries increased
their plans for fossil fuel extraction and production. Several
major G20 economies, such as Australia, Canada, the
United Kingdom and the United States of America issued
new licences for oil and gas explorations, and Argentina
pursued expansion (NewClimate Institute and Climate
Analytics 2023; International Energy Agency 2023). In
addition, rather than declining, fossil fuel subsidies have
increased significantly. The International Monetary Fund
reports that explicit subsidies more than doubled globally
from 2020 to 2022 (Black et al. 2023). The United States
of America is now the largest fossil fuel producer in the
world, with oil production doubling and gas production
increasing by around 60 per cent since 2010 (United States
of America, Energy Information Administration 2023). The
recent increase in fossil fuel production and exports of the
G20 members result in domestic emissions and undermine
global GHG emission reductions. This year’s edition of the
Production Gap Report (Stockholm Environment Institute
et al. 2023) shows that globally, Governments still plan to
produce more than double the amount of fossil fuels in
2030 than would be consistent with the collective goals
of the Paris Agreement. G20 Governments account for the
majority of current fossil fuel production (73 per cent on an
energy basis [International Energy Agency 2023]).
3.3.3.2 The effect of other selected policy developments
cannot yet be quantified
Several other policies have been adopted by G20 members,
but in many cases their impacts remain unclear. Some of the
key policy developments since the last edition of the UNEP
Emissions Gap Report are described below.
Argentina: In December 2022, Argentina published its
new National Climate Change Adaptation and Mitigation
Plan (Argentina, Ministry of Environment and Sustainable
Development 2022). This strategy includes targets for
the decarbonization of the transport sector, incentives to
increase energy efficiency in buildings, and measures to
reduce food loss and waste. It also includes agroecological
practices measures, which affect one of Argentina’s biggest
productive sectors. The plan, however, does not include any
new renewable energy targets, nor does it include a plan to
reduce absolute emissions from livestock, one of Argentina’s
major emissions sources. Additionally, the plan proposes
measures related to oil and gas expansion (focusing
on the Vaca Muerta shale fields), as well as hydrogen
production without clarifying if the hydrogen is produced
from electricity (Argentina, Ministry of Environment and
Sustainable Development 2022).
China: Policy developments in China go both ways. On
one hand, the Government is rapidly implementing its
double strategy of overarching carbon peaking before
2030 and carbon neutrality before 2060 goals, and has
issued supporting sectoral peaking plans. The Central
Comprehensively Deepening Reforms Commission of
China announced in 2023 the transition of the economy
from targeting energy consumption and intensity reduction
to limiting carbon (intensity and reduction) – a clear sign of
support for clean energy (Xinhua 2023). Non-fossil energy
capacity has surpassed 50 per cent of all installed capacity,
reaching a 2025 milestone target early, and was forecasted
to grow in 2023 by another 180 gigawatts (GW) off the
back of a strong year for solar and wind (China Electricity
Council 2023; Xinhuanet 2023). On the other hand, energy
security concerns are leading to the continued expansion
and overcapacity of the coal-fired power fleet: 243 GW of
coal-fired power plants are currently either permitted or in
construction (Global Energy Monitor et al. 2023). Energy
demand has increased in 2023, with domestic production
and consumption of coal, gas and oil up compared to last
year (China, National Energy Administration 2023).
Japan: A new law that proposes a carbon levy, an emissions
trading scheme and issuance of new government bonds
was adopted in June 2023 (Japan 2021). However, its
impact on emissions remains unclear due to lack of
clarity on the level of carbon pricing. The Government will
mobilize JP¥20 trillion through the issuance of the Green
Transformation (GX) Economy Transition Bonds (Japan,
Ministry of Economy, Trade and Industry 2023). The Basic
Hydrogen Strategy was also revised and now sets new
hydrogen supply targets for 2030, 2040 and 2050, and an
investment plan of US$107.5 billion over the next 15 years
(Japan, Cabinet Secretariat 2023).
Mexico: In February 2023, Mexico announced a renewables
energies plan – the Sonora Plan – aiming at deploying
renewable energy as well as low-carbon investments in the
north of the country (Conan 2023). The Sonora Plan is a
step in the right direction to accelerate the energy transition,](https://image.slidesharecdn.com/egr2023-231120142833-c45394b7/85/UNEP-Emission-Gap-Report-2023-45-320.jpg)


![23
Emissions Gap Report 2023: Broken Record
The emissions gap in 2030 and beyond
Lead authors:
Joeri Rogelj (Imperial College London, United Kingdom; International Institute for Applied Systems Analysis [IIASA], Austria),
Michel den Elzen (PBL Netherlands Environmental Assessment Agency, the Netherlands) and Joana Portugal-Pereira
(Graduate School of Engineering, Universidade Federal do Rio de Janeiro, Brazil)
Contributing authors:
Taryn Fransen (World Resources Institute, United States of America), Jarmo Kikstra (Imperial College London, United
Kingdom), Robin Lamboll (Imperial College London, United Kingdom), Malte Meinshausen (University of Melbourne,
Australia) and Isabela Tagomori (PBL Netherlands Environmental Assessment Agency, the Netherlands)
Data contributors:
Ioannis Dafnomilis (PBL Netherlands Environmental Assessment Agency, the Netherlands) and Kimon Keramidas (European
Commission, Joint Research Centre, Spain)
4
4.1 Introduction
This chapter provides an updated assessment of the
emissions gap, which is the difference between the
estimated global greenhouse gas (GHG) emissions resulting
from the full implementation of the latest country pledges,
and those under least-cost pathways aligned with the
Paris Agreement’s long-term temperature goal to limit
the global average temperature increase to well below
2°C, while pursuing efforts to limit it to 1.5°C compared
with pre-industrial levels. Put simply, the emissions gap
represents the discrepancy between pledged GHG emission
reductions and the reductions required to align with the Paris
Agreement. This chapter also assesses the discrepancy
between pledged GHG emission reductions and those
associated with current policies or a continuation thereof.
This is referred to as the implementation gap.
This year’s assessment is particularly relevant as 2023
marks the conclusion of the first global stocktake. To inform
the stocktake and the next round of nationally determined
contributions (NDCs) to be put forward by 2025 (which
should include emission reduction targets for 2035), this
update addresses the following questions:
▶ What is the emissions gap in 2030 under the latest
NDCs and various policy assumptions?
▶ What are the implications for the emissions gap in
2035 and for the global level of ambition required in
the next round of NDCs?
▶ What are the implications of delayed stringent
mitigation action for the emissions gap and global
warming over the century?
The scenarios that form the basis for assessing the
emissions gap are described in section 4.2, with a summary
of the implications of delayed mitigation action provided
in section 4.3. The assessment of the emissions gap in
2030 and beyond is presented in section 4.4, while section
4.5 assesses the implications for global temperature
projections.
4.2 A set of scenarios is needed to
assess the emissions gap and global
temperature outcomes
The emissions gap assessment draws on a set of scenarios
(table 4.1) that are updated in this section. These scenarios
are organized into four categories: a current policies
reference scenario, NDC scenarios, mid-century scenarios
and least-cost mitigation scenarios starting in 2020 and
aligned with specific temperature limits. These scenarios
form the basis for estimating the emissions gap in 2030 and
the global temperature outcomes in section 4.5.
It is worth noting that emissions projections, especially
beyond 2030, rely on the assumptions and choices of
modelling teams in how to interpret scenarios in the
longer term.](https://image.slidesharecdn.com/egr2023-231120142833-c45394b7/85/UNEP-Emission-Gap-Report-2023-49-320.jpg)

![25
Emissions Gap Report 2023: Broken Record
this scenario are based on the four modelling estimates
that underpin the current policies assessment of the
Intergovernmental Panel on Climate Change Working Group
III Sixth Assessment Report (IPCC WGIII AR6) (Lecocq et al.
2022), and have been updated by the respective research
teams. These data updates use a policy cut-off date of
November 2022 and apply the most recent AR6 global
warming potentials over 100 years (Riahi et al. 2021; Climate
Action Tracker 2022; den Elzen et al. 2022; Keramidas
et al. 2022; Nascimento et al. 2022; den Elzen et al. 2023;
Schmidt Tagomori, Hooijschuur and Muyasyaroh 2023; van
Ruijven et al. 2023). The scenario considers the effects of
the COVID-19 pandemic and the impact of recent policies,
such as the expected emission reductions from the Inflation
Reduction Act introduced in the United States of America.
The scenarios do not include the impact of the energy
crisis and the war in Ukraine on energy flows and related
emission levels. The resulting median estimate of global
GHG emissions in 2030 and 2035 under current policies is
56 gigatons of carbon dioxide equivalent (GtCO2e) (range:
52–60 GtCO2e) and 57 GtCO2e (range: 46–61 GtCO2e),
respectively (see table C.4 in appendix C). The median 2030
estimate is about 1.5 GtCO2e lower than the median estimate
of the Emissions Gap Report 2022, which is due to multiple
factors, including updated polices first and foremost, but
also latest emission trends, socioeconomic projections
and methodological updates. In line with the findings on
the emission trends of G20 members (see chapter 3), the
current policies projections have shown a flattening trend
since 2019, and are now significantly lower than those at
the time of the Paris Agreement’s adoption (United Nations
Environment Programme [UNEP] 2015), which indicated that
2030 emissions would increase by 16 per cent.
4.2.2 NDC scenarios project emissions based on
the full achievement of NDCs
The NDC scenarios project global GHG emissions based
on the full achievement of the latest unconditional and
conditional NDCS submitted by Parties to the United Nations
Framework Convention on Climate Change (UNFCCC). The
estimates are derived using an approach similar to that
used in Lecocq et al. (2022) and reflect the latest updates
available as at November 2022. The scenarios are based
on findings from four modelling exercises: Climate Action
Tracker (2022), Keramidas et al. (2022), den Elzen et al.
(2023) and Meinshausen et al. (2023). The unconditional
and conditional NDC scenario estimates result in median
global GHG emissions in 2030 of 55 GtCO2e (range:
54–57 GtCO2e) and 52 GtCO2e (range: 50–55 GtCO2e),
respectively (see table 4.3; further information is provided
in appendix C). The ranges mainly stem from uncertainty in
socioeconomic baselines and current policies projections,
as well as uncertainty from the conditionality or range of
NDC targets (den Elzen et al. 2023). The projected emissions
in 2030 assuming the full achievement of NDCs are similar
to the median estimates of the Emissions Gap Report 2022
(UNEP 2022).
4.2.3 Mid-century scenarios are subject to much
larger uncertainty
The mid-century scenarios describe how GHG emission
trajectories might evolve in the longer term. Since GHG
projections to mid-century are subject to much larger policy
uncertainty than projections to 2030, three scenarios are
presented to reflect the range of possible outcomes. The
least ambitious mid-century scenario involves a simple
extension of current policies continuing at the current level
of climate policy effort after 2030. The most optimistic
scenario assumes the full achievement of all conditional
NDCs and all net-zero pledges, including those made as
part of long-term low emissions development strategies
and announced by 25 September 2023. Finally, a scenario
that uses the unconditional NDC scenario as a base and
also includes net-zero pledges that fulfil strict criteria
on operationalization and implementation progress is
considered.
The assessment of progress towards net-zero pledges is
based on a set of criteria as defined in Rogelj et al. (2023):
(i) whether the long-term target is legally binding; (ii) whether
a credible policy plan has been published supporting its
implementation; and (iii) whether short-term emissions
under current policies are on a downward path over the next
decade (at least 10 per cent below 2019 levels) (for further
information, see appendix C). Only net-zero pledges that
live up to the second and third criteria on credible policy
plans and downward emission trajectories are considered
in the scenario based on unconditional NDCs plus net-zero
pledges that comply with strict criteria. Relatively few
net-zero pledges fulfil these two criteria, with those made
by New Zealand, the United States of America and the
European Union among the few that do (see table 3.4
in chapter 3). Currently, more than 80 per cent of global
emissions are not covered by long-term pledges that fulfil
these criteria (see table C.4 in appendix C). It is important
to note that compliance with the strict operationalization
and implementation criteria does not necessarily mean
that the net-zero pledges will be achieved. As chapter 3
(section 3.4) illustrates, all countries need to enhance the
operationalization and implementation of their net-zero
pledges to increase their credibility and feasibility. Similarly,
it should be noted that non-compliance with these criteria
does not imply that net-zero pledges cannot be achieved
or that progress is not being made. Rather, it reflects that
some countries are further along with operationalizing and
implementing their net-zero pledges than others.
Emissions projections for all mid-century scenarios are
provided in appendix C (table C.5), including a comparison
with the ranges from the corresponding four individual
modelling studies used for the current policies and NDC
scenarios (Climate Action Tracker 2022; Keramidas
et al. 2022; Dafnomilis den Elzen and van Vuuren 2023; van
Ruijven et al. 2023).](https://image.slidesharecdn.com/egr2023-231120142833-c45394b7/85/UNEP-Emission-Gap-Report-2023-51-320.jpg)
![34
Emissions Gap Report 2023: Broken Record
Global energy transformation in the
context of the Paris Agreement
Lead authors:
Jesse Burton (University of Cape Town and E3G, South Africa) and Greg Muttitt (International Institute for Sustainable
Development [IISD], United Kingdom)
Contributing authors:
Fatima Denton (United Nations University Institute for Natural Resources in Africa, Ghana), Sivan Kartha (Stockholm
Environment Institute, United States of America), Narasimha Rao (Yale School of the Environment, Yale University, United
States of America), Joeri Rogelj (Imperial College London, United Kingdom; International Institute for Applied Systems
Analysis [IIASA], Austria), Saritha Sudharmma Vishwanathan (Indian Institute of Management Ahmedabad, India; National
Institute for Environmental Studies, Japan), Dan Tong (Tsinghua University, China), Marta Torres Gunfaus (IDDRI, France)
and William Wills (Centro Brasil no Clima and Eos Consulting, Brazil)
5
5.1 Introduction
Previous chapters document the continued delay in strong
mitigation action and the implications for the carbon budget
and projected global warming. The second part of the report
focuses on two issues which result from these findings and
that are central for the possibility of achieving the long-
term temperature goal of the Paris Agreement (United
Nations 2015).
First, all countries must accelerate economy-wide, low-
carbon transformations. Energy sector transformation is
essential, as energy is the dominant source of greenhouse
gas (GHG) emissions. Accelerated mitigation by high-
income countries is urgent and a priority to reflect the
United Nations Framework Convention on Climate
Change (UNFCCC) principle of common but differentiated
responsibilities and respective capabilities. However, this
will not be sufficient, given that low- and middle-income
countries already account for more than two thirds of global
greenhouse gas emissions today (see appendix A). Thus,
energy sector transformation is also necessary in low- and
middle-income countries, but must be aligned with meeting
pressing development needs (chapter 6).
Second, all pathways consistent with meeting the Paris
Agreement long-term temperature goal require a growing
quantum of carbon dioxide removal in the longer term,
alongside rapid and immediate GHG emission reductions.
Chapter 7 explores the implications of this.
Energy transformation and development of approaches to
carbon dioxide removal will need to be pursued in parallel,
rather than more of one justifying less of the other. Action
on both must be consistent with the UNFCCC principle of
common but differentiated responsibility and respective
capabilities, and requires global collaboration.
This chapter outlines some of the major issues related to
global energy transformation, setting the scene for the
subsequent chapter on energy transition in low- and middle-
income countries (chapter 6).
5.2 Avoiding new fossil fuel capacity will
limit the existing infrastructure that
must be retired early to achieve Paris
Agreement goals
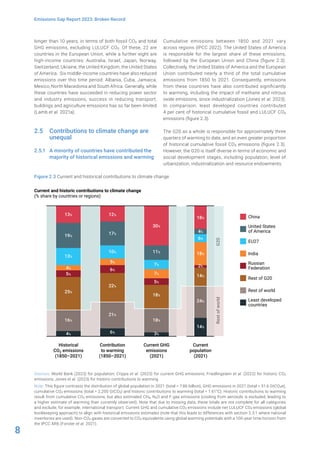
Energy consumption and production account for 86 per cent
of global carbon dioxide (CO2) emissions, comprising 37 per
cent from coal, 29 per cent from oil and 20 per cent from
gas (Friedlingstein et al. 2022; see also chapter 2). Achieving
the Paris Agreement goals thus requires a policy-driven
transformation of the global energy system.
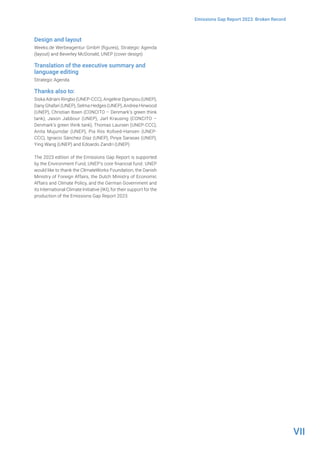
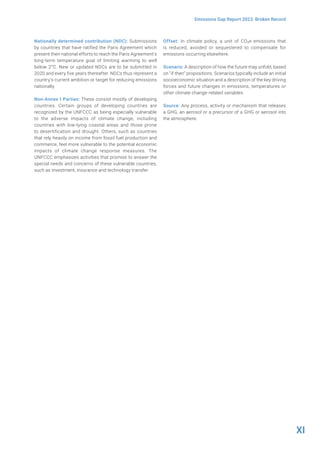
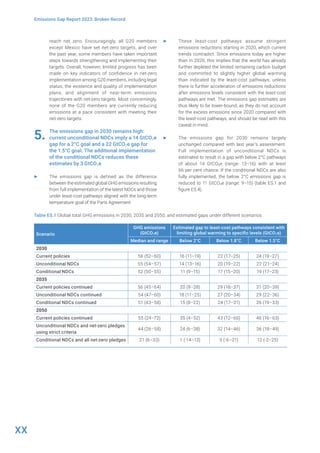
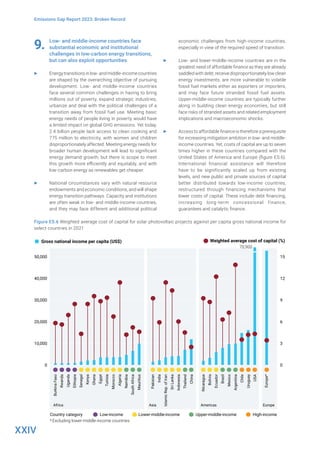
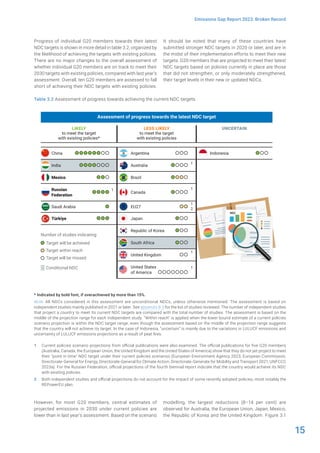
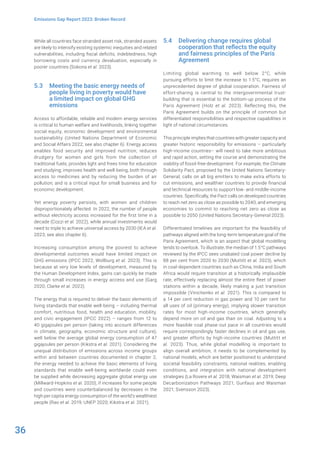
The coal, oil and gas extracted over the lifetime of producing
and under-construction mines and fields, as at 2018, would
emit 936 gigatons of CO2 if fully used (Trout et al. 2022)
– around 3.5 times the carbon budget available to limit
warming to 1.5°C with 50 per cent probability, and almost
the size of the budget available for 2°C with 67 per cent
probability (figure 5.1). Yet as described in chapter 3, new
fields and mines continue to be opened.](https://image.slidesharecdn.com/egr2023-231120142833-c45394b7/85/UNEP-Emission-Gap-Report-2023-60-320.jpg)
![35
Emissions Gap Report 2023: Broken Record
Similarly, at the other end of the supply chain, the CO2
emissions from full-lifetime operation of power stations,
industrial plants, transportation and buildings already in
existence exceed the budget available for 1.5°C warming by a
factor of 2.5, and amount to around two thirds of the budget
for 2°C (Tong et al. 2021; figure 5.1). Again, new energy-
consuming infrastructure continues to expand (chapter 3).
Figure 5.1. Committed CO2 emissions from existing fossil fuel infrastructure, compared to carbon budgets reflecting the
long-term temperature goal of the Paris Agreement
Source: Adapted from Bustamente et al. (2023).
Note: Bars show future emissions implied by full-lifetime operation of fossil fuel-extracting infrastructure (Trout et al. 2022) and of fossil
fuel-consuming infrastructure (Tong et al. 2019). These are compared with carbon budgets remaining at the start of 2023 (chapter 4).
“Existing” generally means that infrastructure has been invested or committed, as at the start of 2018 (see previously cited sources for
further details on methods). Since that time, while full data are not available, more infrastructure has been added than retired; hence this
figure is an underestimate of the committed emissions problem.
In contrast, carbon budgets aligned with the long-term
temperature goal of the Paris Agreement require that much
of the existing capital stock will need to be retired early,
retrofitted with carbon capture and storage, and/or operated
below capacity (Trout et al. 2022; Intergovernmental Panel
on Climate Change [IPCC] 2022; IEA 2023), while ensuring
a just transition for workers and affected communities
(International Labour Organization 2015; Smith 2017;
McCauley and Heffron 2018). Globally, this leaves no room
for new fossil fuel infrastructure, unless an even greater
quantity of existing stock is stranded. Instead, new energy
investments should focus on clean energy supply and end-
use electrification to avoid further increasing committed
emissions (International Energy Agency [IEA] 2021; IISD
2022; IEA 2023; Stockholm Environment Institute et al. 2023).
As low-carbon technology costs have fallen, wind and
solar now offer the lowest-cost means of generating
electricity in most of the world (UNEP 2019). The fall in the
cost of renewables generally means that the “transition
fuel” argument for higher-emissions and higher-cost gas
is becoming increasingly invalid. However, there can be
barriers to immediate transitions, including where finance
for renewable remains prohibitively expensive in poorer
countries (see chapter 6).
All this creates a dilemma for poorer countries with fossil fuel
resources, between trying to use those resources to meet
their development needs, versus avoiding the economic
risk of stranded assets as the world decarbonizes (United
Nations University Institute for Natural Resources in Africa
2019; see also chapter 6).
Emissions (GtCO2)
Committed emissions
1,000
800
600
400
200
0
250
950
Carbon budget
Carbon budget
(67% chance)
(67% chance)
(50% chance)
(50% chance)
Existing extraction
infrastructure
Existing consuming
infrastructure
Coal
Other
Gas
Oil
Carbon budget
Carbon budget
Electricity
Industry
Transport
Buildings
2°C
1.5°C](https://image.slidesharecdn.com/egr2023-231120142833-c45394b7/85/UNEP-Emission-Gap-Report-2023-61-320.jpg)

![38
Emissions Gap Report 2023: Broken Record
Energy transitions for low-carbon development
futures in low- and middle-income countries:
Challenges and opportunities
Lead authors:
Narasimha Rao (Yale School of the Environment, Yale University, United States of America) and Yacob Mulugetta (University
College London, United Kingdom)
Contributing authors:
Jesse Burton (University Cape Town and E3G, South Africa), Joisa Dutra Saraiva (Getulio Vargas Foundation, Brazil), Ashwin
Gambhir (Prayas Energy Group, India), Jessica Omukuti (University of Oxford, United Kingdom), Nadia S. Ouedraogo (United
Nations Economic Commission for Africa, Ethiopia), Setu Pelz (International Institute for Applied Systems Analysis [IIASA],
Austria), Fei Teng (Tsinghua University, China) and Meron Tesfamichael (University College London, United Kingdom)
6
6.1 Introduction
This chapter focuses on the relationship between energy
transitions1 and low-carbon development futures in low-
and middle-income countries,2 whose emissions account
for more than two thirds of global greenhouse gases (see
chapter 5). Globally, the role for low- and middle-income
countries in climate action is framed by historical patterns
of development, as recognized by the Paris Agreement
principle of common but differentiated responsibility and
respective capabilities in light of national circumstances.
Low- and middle-income countries share the challenge of
bringing millions out of poverty, including through energy
demand growth, while shifting to a clean energy system. Even
as they face some common challenges, their pathways will
vary, driven by different starting points, economic structures
and natural resource endowments. The objective of this
chapter is to place these countries’ future opportunities
for energy transition in the context of their heterogeneous
starting points and development priorities, while exploring
the scope for an internationally supported energy transition.
1 Consistent with IPCC usage, the term “transition” is used here to denote the process of changing from one state or condition to another in a given
period of time. Transitions are related to achieving a “transformation”, or a change in the fundamental attributes of natural and human systems, but
emphasize the process of this change (IPCC 2023).
2 Low-and-middle-income countries are defined as countries with an annual per capita gross national income of less than US$13,205 in 2022 (Hamadeh
et al. 2022). This includes low-, lower-middle- and upper-middle-income countries. In this chapter, “middle-income countries” refers to both lower- and
upper-middle-income countries together.
6.2 Development and energy are
interlinked
Energy transitions in low- and middle-income countries
are shaped by the overarching objective of pursuing
development. The historical expansion of the energy sector
has enabled development by providing energy services to
households and industry, and in some cases generating
export revenues. Low- and middle-income countries’ future
energy transitions, and their low-carbon implications, will in
turn be shaped by their development context. This section
examines past and likely future links between development
and energy trends, and the importance of local context in
shaping these links.
6.2.1 Development drives energy transitions
Energy transitions have historically been driven by the
requirements of providing clean cooking and electricity
services to homes, and infrastructure needed to improve
livingstandards.Inlow-andmiddle-incomecountries,climate
mitigation measures have frequently been adopted as part
of development policies that offer multiple environmental
and social benefits (Ürge-Vorsatz et al. 2014). For example,
the policies database of the International Energy Agency
(IEA) illustrates that policies often target achieving a mix of
energy efficiency, green growth, air pollution reduction and
affordability objectives (IEA undated).](https://image.slidesharecdn.com/egr2023-231120142833-c45394b7/85/UNEP-Emission-Gap-Report-2023-64-320.jpg)
![39
Emissions Gap Report 2023: Broken Record
The cooking transition is a good example of how energy
transitions are development-driven. Driven by health
objectives and national context, electric or biogas stoves
offer the most attractive long-term pathways for the sector,
effectively leading to decarbonizing cooking and heating
(Pachauri et al. 2021). Driven by this logic, about 600 million
people have transitioned from solid fuel to liquid petroleum
gas and electric stoves since 2012, resulting not only in
mitigation but in fewer premature deaths and diseases
among women and children (World Health Organization
[WHO] 2014; WHO 2022) and easing the burden on women
in carrying out their productive activities (Maji et al. 2021).
However, the transition is yet incomplete; close to 2.4 billion
people continue to use solid fuels.
Electricity access through off-grid systems has been
enabled by steeply decreasing costs of solar photovoltaics
(PV), albeit offset in low-income countries to an extent by
high borrowing costs (section 6.5). Over 100 million people,
half of whom reside in sub-Saharan Africa, and 29 per cent in
South Asia, had solar-based access through off-grid systems
by 2019 (IEA et al. 2021). However, about 775 million people
still lack electricity access (Cozzi et al. 2022); over 3.5 billion
suffer unreliable supply and electricity consumption remains
low (Ayaburi et al. 2020); and the share of renewables in
total energy consumption is only 17 per cent, and scarcely
keeping up with energy demand growth. Moreover, services
from off-grid systems are typically limited to basic lighting
and phone charging, neglecting longer-term energy services
and productive uses that would have transformative local
development benefits (Groenewoudt and Romjin 2022).
Notwithstanding these concerns, the scale-up of affordable
renewable-based access solutions offers an opportunity for
stimulating development and raising living standards, while
avoiding emissions growth from the power sector.
National energy needs for broader human development,
including for poverty eradication and further quality of
life improvements, will require significant energy demand
growth (Kikstra et al. 2021). In 2021, average per capita
energy demand in sub-Saharan Africa and South Asia was
19 and 16 gigajoules respectively, in contrast to 51 gigajoules
in China, 83 gigajoules in Western Europe and 181 gigajoules
in North America. However, as discussed in section 6.4.1,
there is scope for meeting energy demand more efficient
and equitable, and meet energy needs with low-carbon
energy as renewables get cheaper (see chapter 5).
6.2.2 Countries have different starting points and
priorities for future clean energy transitions
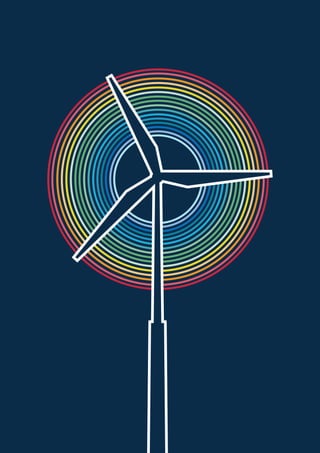
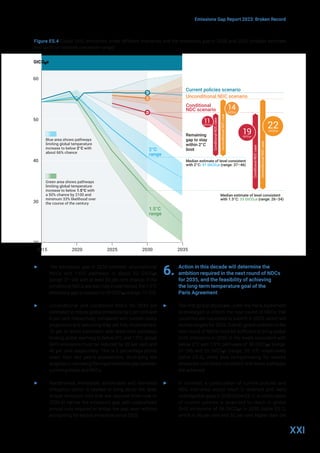
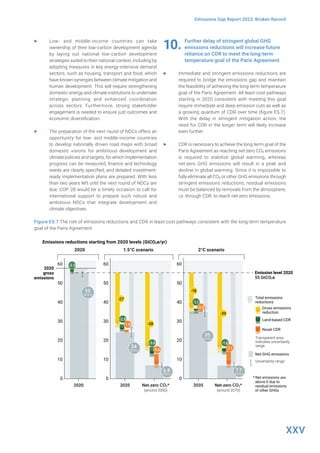
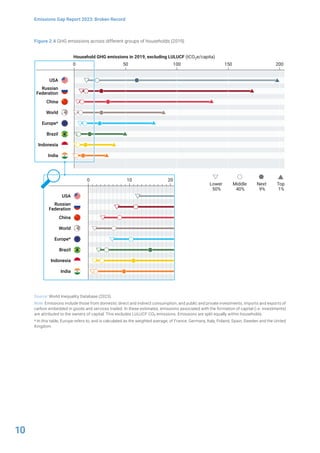
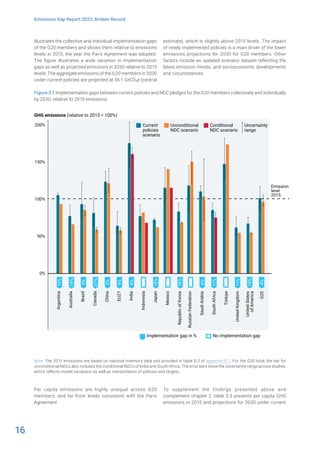
The challenges faced by countries in bringing about
clean energy transitions are shaped by differing national
circumstances (Mulugetta et al. 2022). Yet, these challenges
fall into patterns based on countries’ stage of development,
economic structures, and fuel resource endowments, as
mapped out in figure 6.1. Low-income countries not only
contribute the least to global greenhouse gas emissions but
also face acute development challenges that limit their ability
to invest in clean energy opportunities without affordable
finance. Middle-income countries with a manufacturing and
services base may require a greater focus on decarbonizing
industry, while those with a services and agriculture
and silviculture base may give precedence to reducing
deforestation. Fuel endowments also matter: countries
with renewable (e.g. hydro) capacity, those with abundant
fossil reserves for domestic use and/or exports, and those
dependent on energy imports, will all face different sets of
challenges and opportunities.
The overarching economic context in low-income countries
and some lower middle-income countries, is low human
development and high levels of debt. With underdeveloped
power sectors and industry, clean energy access for cooking
and electricity to reduce traditional biomass dependence
is a priority (Chen et al. 2022). However, financing energy
access expansion has been a challenge. Many low-income
countries have depleted public savings either to counter
the economic fallout of the COVID-19 pandemic, to cope
with volatile commodity prices or to service external debt.
In 2021, Governments in sub-Saharan Africa spent 16.5
per cent of their revenues servicing external debt, up from
less than 5 per cent in 2010 (World Bank, Office of the Chief
Economist for the Africa Region 2023). Today, 60 per cent of
low-income countries are in or at high risk of debt distress,
up from 49 per cent in 2019 (World Bank 2022).
The risks from undertaking a clean energy transition, and
its implications for broader economic outcomes, varies
by resource base. For instance, in net fuel importing low-
income countries, such as Mali, threats to fossil fuel
supply may exacerbate trade deficits and debt burdens.
Consequently, they are likely to prioritize energy security,
and value clean energy investments to replace imports (de
Hoog, Bodnar and Smid 2023).
Low-income countries with cheap energy due to abundant
hydro resources, such as Ethiopia or Nepal (recently
classified as lower-middle-income), may choose to export
low-carbon electricity to earn revenues while easing their
foreign exchange bottlenecks. They also have more flexibility
to accelerate emission reductions because they do not face
stranded fossil fuel asset costs. Bhutan, for example, is
among the few countries that have pledged to achieve carbon
neutrality in its second nationally determined contribution
(NDC) targets, based on its significant hydropower potential
and over 70 per cent forest cover (Yangka et al. 2019).](https://image.slidesharecdn.com/egr2023-231120142833-c45394b7/85/UNEP-Emission-Gap-Report-2023-65-320.jpg)
![40
Emissions Gap Report 2023: Broken Record
Figure 6.1 Country groups based on development stage and fuel endowments share these challenges in the energy
transition, among other country-specific circumstances
Some low-income countries and a few middle-income
countries already do or plan to rely on fossil fuel exports,
and could benefit from economic diversification. These
countries face common risks, such as fuel price volatility
and locking into future stranded assets. For example,
a 50 per cent decline in oil prices during the pandemic
contracted revenues and depleted foreign currency reserves
in oil exporting countries (Akinola et al. 2022; Gerval and
Hansen 2022). These circumstances pose a considerable
threat to countries such as Angola and South Sudan, where
energy accounts for up to 90 per cent share of their export
earnings (International Monetary Fund [IMF] 2022; IMF
2023). In addition to incumbent producers in North and West
Africa, several African countries including, Mozambique,
Namibia, Senegal and Uganda, have made new discoveries
of significant oil and gas reserves. Countries such as
these seeking new sources of growth will avoid fossil fuel
expansion only if they have credible alternative choices.
Energy sources
Fossil fuel
producer
(export-dependent)
Stranded
sector
risks
Fossil fuel
producer
(domestic
use)
Renewable
producer
(mainly hydro)
Energy
importer
(low resources)
Risks
Low-income
countries
Lower- and upper-middle
income countries
Agriculture and
forestry
Democratic
Republic
of the Congo
Afghanistan
Debt and lack of
affordable finance
Land-use conflict
Mali
Morocco
Jamaica
Mauritius
Kenya
Costa Rica
Bhutan
Senegal
Myanmar
Côte d’Ivoire
China
India
Viet Nam
Brazil
Indonesia
Burkina Faso
Cameroon
Equatorial Guinea
Algeria
Ecuador
Nigeria
Manufacturing
and services
Climate risks
for energy
supply
Energy
security
risks
Common barriers](https://image.slidesharecdn.com/egr2023-231120142833-c45394b7/85/UNEP-Emission-Gap-Report-2023-66-320.jpg)
![41
Emissions Gap Report 2023: Broken Record
At the same time, oil and gas projects are capital-intensive,
difficult to execute, and often face cost and time overruns
(Mihalyi and Scurfield 2020). Because of long lead times to
develop their industries, countries will be in a race against
time to reap the economic benefits of the oil and gas trade.
As renewables and other low-carbon technologies become
competitive, the prospects of declining future demand could
risk lock-in and asset stranding over the long term (Anwar,
Neary and Huixham 2022). These fossil fuel-dependent low-
income countries may benefit from economic diversification.
Angola is an example of a country that has sought to
diversify exports, as reflected in the country’s 2025 Strategy
and 2018–2022 Sector Development Plan.
Most middle-income countries, in contrast, typically have
larger urban centres, more developed energy infrastructure,
and better access to capital. Those that are major coal
producers, such as China, India and South Africa, face
the risk of stranded assets, large-scale unemployment
and energy insecurity if coal is rapidly phased down. The
speed of transition required poses a particular challenge.
Energy transition consistent with Intergovernmental Panel
on Climate Change (IPCC)-modelled pathways to 1.5°
would require declines in coal generation at historically
unprecedented rates (Muttit et al. 2023). However,
the clean energy transition also offers opportunities,
contingent on international support. Notably, all three of
the countries mentioned have developed ambitious plans
for mainstreaming climate into long-term development
strategies (South Africa 2019; India, Ministry of Environment,
Forest and Climate Change [MoEFCC] 2022).
In China, for example, to meet the projected rate of emissions
decline, the country’s energy infrastructure investment could
triple compared to the NDC scenario. In one 1.5° scenario,
these investments account for more than 2.6 per cent of its
gross domestic product (GDP) (He et al. 2022). Since much
of China’s energy infrastructure, including coal plants, has
been constructed in the past two decades, a rapid phase-
out of coal could result in trillion-dollar stranded assets (Cui
2019). Conversion to peaking plants (Cui 2021), and retrofits
with CCS or biomass co-generation (Xing et al. 2021), are
partial solutions to this challenge.
South Africa, a coal-producing and -exporting economy, has
rapidly expanded renewable energy development, yet faces
a long road to replace its coal dependence. In 2019, South
Africa had planned for 30 GW of variable renewable energy
in its Integrated Resource Plan (South Africa, Department
of Mineral Resources and Energy 2019), and by 2022 had
18 GW in the grid connection queue and 33 GW of variable
renewable energy and batteries at an advanced stage of
approval (South African Photovoltaic Industry Association
2023). Yet to meet South Africa’s ambitious NDC targets
would require adding over 6 GW of variable renewable
energy every year to 2030, an amount equivalent to the
current installed capacity of variable renewable energy,
as well as investments in grid backbone (South Africa,
Presidency 2022). Without enhanced international financial
support, the country risks short-term negative impacts on
growth, exacerbating poverty and inequality, and failing to
capture future low-carbon industrial opportunities (World
Bank Group 2022).
India faces the challenge of mobilizing investment to
achieve its ambitious clean energy transition plans. These
plans include increasing non-fossil fuel capacity in the
power sector to 65 per cent by 2030 (India, Ministry of
Power, Central Electrical Authority 2023), exceeding its
NDC commitment of 50 per cent, implementing building
and industrial energy efficiency standards and markets, and
undertaking electric vehicle, biofuels and green hydrogen
promotion programmes (India, MoEFCC 2022; India,
Ministry of New and Renewable Energy 2023). To fully
achieve this transition will require complementary measures
such as a smooth transition away from coal, strengthening
an already stretched electric grid, and decarbonizing the
fertilizer, cement and steel industries. There is also scope to
exploit potential linkages between social development and
climate mitigation (Bhatia 2023), such as through electric
public transit and two- or three-wheeler vehicles, passive
designs for affordable housing (the Pradhan Mantri Awas
Yojana programme) and efficient cooling solutions.
In industrializing middle-income countries with strong
agriculture and forestry sectors, like Brazil and Indonesia,
curbing deforestation through forest management reform
may be a critical lever, though also with political challenges.
For example, Brazil had success in reducing deforestation
from 2004 to 2012 through stronger monitoring and
enforcement and incentive programmes, such as conditional
access to credit in rural areas with illegal practices
(Assunção, Gandour and Rocha 2015), but some regression
has occurred with changes in political cycles. Such reforms
have had to contend with the conflict between conservation
and the protection of indigenous rights, and land-grabbing
for agriculture (Brito et al. 2019).
6.3 The political economy of clean energy
transitions is challenging
Ensuring rapid, smooth and just national clean energy
transitions will require addressing many political and
institutional challenges at the national and global levels.
Central to these challenges is the reality that greenhouse
gas emissions contributions and the capacity to mitigate
them have been, and will likely continue to be, highly
unequal (see chapters 2 and 5). Global inequalities carry
implications for financing and other means of international
support for energy transitions, as discussed in section 6.5.
National inequalities reflect unequal access to institutions
and resources, concentration of power among elites and
contestation among rival political interests. This section
focuses on the implications for energy transitions of national
development challenges, in particular capacity constraints,
weak institutions and complex political economies.](https://image.slidesharecdn.com/egr2023-231120142833-c45394b7/85/UNEP-Emission-Gap-Report-2023-67-320.jpg)
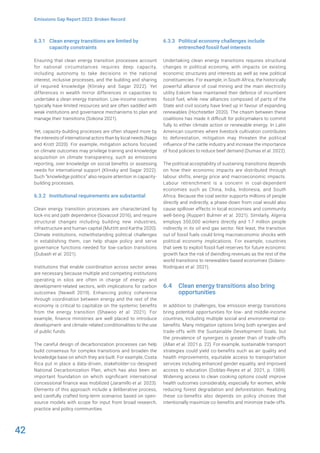
![43
Emissions Gap Report 2023: Broken Record
The scope for these sectoral co-benefits is well recognized.
This section focuses on the complementary question of how
broader structural economic changes could help generate
opportunities, across a wide spectrum of low- and middle-
income countries, while keeping their specific national
contexts in mind. It discusses two such sets of opportunities:
demand-side changes that result in more efficient growth;
and moving up the clean energy supply chain.
6.4.1 Demand-side changes bring efficiency and
social benefits
Demand-side changes could bring social benefits and,
through enhanced efficiency, reduce the need for supply
expansion (Creutzig et al. 2018). The most energy-intensive
demand sectors include housing, transport and food (Rao
et al. 2019). Avoiding lock-in in these sectors require shifting
how low- and middle-income countries develop urban
areas where the most energy demand growth and lock-in
is expected. Given that future demand growth is dominated
by urban areas, the potential for avoided emissions is
greatest there.
Because urban and industrial infrastructure is still being
built in low- and middle-income countries, these countries
can avoid locking into energy- and carbon-intensive
infrastructure, thereby avoiding future emissions (Lwasa
et al. 2022). Urban planning and housing policies that
encourage more dense and affordable multifamily housing
can reduce commuting needs and building energy demand.
Building energy efficiency measures, coupled with financial
support to maintain affordability, such as for appliances
and housing construction practices, can save households
money and reduce emissions. In the transport sector, shifts
from investments in road infrastructure to facilitate shared
transit, such as buses, mass transit rail or even car-sharing,
can significantly reduce transport-related emissions, with
numerous social and environmental benefits (McCollum
et al. 2018).
In the food sector, energy investments at scale are
essential to support expected growth in food production
of 70 per cent by 2050 to meet the needs of a growing
population, increased urbanization, and dietary changes
(International Renewable Energy Agency [IRENA] and
Food and Agriculture Organization of the United Nations
[FAO] 2021). For example, improved access to modern
energy for cooling and mechanical power in the agrifood
supply chain can reduce waste in storage and increase
productivity in agroprocessing. Policies that support diets
with healthy coarse grains (Davis et al. 2019) and less meat
(Willet et al. 2019) can have nutritional, environmental and
economic benefits.
Shifts in development strategies that prioritize the poor or
broad public interests over private consumption can reduce
emissions growth. In South Africa, models show that
macroeconomic policies that prioritize energy security and
employment can favour renewables over fossil investments
in the power sector (Winkler et al. 2022). Shifts in investments
towards shared infrastructure that serve basic needs, such
as health or education facilities, and water and sanitation,
would reduce inequality in human development and limit
emissions growth (Kikstra et al. 2021; Millward-Hopkins and
Oswald 2023).
6.4.2 Participating in clean energy supply chains
can bring jobs and revenue
Moving from mineral extraction to the final product end
of the clean energy supply chain provides considerable
opportunities to low- and middle-income countries. Doing
so can create new revenue opportunities for the industry
and new jobs for the public, and, in some cases, help fossil
fuel-dependent economies to diversify.
The rise in the electric vehicle industry will require a material
shift from a liquid-based to a minerals-intensive energy
system, estimated to result in a six-fold increase in mineral
inputs in 2040 relative to today (IEA 2021a). By 2025, the
six segments of the US$8.8 trillion global electric vehicle
batteries value chain will include mineral exploitation (US$11
billion), minerals-to-metals transformation (US$44 billion),
production of precursors (US$217 billion), battery cell
manufacture (US$387 billion), cell assembly (US$1.8 trillion)
and electric vehicle manufacture (at least US$7 trillion).
Moving from the first segment to the third would allow
countries in Central Africa to capture gains beyond the very
first and least profitable stage of the chain (BloombergNEF
2021; Ouedraogo and Gasser 2022).
Low- and middle-income countries today are competitive in
exploration and mining of critical minerals, but lack capacity
for processing or refining operations, cell assembly, and
manufacturing of components necessary for electric vehicle
production. For example, almost all the cobalt mined in the
Democratic Republic of the Congo is exported to Belgium
or China for refining, with insignificant economic benefits
accruing to the country (Bridle et al. 2021). Achieving the
transformative potential of lower- and middle-income
countries’ resources requires a new way of thinking
about minerals and their place in the industrialization and
diversification of economies.
Low- and middle-income countries that have been successful
in taking advantage of downstream opportunities in the
renewables value chain have done so through the support
of robust institutions, cross-sectoral coordination, industrial
policies to strengthen local manufacturing capabilities, and
development of export partnerships. China’s PV programme,
for example, has established an industrial ecosystem with
strong synergy between upstream and downstream sectors.
China’s PV industry promoted sustained cooperation
between local firms, universities and industry associations
across the PV value chain. Starting from portable lighting
devices, then moving to solar PV panels, and ultimately
creating domestic cell and wafer industry for export, the
Chinese PV industry has gradually become one of the pillars](https://image.slidesharecdn.com/egr2023-231120142833-c45394b7/85/UNEP-Emission-Gap-Report-2023-69-320.jpg)
![44
Emissions Gap Report 2023: Broken Record
of the Chinese manufacturing sector (Huang et al. 2016;
Zhang and Gallagher 2016). Conversely, India’s National Solar
Mission prioritized low-cost deployment of PV over building
domestic manufacturing capability, paying insufficient
attention to training and research and development (R&D)
(Behuria 2020). India’s relatively limited success in creating
opportunities for localizing manufacturing has therefore
resulted in high dependence on solar PV imports.
Prior expertise in related industries matters. For instance,
Viet Nam has had substantial experience producing
internal combustion engine based two-wheelers for several
decades, and has become the second-largest electrical two-
wheelers market worldwide, second only to China (Hiep et
al. 2023). As part of the effort for upscaling electric vehicles,
the Government of Viet Nam agreed to reduce the excise
tax on domestically manufactured, assembled and imported
electric cars. A preferential import tax on raw materials
and components is currently under review (Le, Posada
and Yang 2022). However, Viet Nam still lacks a clear and
comprehensive e-mobility policy and regulatory framework
to plan for significant future investment.
Starting down the pathway to harness gains from the
energy supply chain may require taking early bold steps. For
instance, Peru reformed its copper royalty regime in 2021
to increase government revenue from the mining sector.
Indonesia has banned the export of unprocessed nickel to
encourage value-added activities within its borders. Namibia
has also been actively exploring the development of green
hydrogen, mainly for export. Although it lacks the industrial
capacity and sectoral system capabilities of countries
further ahead, Namibia has established strong international
R&D interactions and collaborations to ensure the social
benefits of employment and local learning take place (United
Nations Conference on Trade and Development 2023). The
initiative is expected to create an additional 600,000 jobs
by 2040 in Namibia, but the social, political and resource-
related risks would need to be carefully assessed.
6.5 Adequate international finance is an
essential enabler of clean energy
transitions
Decarbonizing energy systems in low- and middle-income
countries requires mobilizing capital at an unprecedented
scale. Without affordable external climate finance
assistance, the majority of low- and middle-income countries
will struggle to achieve their development objectives and
reduce emissions. Global clean energy investment stands at
US$1.3 trillion today, and is projected to rise to US$2 trillion
by 2030 (though US$4 trillion is needed to stay on track
with the net-zero scenario) (IEA 2021b). Low- and middle-
income countries account for two-thirds of the global
population, yet received only a fifth of all energy transitions
investments (IEA 2021c). The implementation of the NDCs
alone, for instance in Africa, are projected to require close
to US$3 trillion of conditional and unconditional finance for
implementation, a sum close to one year of Africa’s GDP in
current terms (UNECA 2020).
Enabling an energy transition in low- and middle-income
countries will require scaling up financial flows in strained
financial systems. In many cases, challenges of food
sovereignty, energy sovereignty, and the low value-added
content of exports relative to imports (Sokona et al. 2023)
contribute to structural trade deficits, weakened currencies
and persistent indebtedness. In low- and middle-income
countries with fossil fuel industries, affordable finance
is important not only for scaling clean energy, but also to
manage the economic shocks from retiring fossil fuel assets.
For example, coal-fired power plants support the viability of
India’s rail system through coal freight charges and finance
state budgets (Tongia, Sehgal and Kamboj [eds.] 2020).
Moreover, reduction in fossil fuel exports could threaten
fiscal solvency in countries such as Algeria, where oil and
gas revenues accounted for 38 per cent of government
revenue between 2016 and 2021, increasing to more than
50 per cent in 2022 and 2023 (Oxford Analytica 2023).
Against this challenging backdrop, energy transitions in
low- and middle-income countries are impeded by nominal
financing costs that are up to seven times higher than those
in the United States of America and Europe (IEA 2021c). The
weighted average cost of capital varied between 5 and 21
per cent for solar and wind projects in lower- and middle-
income countries (see figure 6.2). The regional weighted
average cost of capital for solar PV in 2021 was 7 per cent in
Africa and Asia and 4 per cent in Europe (IRENA 2022). Some
low- and middle-income countries face a climate investment
trap, where the high costs of capital that limit financial flows
are due in part to limited experience with these markets.
Perceived risks of investment are exacerbated by sovereign
credit scores and ratings, and the lack of concessional
finance, catalytic finance and guarantees (Mithatcan et
al. 2022).
Reducing costs of capital can significantly increase the
scope for low-carbon energy investments to provide
affordable energy services to wider populations (Ameli
et al. 2021). To do so, reforms are needed in international
finance as well as in domestic markets where clean energy
is sold. International climate finance needs to be re-oriented
towards long-tenor and low-interest concessional finance,
guarantees and catalytic finance need to be provided,
and new public and private sources of finance should be
encouraged. New innovative models for finance are needed
that restore debt sustainability and restructure the rules of
international financial institutions (United Nations 2023).
In domestic markets, risks of energy off-take need to be
reduced by improving the financial viability of purchasing
utilities, developing reliable market design and rules, and
strengthening electric grids to ensure reliable delivery.
Further, climate finance is less forthcoming for countries
that need it the most. The 46 least developed countries
received 2.8 billion in energy transition investments in](https://image.slidesharecdn.com/egr2023-231120142833-c45394b7/85/UNEP-Emission-Gap-Report-2023-70-320.jpg)
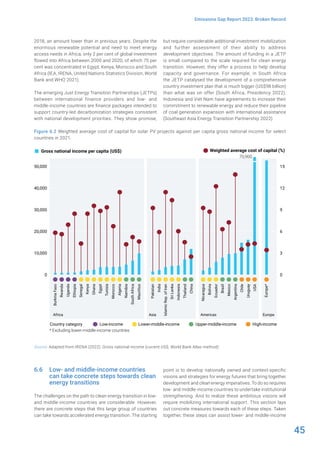
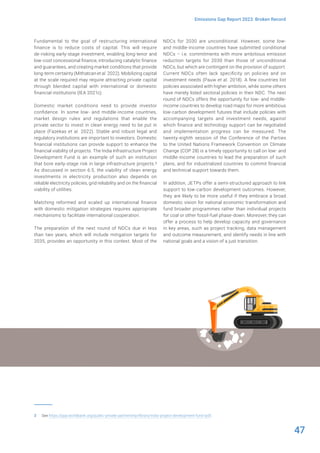
![48
Emissions Gap Report 2023: Broken Record
The role of carbon dioxide removal in achieving
the Paris Agreement’s long-term temperature goal
Lead authors:
Oliver Geden (German Institute for International and Security Affairs, Germany), Mai Bui (Imperial College London, United
Kingdom), Matthew Gidden (International Institute for Applied Systems Analysis [IIASA], Austria) and Mercedes Bustamante
(Universidade de Brasília, Brazil)
Contributing authors:
Holly Buck (State University of New York at Buffalo, United States of America), Sabine Fuss (Mercator Research Institute on
Global Commons and Climate Change, Germany), Jan Minx (Mercator Research Institute on Global Commons and Climate
Change, Germany), Gregory Nemet (University of Wisconsin-Madison, United States of America), Joana Portugal-Pereira
(Graduate School of Engineering [COPPE], Universidade Federal do Rio de Janeiro, Brazil ), Gaurav Ganti (Climate Analytics,
Germany), Stephanie Roe (World Wide Fund for Nature [WWF], United States of America), Steve Smith (University of Oxford,
United Kingdom) and Julia Pongratz (University of Munich and Max Planck Institute for Meteorology, Germany)
7
7.1 Introduction
Under current or planned emission reduction efforts, as
presented in chapter 4, the expanded use of carbon dioxide
removal (CDR) is unavoidable if the Paris Agreement long-
term temperature goal is to remain within reach.
CDR is already being deployed, mainly in the form of
conventional land-based methods and mostly in the
developing countries. As described in section 7.1.1, there
are various current and emerging approaches for CDR.
These approaches are at varying levels of maturity and
have different types of risks that are either method- or
implementation-specific (e.g. relating to land competition,
sustainability, biodiversity, durability or high energy
requirements) or of a more systemic nature, such as the
potential to undermine the priority of emission reductions
or overestimating the future efficacy of CDR.
It is important to note that all mitigation scenarios assessed
by the Intergovernmental Panel on Climate Change (IPCC)
(Riahi et al. 2022) that are aligned with the Paris Agreement
temperature goal make use of CDR to some extent,
especially to achieve and even go beyond net-zero carbon
dioxide (CO2) emissions and eventually all greenhouse gas
(GHG) emissions. The gigaton-level application of CDR
in these scenarios imply a need for substantial growth in
nascent technologies. For this to happen, both national
and international policy and governance regimes will need
to be developed to better incorporate CDR constraints
and opportunities. Beyond a commitment to formally
integrating CDR in existing climate policy frameworks, four
important areas for political action can be identified: setting
and signalling priorities; developing robust measurement,
reporting and verification systems; harnessing synergies
and co-benefits; and accelerating needed innovation.
7.1.1 CDR methods and characteristics differ
As a result of the continued increase in GHG emissions
worldwide, CDR has gradually become an increasingly
essential element of scenarios consistent with limiting
global warming to 1.5°C or well below 2°C (Pathak et al.
2022; Riahi et al. 2022). Achieving these targets will still
require the rapid decarbonization of industry, transport, heat
and power systems, but will need to be combined with the
scale-up of CDR technologies to address residual emissions
from so-called hard-to-abate sectors, such as aviation,
shipping, heavy industry and some agricultural activities.](https://image.slidesharecdn.com/egr2023-231120142833-c45394b7/85/UNEP-Emission-Gap-Report-2023-74-320.jpg)
![49
Emissions Gap Report 2023: Broken Record
When discussing CDR, it is vital to clearly differentiate
between a set of related but different options for managing
carbon emissions:
▶ CDR is only the direct removal of CO2 from the
atmosphere and its durable storage in geological,
terrestrial or ocean reservoirs, or in products.
▶ While carbon capture and storage and carbon capture
and utilization share components with some CDR
methods, their application on CO2 emissions from
fossil fuels can never result in CO2 removal from the
atmosphere.
▶ Carbon capture and storage involves the capture of
CO2 from point-source emissions, industrial process
streams or the atmosphere, which is then transferred
into permanent CO2 storage (e.g. long-term geological
storage). Some CDR processes require carbon
capture and storage technologies to be considered for
CDR (e.g. bioenergy with carbon capture and storage
or direct air carbon capture and storage).
▶ Carbon capture and utilization involves the capture of
CO2 from a point source or the atmosphere, which is
then used to produce other products, such as fuels
and chemicals. The key difference of this approach
from CDR and carbon capture and storage is that
most carbon capture and utilization products will
eventually be combusted, resulting in the re-release
of the CO2 back into atmosphere.
Methods that can provide direct removal of CO2 from the
atmosphere and durably store it include afforestation,
reforestation, coastal blue carbon management, enhanced
weathering, biochar, soil carbon sequestration, direct
air carbon capture and storage, bioenergy with carbon
capture and storage, ocean alkalinity enhancement and
ocean fertilization (Fuss et al. 2018; National Academies
of Sciences, Engineering, and Medicine 2019; Babiker
et al. 2022; Bui and Mac Dowell [eds.] 2022).1 Figure 7.1
summarizes the main characteristics of CDR methods.
Conventional approaches such as afforestation and
reforestation have been practised for centuries, but not at
the scale assumed in IPCC-assessed mitigation scenarios,
1 There is conceptual overlap between biological removal methods (such as reforestation, soil carbon sequestration or blue carbon management) and
nature-based solutions, defined by the International Union for Conservation of Nature as actions to protect, sustainably manage and restore natural
or modified ecosystems that address societal challenges (e.g. climate change mitigation) effectively and adaptively, while simultaneously providing
human well-being and biodiversity benefits (Cohen-Shacham et al. 2016). Considering that nature-based solutions encompass both emission
reductions/avoidance and removals, the term is not used in this chapter due to the focus on CDR.
and will therefore need to be backed by improved inventory
methods for credibility. Other so-called novel CDR methods
are in the early stages of development, or have reached
pilot, demonstration and even commercialization stages,
for example bioenergy with carbon capture and storage,
direct air carbon capture and storage, biochar or enhanced
weathering (Smith et al. 2023).
CDR efficiency is the fraction of CO2 captured that is
permanently removed from the atmosphere, having
also accounted for any GHG emissions arising along the
supply chain. CDR potential and scalability of each CDR
implementation pathway will depend on the method used.
Specific CDR approaches will have different co-benefits (e.g.
soil improvements), risks and adverse consequences (e.g.
land competition for food production).
The timescale of CDR from different CDR approaches is an
important factor to consider in terms of the possible speed
at which global warming is reduced. For instance, forest
carbon sinks can take decades to centuries to establish and
saturate, while the mineral carbonation process of enhanced
rock weathering can take months to years, or even decades
to proceed to completion. In contrast, direct air capture
removes CO2 on much more immediate timescales (Chiquier
et al. 2022).
CDR permanence is the duration of time for which the
captured carbon is stored and is also referred to as carbon
storage durability. Depending on the CDR method, this can
vary from decades to thousands of years, or even longer
(figure 7.1). Each carbon storage option will have some level
of risk of reversal, which refers to the risk associated with
the re-release of the stored carbon through an unintended
event or activity.
To accurately measure net CDR, measurement, reporting and
verification methodologies are being developed for different
CDR options, which will provide standardized guidance on
project eligibility criteria, required field measurements, best
practice principles (e.g. to avoid the reversal of CDR) and
life cycle assessment boundaries to quantify the carbon
stored and emitted. The ease of measurement, reporting
and verification will have an impact on the cost, feasibility
and even the perception of CDR implementation options
(Mercer and Burke 2023).](https://image.slidesharecdn.com/egr2023-231120142833-c45394b7/85/UNEP-Emission-Gap-Report-2023-75-320.jpg)
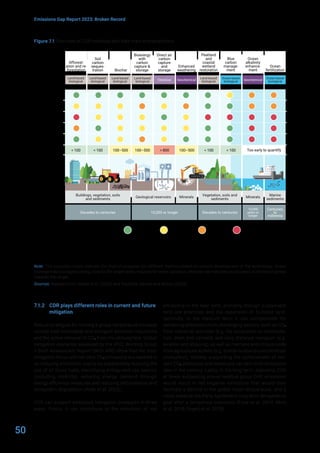
![53
Emissions Gap Report 2023: Broken Record
7.2.2 National climate strategies focus on
land-based CDR
Many countries currently report net-negative LULUCF
emissions in their national GHG inventories, and thus
already include land-based CDR, which is part of the
negative component of gross LULUCF fluxes (see section
7.2). At present, many nationally determined contributions
(NDCs) for 2030 and net-zero pledges made by countries do
not specify how much they will depend on CDR, nor the level
of residual emissions they plan to maintain when achieving
net-zero CO2 and GHG emission targets (Buck et al. 2023b).
Removals from the land sector form the bulk of current
CDR estimates implied by existing NDCs, with 2030 levels
estimated to be between 2.1 and 2.6 GtCO2 of removals per
year, depending on the conditionality of the NDC. Current
literature estimates of the implied levels of land-based
removals in long-term strategies and net-zero pledges are
2.1–2.9 GtCO2 of removals per year by 2050, though this is
based on an incomplete sample of 53 countries (updated
from Smith et al. 2023). It is also important to note that the
literature estimates vary based on whether they exclude
indirect anthropogenic effects (see chapter 2). In general,
very little information is available from country submissions
to the United Nations Framework Convention on Climate
Change (UNFCCC) in terms of the expected use of novel
CDR to achieve net-zero targets, with aggregate estimates
around 600–1,000 MtCO2 per year by 2050 (Smith et al.
2023). As figure 7.2 illustrates, these levels implied by
country pledges are substantially below the levels in least-
cost pathways consistent with the Paris Agreement’s long-
term temperature goal.
At present, countries do not separate their planned gross
emission reductions from their planned use of CDR in
national target setting, and thus can in principle achieve
their national climate targets by pursuing different mitigation
strategies. Countries choose their mitigation strategies
based on their capabilities, which in turn has significant
impacts on the amount of CDR required to meet their
climate targets. Countries with significant dependence on
land-based removals may find their targets more difficult
to achieve since these removals weaken with increasing
climate action (Gidden, Gasser et al. 2023).
Large-scale CDR deployment may face significant
ecological, environmental and social constraints (Fujimori
et al. 2022). In many regions of the world, significant
expansion of land-based CDR will require much stronger
governance structures and will compete with agricultural
production. CDR that involves energy use, such as direct air
carbon capture and storage and enhanced weathering, will
require net-zero energy supply to be truly carbon negative
(Realmonte et al. 2019; Grant et al. 2021). Furthermore,
these options may face opposition from citizens concerned
with the impacts of new infrastructure, the cost of CDR, the
ability of Governments to safely regulate geological CO2
storage and unintended consequences, among others (Cox,
Spence and Pidgeon 2020).
7.3 The risks of depending on large-scale
CDR to meet climate goals
Relying on large-scale CDR has various risks. The main
climate-related risks include the durability of conventional
land-based CDR approaches and an inability to deliver novel
CDR approaches at the envisaged scale, while the main
sustainability-related risks include impacts on biodiversity,
water resources, nutrient loading, food security and
livelihoods.
7.3.1 Climate risks include issues with durability
and acceptance
Currently, terrestrial ecosystems are responsible for
absorbing a quarter of anthropogenic carbon emissions, with
ecosystem restoration (including the expansion of forest
cover through reforestation) the most cost-effective and
scalable CDR option. The maintenance of the existing land
carbon sink and its enhancement represent a substantial
contribution to mitigation pledges and scenarios. However,
the permanence of carbon stored in forests, peatlands,
coastal wetlands and soils under both climate change and
direct human intervention is uncertain (Windisch, Davin and
Seneviratne 2021). Storing carbon in plant biomass and
soils is limited to timescales of several decades to centuries,
with the carbon storing ability saturating over time. Natural
and managed ecosystems are also subject to natural and
anthropogenic disturbances, such as fires, degradation and
deforestation, which release the stored carbon back into the
atmosphere.
The durability of carbon sequestered in the biosphere,
including conventional CDR methods, is less than that of
novel CDR measures that rely on geological storage (see
figure 7.1) (Fuss et al. 2018; National Academies of Sciences,
Engineering, and Medicine 2019; Bui and Mac Dowell [eds.]
2022; IPCC 2022a). However, the value of these options for
climate policy (Fuss, Golub and Lubowski 2021; Kalkuhl et
al. 2022) should not be underestimated as they are often
associated with substantial ecosystem services and
livelihood co-benefits (Smith et al. 2019; Ruseva et al. 2020).
For climate policy to be effective, it is crucial to understand
the effects of CDR and emissions, potential interlinkages
and the timing of effects. Due to the impact of natural
disturbances on forests, the risk of such disturbances has
been integrated into forest management with a focus on
timber production rather than carbon benefits. A few risk-
accounting methods have been introduced, specifically for
hurricanes and wildfires at site, region or country-specific
scales (Chiquier, Fajardy and Mac Dowell 2022).
While novel CDR approaches that store carbon in the
geosphere have greater storage durability, there is a risk that
the technical, economic and political requirements for large-
scale deployment may not materialize in time. Controversies
in the debate in many countries show that public acceptance
is still uncertain for various CDR methods, particularly](https://image.slidesharecdn.com/egr2023-231120142833-c45394b7/85/UNEP-Emission-Gap-Report-2023-79-320.jpg)
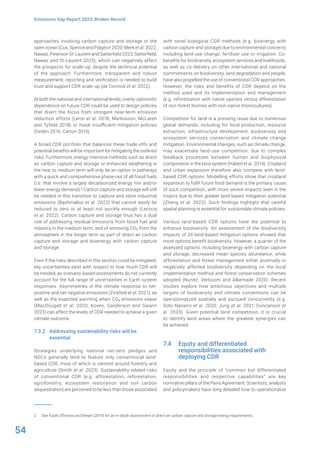
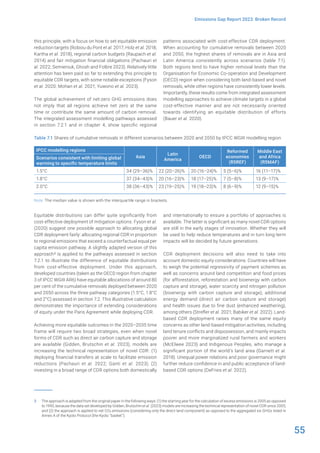

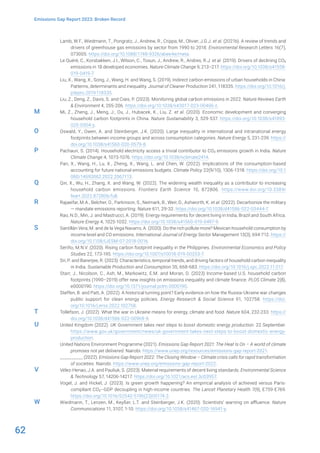
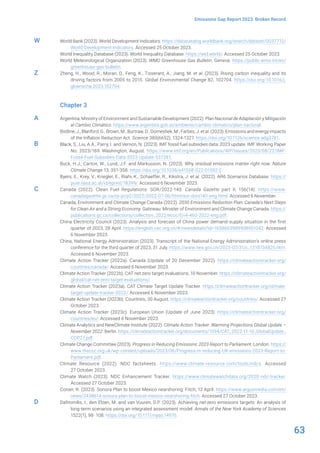
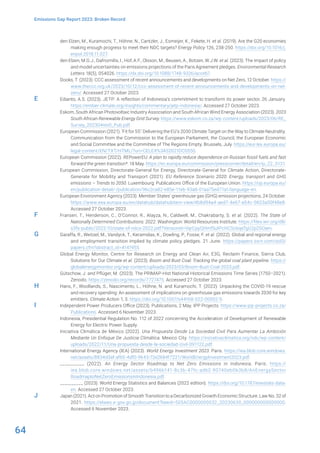


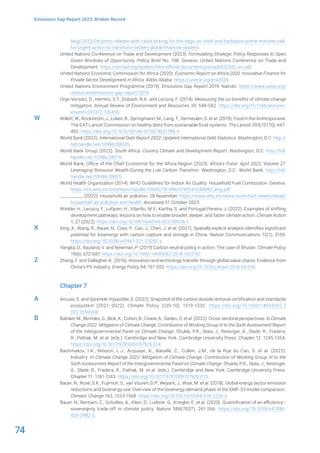
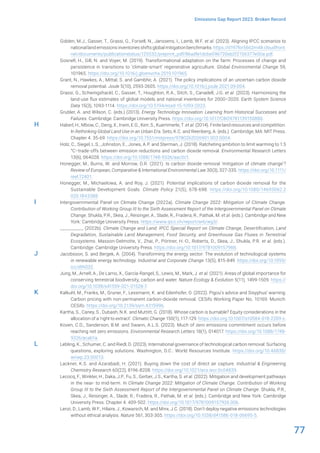
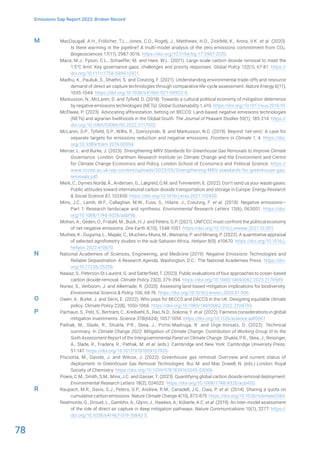
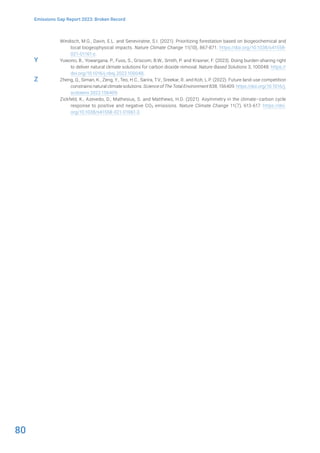
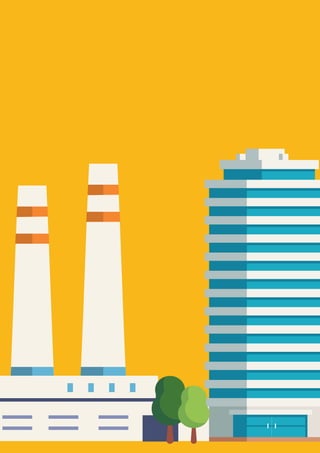

The document is the Emissions Gap Report 2023 published by the United Nations Environment Programme. It finds that global temperatures continue to hit new highs, yet worldwide emissions reductions efforts remain insufficient. The report notes temperatures are increasing despite failure by the world to significantly cut greenhouse gas emissions.


