Uncertainty and the slow labor market recovery
•
1 like•8,957 views

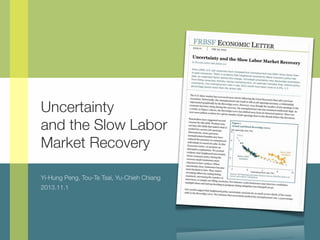
This document discusses shifts in the Beveridge curve since the 2007 recession. It begins by providing background on the Beveridge curve and how it has shifted outward since 2007, with unemployment falling more slowly as job openings rose. Previous explanations for this shift, like skills mismatches or extended unemployment benefits, are deemed insufficient. The document then presents an economic model of the labor market to derive an expression for the Beveridge curve. It suggests a rise in policy uncertainty may help explain the curve's outward shift since 2007.

Recommended
More Related Content
More from Yi-Hung Peng
More from Yi-Hung Peng (19)
Recently uploaded
Recently uploaded (20)
Uncertainty and the slow labor market recovery
- 1. Uncertainty and the Slow Labor Market Recovery Yi-Hung Peng, Tou-Te Tsai, Yu-Chieh Chiang 2013.11.1
- 2. Reporting Process 1 The Beveridge curve: Past and present 2 Measuring shifts in the Beveridge curve 3 Effects of policy uncertainty on shifts in the Beveridge curve 4 Conclusion 3
- 3. 1 The Beveridge curve: Past and present
- 4. The Beveridge curve: Past and present The history of Beveridge curve The Beveridge curve, or UV-curve, was developed in 1958 by Christopher Dow and Leslie Arthur Dicks-Mireaux. The Beveridge curve enabled economists to employ an analytical method for the decomposition of unemployment: deficient-demand (or cyclical) unemployment and structural unemployment. 5
- 5. The Beveridge curve: Past and present Likely because the Beveridgecurve enabled economists to analyze the problems Beveridge addressed, the curve was named in the 1980s after William Beveridge. 6
- 6. al y t is yed his nt nty me e Figure 1 Figure 1: Actual and fitted Beveridge Actual and fitted Beveridge curve curve Job openings rate (%) 5 Fitted 4 3 Since 2007 recession Before 2007 recession 2 1 3 5 7 Unemployment rate (%) 9 Sources: Job Openings and Labor Turnover Survey (JOLTS), Daly et al. 11 7
- 7. Actual and fitted Beveridge curve Job openings rate (%) 5 Fitted 4 3 Since 2007 recession Before 2007 recession 2 1 3 5 7 Unemployment rate (%) 9 Sources: Job Openings and Labor Turnover Survey (JOLTS), Daly et al. 11 8
- 8. Actual and fitted Beveridge curve Job openings rate (%) 5 v Fitted 4 3 Since 2007 recession Before 2007 recession 2 1 3 5 7 Unemployment rate (%) 9 Sources: Job Openings and Labor Turnover Survey (JOLTS), Daly et al. 11 8
- 9. Actual and fitted Beveridge curve Job openings rate (%) 5 v Fitted 4 3 Since 2007 recession Before 2007 recession 2 1 3 5 7 Unemployment rate (%) 9 u Sources: Job Openings and Labor Turnover Survey (JOLTS), Daly et al. 11 8
- 10. Actual and fitted Beveridge curve Job openings rate (%) 5 v Fitted Beveridge curve 4 3 Since 2007 recession Before 2007 recession 2 1 3 5 7 Unemployment rate (%) 9 u Sources: Job Openings and Labor Turnover Survey (JOLTS), Daly et al. 11 8
- 11. Actual and fitted Beveridge curve Job openings rate (%) 5 v Fitted Beveridge curve 4 Data 3 Since 2007 recession Before 2007 recession 2 1 3 5 7 Unemployment rate (%) 9 u Sources: Job Openings and Labor Turnover Survey (JOLTS), Daly et al. 11 8
- 12. Unemployment typically fell as job openings rose v u Before 2007 recession 9
- 13. Although job openings rose, unemployment fell more sluggishly. v u Since 2007 recession 10
- 14. Figure 1 Actual and fitted Beveridge curve Job openings rate (%) 5 Fitted Since late 2007, the Beveridge curve has gradually shifted outward 4 3 Since 2007 recession Before 2007 recession 2 1 3 5 7 Unemployment rate (%) 9 11 11
- 15. Job openings rate (%) 5 Fitted Since late 2007, the Beveridge curve has gradually shifted outward 4 3 Since 2007 recession Before 2007 recession 2 What has caused this shift 1 3 5 7 Unemployment rate (%) 9 11 12
- 16. The Beveridge curve: Past and present What has caused this shift Previous Explanation 13
- 17. The Beveridge curve: Past and present What has caused this shift Previous Explanation 1 “Beveridge curve may reflect a mismatch between the skills unemployed workers have and what employers are looking for.” 13
- 18. The Beveridge curve: Past and present What has caused this shift Previous Explanation 1 “Beveridge curve may reflect a mismatch between the skills unemployed workers have and what employers are looking for.” Recent research suggests that skill mismatch is probably not a main driving force 13
- 19. The Beveridge curve: Past and present What has caused this shift Previous Explanation 1 “Beveridge curve may reflect a mismatch between the skills unemployed workers have and what employers are looking for.” Recent research suggests that skill mismatch is probably not a main driving force 2 “The expansion of unemployment insurance benefits” EX:the 2008 extension of unemployment compensation. 13
- 20. The Beveridge curve: Past and present What has caused this shift Previous Explanation 1 “Beveridge curve may reflect a mismatch between the skills unemployed workers have and what employers are looking for.” Recent research suggests that skill mismatch is probably not a main driving force 2 “The expansion of unemployment insurance benefits” EX:the 2008 extension of unemployment compensation. Unemployment insurance benefits have been reduced over the past two years. 13
- 21. The Beveridge curve: Past and present 1 “Beveridge curve may reflect a mismatch between the skills unemployed workers have and what employers are looking for.” 2 “The expansion of unemployment insurance benefits” EX:the 2008 extension of unemployment compensation. Policy Uncertainty 14
- 22. 2 Measuring shifts in the Beveridge curve
- 23. Measuring shifts in the Beveridge curve A rise in the level of uncertainty about fiscal and monetary policy is a third possible explanation for the shift in the Beveridge curve. 16
- 24. Measuring shifts in the Beveridge curve A rise in the level of uncertainty about fiscal and monetary policy is a third possible explanation for the shift in the Beveridge curve. “ ” We need an economic model of the labor market. 16
- 25. Measuring shifts in the Beveridge curve !! = ! !! !! ! !!! !! !! − ! !!! !!! ! ! ! ! != ! Ω!!! ! !! 17
- 26. Measuring shifts in the Beveridge curve !! = ! !! !! ! !! !! !!! ! ! m denotes new matches (hires) being formed t != ! Ω!!! ! !! − ! !!! !!! ! ! 17
- 27. Measuring shifts in the Beveridge curve !! = ! !! !! ! !! !! !!! ! ! m denotes new matches (hires) being formed t unemployment (u) != ! Ω!!! ! !! − ! !!! !!! ! ! 17
- 28. Measuring shifts in the Beveridge curve !! = ! !! !! ! !! !! !!! ! ! m denotes new matches (hires) being formed t unemployment (u) ! Ω!!! job vacancy rate (v) != ! !! − ! !!! !!! ! ! 17
- 29. Measuring shifts in the Beveridge curve !! = ! !! !! ! !! !! !!! ! ! m denotes new matches (hires) being formed t unemployment (u) ! ! μ is= Ω!!! capturing (true) match!!! !!! ! a scale parameter ! !! − ! efficiency ! job vacancy rate (v) 17
- 30. Measuring shifts in the Beveridge curve !! = ! !! !! ! !! !! !!! ! ! m denotes new matches (hires) being formed t unemployment (u) ! ! μ is= Ω!!! capturing (true) match!!! !!! ! a scale parameter ! !! − ! efficiency ! job vacancy rate (v) at denotes firms’ recruiting intensity (for example, advertising) 17
- 31. Measuring shifts in the Beveridge curve !! = ! !! !! ! !! !! !!! ! ! m denotes new matches (hires) being formed t unemployment (u) ! ! μ is= Ω!!! capturing (true) match!!! !!! ! a scale parameter ! !! − ! efficiency ! job vacancy rate (v) at denotes firms’ recruiting intensity (for example, advertising) st denotes the search intensity of unemployed workers 17
- 32. Measuring shifts in the Beveridge curve !! = ! !! !! ! !! !! !!! ! ! m denotes new matches (hires) being formed t unemployment (u) ! ! μ is= Ω!!! capturing (true) match!!! !!! ! a scale parameter ! !! − ! efficiency ! job vacancy rate (v) (variables for the beveridge curve shifter) at denotes firms’ recruiting intensity (for example, advertising) st denotes the search intensity of unemployed workers 17
- 33. mple, advertising). Measuring shifts in the Beveridge curve Imposing the steady-state relation: hat where deno he Beveridge curve mt denotes new matches (hires) being formed unemployment (u) 18
- 34. mple, advertising). Measuring shifts in the Beveridge curve Imposing the steady-state relation: hat where deno he Beveridge curve δ denotes the job separation rate mt denotes new matches (hires) being formed unemployment (u) 18
- 35. ensity (for example, advertising). Measuring shifts in the Beveridge curve -state relation that where denotes xpression for the Beveridge curve ! !!! !! = ! !! !! !! !! ! ! 1−α a ). != ! Ω!!! ! !! − ! !!! !!! ! ! uced-form representation of all factors that can shift 19
- 36. ensity (for example, advertising). Measuring shifts in the Beveridge curve -state relation that where denotes xpression for the Beveridge curve ! !!! !! = ! !! !! !! !! ! ! 1−α a ). != ! Ω!!! ! !! − ! !!! !!! ! ! uced-form representation of all factors that can shift 19
- 37. ensity (for example, advertising). Measuring shifts in the Beveridge curve -state relation that where denotes xpression for the Beveridge curve ! !!! !! =! ! !! ! ! !! !! !!! ! ! !! ! ! ! = ! ! 1−α a ). ! ! ! ! ! ! The expression for the Beveridge curve ! ! != != Ω!!! ! Ω!!! ! ! !! !! − !!! !!! ! ! ! − !!! !!! ! ! uced-form representation of all factors that can shift 19
- 38. ensity (for example, advertising). Measuring shifts in the Beveridge curve -state relation that where denotes xpression for the Beveridge curve ! !!! !! =! ! !! ! ! !! !! !!! ! ! !! ! ! ! = ! ! 1−α a ). ! ! ! ! ! ! The expression for the Beveridge curve ! ! != != Ω!!! ! Ω!!! ! ! !! !! − !!! !!! ! ! ! − !!! !!! ! ! uced-form representation of all factors that can shift 19
- 39. ensity (for example, advertising). Measuring shifts in the Beveridge curve -state relation that where denotes xpression for the Beveridge curve ! !!! !! =! ! !! ! ! !! !! !!! ! ! !! ! ! ! = ! ! 1−α a ). ! ! ! ! ! ! The expression for the Beveridge curve ! ! != != Ω!!! ! Ω!!! ! ! !! !! − !!! !!! ! ! ! − !!! !!! ! ! uced-form representation of all factors that can shift 19
- 40. ensity (for example, advertising). Measuring shifts in the Beveridge curve -state relation that where denotes xpression for the Beveridge curve ! !!! !! =! ! !! ! ! !! !! !!! ! ! !! ! ! ! = ! ! 1−α a ). ! ! ! ! ! ! The expression for the Beveridge curve ! ! != != Ω!!! ! Ω!!! ! ! !! !! − !!! !!! ! ! ! − !!! !!! ! ! uced-form representation of all factors that can shift 19
- 41. ensity (for example, advertising). (1) Measuring shifts in the Beveridge curve where mt denotes new matches (hires) being formed, -state relation that denotes match efficiency, st denotes the whereintensity of un search xpressionfirms’the Beveridge curveexample, advertising) for recruiting intensity (for ! !!! !! =! ! !! ! ! !! !! !!! ! ! !! ! ! !! = !! ! ! ! Imposing the steady-state relation that ! 1−α a ). !rate, The expression forexpression for the Beveridge curv we obtain the the Beveridge curve! ! != != (2) Ω!!! ! Ω!!! ! ! !! !! − !!! !!! ! ! ! − !!! !!! ! ! ( of all. factors curve shifter shift ) Beveridge that can uced-form representation α 1−α where Ω ≡ δ / µ s a 19
- 42. (2) Measuring shifts in the Beveridge curve ( α 1−α where Ω ≡ δ / µ s a ). The term is a reduced-form repre δ denotes the job separation rate μ a scale Weis callparameter capturing (true) match efficiency the “Beveridge curve sh a denotes firms’ recruiting intensity (for example, advertising) Beveridge curve. unemployed workers s denotes the search intensity of t t 20
- 43. (2) Measuring shifts in the Beveridge curve ( α 1−α where Ω ≡ δ / µ s a ). Ω is the “Beveridge curve shifter”, the reduced-form representation of all factors that can shift the Beveridge curve The term is a reduced-form repre δ denotes the job separation rate μ a scale Weis callparameter capturing (true) match efficiency the “Beveridge curve sh a denotes firms’ recruiting intensity (for example, advertising) Beveridge curve. unemployed workers s denotes the search intensity of t t 20
- 44. (2) Measuring shifts in the Beveridge curve ( α 1−α where Ω ≡ δ / µ s a ). Ω is the “Beveridge curve shifter”, the reduced-form representation of all factors that can shift the Beveridge curve Increased Ω leads to an outward shift in the curve. The term is a reduced-form repre δ denotes the job separation rate μ a scale Weis callparameter capturing (true) match efficiency the “Beveridge curve sh a denotes firms’ recruiting intensity (for example, advertising) Beveridge curve. unemployed workers s denotes the search intensity of t t 20
- 45. al y t is yed his nt nty me e Figure 1 Figure 1: Actual and fitted Beveridge Actual and fitted Beveridge curve curve Job openings rate (%) 5 Fitted 4 3 Since 2007 recession Before 2007 recession 2 1 3 5 7 Unemployment rate (%) 9 Sources: Job Openings and Labor Turnover Survey (JOLTS), Daly et al. 11 21
- 46. Imposing the steady-state relation tha rate, we obtain the expression for the (2) Since 200 recessio Beveridge curve shifter: Original State ( α 1−α where Ω ≡ δ / µ s a ). The term is a reduced-form repres We call the “Beveridge curve shift Beveridge curve. We construct a time series for usin Beveridge curve relation in equation job separation rate is taken from th the U.S. Bureau of Labor Statistics. 22
- 47. Imposing the steady-state relation tha rate, we obtain the expression for the (2) Beveridge curve shifter: Increase Ω→Outward shift ( α 1−α where Ω ≡ δ / µ s a ). Since 2 recess The term is a reduced-form repres We call the “Beveridge curve shift Beveridge curve. We construct a time series for usin Beveridge curve relation in equation job separation rate is taken from th the U.S. Bureau of Labor Statistics. 23
- 48. (2) ( α 1−α where Ω ≡ δ / µ s a ). Increased Ω leads to an outward shift in the curve. The term is a reduced-form representat We call the “Beveridge Since 2007 curve shifter.” recession Beveridge curve. We construct a time series for using da Beveridge curve relation in equation (2), job separation rate is taken from the 24 Job
- 49. Measuring shifts in the Beveridge curve Policy Uncertainty 25
- 50. Measuring shifts in the Beveridge curve Policy Uncertainty Newspaper articles discussing economic policy uncertainty 25
- 51. Measuring shifts in the Beveridge curve Policy Uncertainty Newspaper articles discussing economic policy uncertainty Tax code provisions scheduled to expire 25
- 52. Measuring shifts in the Beveridge curve Policy Uncertainty Newspaper articles discussing economic policy uncertainty Tax code provisions scheduled to expire The extent of disagreements among economic forecasters about such variables as future levels of inflation and government spending 25
- 53. ve s on he Figure 2 Figure 2: Beveridge curve shifter and policy uncertainty Beveridge curve shifter and policy uncertainty Index 3.0 2.5 Percent 7.0 Recruiting intensity (left axis) 6.5 6.0 2.0 1.5 5.5 Policy uncertainty (left axis) 5.0 4.5 1.0 0.5 Beveridge curve shifter (right axis) 0.0 00 01 02 03 04 05 06 Note: Three-month moving average. 4.0 3.5 3.0 07 08 09 10 11 12 26
- 54. 2.5 2.0 and the job vacancy rate (v), can be derived from a general matc Recruiting intensity following form(left axis) (see Pissarides 2000, chapter 5): 6.5 6.0 (1) 5.5 where mt denotes uncertainty (hires) being formed, µ is a scale Policy new matches 5.0 1.5 match efficiency, s denotes the search intensity of unemployed (left axis) t firms’ recruiting intensity (for example, advertising). 4.5 1.0 4.0 Beveridge curve shifter relation that (right axis) where 3.5 0.5 Imposing the steady-state rate, we obtain the expression for the Beveridge curve 0.0 3.0 00 01 02 03 04 05 06 (2) Note: Three-month moving average. 07 08 09 10 11 12 Beveridge curve shifter ( α 1−α ) where Ω ≡ δ / µ s a . to a higher unemployment rate for a given number of job 27 d
- 55. efficiency is a broad concept that encompasses a range of variables, from filling vacancies, thereby raising unemployment. An estimate indicates that, without policy ecruit new employees. If the process of matching workers and jobs uncertainty, the unemployment rate in late 2012 would have been close to 6.5%, 1.3 curve shifts to the right, meaning that, for a given job vacancy rate, percentage points lower than the actual rate. her. Measuring shifts in the Beveridge curve loyment rate and the vacancy rate to quantify changes in job match The U.S. labor market has recovered more slowly following the Great Recession than after previous t we call the “Beveridge curve shifter.” In Figure 2, the blue line recessions. Historically, the unemployment rate tends to fall as job openings increase, a relationship Beveridge curve shifter has increased substantially, consistent with urve displayed in Figure 1.represented graphically by the Beveridge curve. However, even though the number of job openings in the economy has been rising during the recovery, the unemployment rate has remained stubbornly high. As onomic policy uncertaintya result, asby Baker, Bloom, and Davis developed Figure 1 shows, the Beveridge curve has shifted away from its historical pattern. There are now more jobless workers for a given number of job openings than in the decade before the downturn. lume of newspaper articles discussing economic policy uncertainty, heduled to expire, and the extent of disagreements among economic Researchers have suggested several Figure 1 Figure 2 reasons for this shift. Workers may Actual and fitted Beveridge curve Beveridge curve shifter and policy uncertainty what is not have the skills that match Index Percent Job openings rate (%) needed for current job openings. 7.0 5 3.0 Recruiting intensity Alternatively, more generous Fitted (left axis) 6.5 2.5 unemployment benefits may have n 4 6.0 reduced the pressure on unemployed 2.0 5.5 individuals to search for jobs. In this Policy uncertainty Economic Letter, we propose an 5.0 3 1.5 (left axis) Since 2007 alternative explanation. We present recession 4.5 1.0 evidence that heightened uncertainty Before 2007 recession about economic policy during the 4.0 2 Beveridge curve shifter 0.5 e (right axis) recovery made businesses more 3.5 reluctant to hire workers. When 0.0 3.0 1 businesses become 00 01 02 03 uncertainty rises,08 09 10 11 12 04 05 06 07 3 5 7 9 11 Unemployment rate (%) Note: Three-month moving average. more hesitant to hire. They reduce Sources: Job Openings and Labor Turnover Survey (JOLTS), Daly et al. recruiting efforts by raising hiring (2012), and authors’ calculations. ads to a higher unemployment rate for a given number of job standards, increasing the number of ge curve outward. The green dashed line in Figure 2 indicates that, interviews, or simply not filling vacancies. For instance, some businesses may interview candidates 28
- 56. efficiency is a broad concept that encompasses a range of variables, from filling vacancies, thereby raising unemployment. An estimate indicates that, without policy ecruit new employees. If the process of matching workers and jobs uncertainty, the unemployment rate in late 2012 would have been close to 6.5%, 1.3 curve shifts to the right, meaning that, for a given job vacancy rate, percentage points lower than the actual rate. her. Measuring shifts in the Beveridge curve loyment rate and the vacancy rate to quantify changes in job match The U.S. labor market has recovered more slowly following the Great Recession than after previous t we call the “Beveridge curve shifter.” In Figure 2, the blue line recessions. Historically, the unemployment rate tends to fall as job openings increase, a relationship Beveridge curve shifter has increased substantially, consistent with urve displayed in Figure 1.represented graphically by the Beveridge curve. However, even though the number of job openings in the economy has been rising during the recovery, the unemployment rate has remained stubbornly high. As onomic policy uncertaintya result, asby Baker, Bloom, and Davis developed Figure 1 shows, the Beveridge curve has shifted away from its historical pattern. There are now more jobless workers for a given number of job openings than in the decade before the downturn. lume of newspaper articles discussing economic policy uncertainty, Policy Uncertainty & Beveridge curve shifter heduled to expire, and the extent of disagreements among economic Researchers have suggested several Figure 1 Figure 2 reasons for this shift. Workers may Actual and fitted Beveridge curve Beveridge curve shifter and policy uncertainty what is not have the skills that match Index Percent Job openings rate (%) needed for current job openings. 7.0 5 3.0 Recruiting intensity Alternatively, more generous Fitted (left axis) 6.5 2.5 unemployment benefits may have n 4 6.0 reduced the pressure on unemployed 2.0 5.5 individuals to search for jobs. In this Policy uncertainty Economic Letter, we propose an 5.0 3 1.5 (left axis) Since 2007 alternative explanation. We present recession 4.5 1.0 evidence that heightened uncertainty Before 2007 recession about economic policy during the 4.0 2 Beveridge curve shifter 0.5 e (right axis) recovery made businesses more 3.5 reluctant to hire workers. When 0.0 3.0 1 businesses become 00 01 02 03 uncertainty rises,08 09 10 11 12 04 05 06 07 3 5 7 9 11 Unemployment rate (%) Note: Three-month moving average. more hesitant to hire. They reduce Sources: Job Openings and Labor Turnover Survey (JOLTS), Daly et al. recruiting efforts by raising hiring (2012), and authors’ calculations. ads to a higher unemployment rate for a given number of job standards, increasing the number of ge curve outward. The green dashed line in Figure 2 indicates that, interviews, or simply not filling vacancies. For instance, some businesses may interview candidates 28
- 57. 3 Effects of policy uncertainty on shifts in the Beveridge curve
- 58. Effects of policy uncertainty on shifts in the Beveridge curve “ How much heightened policy uncertainty may have contributed to this shift? ” V U Ω Job vacancy rate Unemployment rate Beveridge curve shifter Policy uncertainty 30
- 59. s of uncertainty on the unemployment rate in our theoretical model, ge cy e he id ly n ty the Figure 3 Figure 3: Policy uncertainty and shifts in the Beveridge Policy uncertainty and shifts in the Beveridge curve curve Job openings rate (%) 5 Fitted 4 Since 2007 recession implied by policy uncertainty 3 Since 2007 recession Before 2007 recession 2 1 3 5 7 9 Unemployment rate (%) Sources: JOLTS, Daly et al. (2012), and authors’ calculations. 11 31
- 60. 7 Part of the Beveridge curve that has been driven by policy uncertainty, based on estimates we put into our statistical model. Since 2007 recession implied by policy uncertainty Since rece 32
- 61. Part of the Beveridge curve that has been driven by policy uncertainty, based on estimates we put into our statistical model. However, beginning in autumn 2009, policy uncertainty became an increasingly important factor behind the shift in the Beveridge curve. Since 2007 recession implied by policy uncertainty Since 2007 recession 33
- 62. Effects of policy uncertainty on shifts in the Beveridge curve Heighted uncertainty may have contributed to the shift Our results suggests that, in late 2012, if there had been no policy uncertainty shocks, The unemployment rate would have been close to 6.5% instead of the reported 7.8%. 34
- 63. Effects of policy uncertainty on shifts in the Beveridge curve Conclusion 35
- 64. Effects of policy uncertainty on shifts in the Beveridge curve Conclusion All else equal 35
- 65. Effects of policy uncertainty on shifts in the Beveridge curve Conclusion All else equal Increase in policy uncertainty 35
- 66. Effects of policy uncertainty on shifts in the Beveridge curve Conclusion All else equal Increase in policy uncertainty Significant decline in recruiting intensity 35
- 67. Conclusion 4
- 68. Conclusion In an uncertain economic environment, businesses reduce their recruiting intensity. As the economy recovers and uncertainty recedes, the Beveridge curve should return to its pre-recession position and the pace of job recovery should accelerate. 37
- 69. Thank You For Listening =)