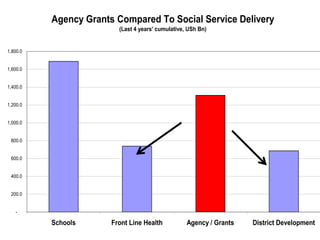
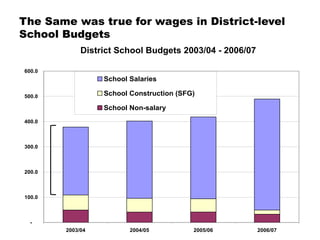
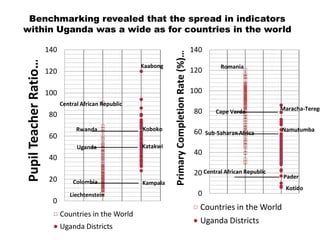
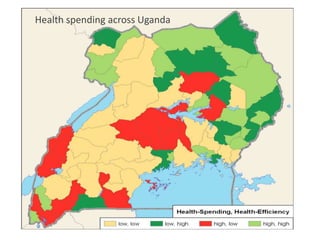
The first BOOST:
Lessons about
Health
Expenditures in
Uganda


The World Bank Group
Uganda: Budget Composition -
                                         Before and After the BOOST-based Public Expenditure Reviews
                         1,800,000,000

                                                                                           Wages
                         1,600,000,000


                                            BEFORE
                         1,400,000,000
                                                                  AFTER                    Transfers/Grants
                         1,200,000,000
'000 Ugandan Shillings


                         1,000,000,000
                                                                                           Non-Wage
                                                                                           Employee Costs
                          800,000,000
                                                                                           Gross Fixed Capital
                          600,000,000                                                      Formation
                          400,000,000                                                      Goods and Services

                          200,000,000


                                    0
                                             2003/04         2006/07        2009/10
Agency Grants Compared To Social Service Delivery
                         (Last 4 years' cumulative, USh Bn)


1,800.0


1,600.0


1,400.0


1,200.0


1,000.0


 800.0


 600.0


 400.0


 200.0


   -

          Schools      Front Line Health           Agency / Grants   District Development
In Districts … all of the increase in health was wage growth…

             District Health Budgets 2003/04 - 2006/07 (Bn)
        (During this period, UNHS data suggests the number of people seeking care
            from public health centers and dispensaries increased by over 50%)
120.0


100.0

                                                                           District Public
                                                                           Health Wage
 80.0


                                                                           District Public
 60.0
                                                                           Health Non-Wage


 40.0
                                                                           District PHC
                                                                           Buildings

 20.0


  -
           2003/4         2004/05         2005/06         2006/07
The Same was true for wages in District-level
School Budgets
             District School Budgets 2003/04 - 2006/07

600.0
                  School Salaries

500.0             School Construction (SFG)

                  School Non-salary
400.0


300.0


200.0


100.0


  -
        2003/04          2004/05          2005/06        2006/07
Within Districts, there were large differences in relative
Efficiency in Education


                                             P7 Completion Rate (vertical axis)
                                Adult Literacy Rate (horizontal axis) and Primary Education
                         120.00%Expenditure Per Student (Avg. 2004 -2008) (size of bubbles)


                         100.00%
P7 Completion Rate (%)


                                                                    Bukwo
                          80.00%                                    52,317.24 UShs    Wakiso
                                       Abim                                           41,137.49 UShs
       (2008)


                                                               Kumi
                          60.00%
                                                               49,388.93 UShs          Kampala
                          40.00%


                          20.00%       Kotido                              Kalangala
                                       55,237.01 UShs                      135,180.90 UShs
                           0.00%
                               0.00%     20.00%     40.00%      60.00%     80.00%    100.00%   120.00%
                                                        Adult Literacy Rate (%)
                                                                 (2007)
Benchmarking revealed that the spread in indicators
within Uganda was a wide as for countries in the world

                       140                                                                       140


                                                                  Primary Completion Rate (%)…
Pupil Teacher Ratio…

                                                        Kaabong                                             Romania
                       120                                                                       120

                       100                                                                       100
                             Central African Republic
                                                                                                 80       Cape Verde           Maracha-Terego
                       80
                                   Rwanda               Koboko                                   60                            Namutumba
                                                                                                       Sub-Saharan Africa
                       60
                                   Uganda               Katakwi
                                                                                                 40
                       40
                                                                                                 20 Central African Republic    Pader
                       20         Colombia              Kampala
                                                                                                                                Kotido
                                Liechtenstein                                                     0
                        0
                                                                                                   Countries in the World
                             Countries in the World
                                                                                                   Uganda Districts
                             Uganda Districts
Relationship between Life Expectancy (vertical axis) and GDP Per Capita (PPP$)
                                   (horizontal axis) and Health Expenditure Per Capita (US$) (2006-2007 average) (size of
                                                                         bubbles)
                         100.00


                          90.00
Life Expectancy (2007)


                          80.00


                          70.00                               Uzbekistan


                          60.00


                                                                                                                Namibia
                          50.00                                            Jinja
                                                                                                 Kampala

                          40.00


                          30.00


                          20.00
                                  0.00          1,000.00       2,000.00            3,000.00   4,000.00        5,000.00      6,000.00

                                                               GDP Per Capita (PPP$) (2007)

                                                    Uganda Districts               Countries in the World
Health spending across Uganda

Uganda BOOST

  • 1.
    The first BOOST: Lessonsabout Health Expenditures in Uganda The World Bank Group
  • 2.
    Uganda: Budget Composition- Before and After the BOOST-based Public Expenditure Reviews 1,800,000,000 Wages 1,600,000,000 BEFORE 1,400,000,000 AFTER Transfers/Grants 1,200,000,000 '000 Ugandan Shillings 1,000,000,000 Non-Wage Employee Costs 800,000,000 Gross Fixed Capital 600,000,000 Formation 400,000,000 Goods and Services 200,000,000 0 2003/04 2006/07 2009/10
  • 3.
    Agency Grants ComparedTo Social Service Delivery (Last 4 years' cumulative, USh Bn) 1,800.0 1,600.0 1,400.0 1,200.0 1,000.0 800.0 600.0 400.0 200.0 - Schools Front Line Health Agency / Grants District Development
  • 4.
    In Districts …all of the increase in health was wage growth… District Health Budgets 2003/04 - 2006/07 (Bn) (During this period, UNHS data suggests the number of people seeking care from public health centers and dispensaries increased by over 50%) 120.0 100.0 District Public Health Wage 80.0 District Public 60.0 Health Non-Wage 40.0 District PHC Buildings 20.0 - 2003/4 2004/05 2005/06 2006/07
  • 5.
    The Same wastrue for wages in District-level School Budgets District School Budgets 2003/04 - 2006/07 600.0 School Salaries 500.0 School Construction (SFG) School Non-salary 400.0 300.0 200.0 100.0 - 2003/04 2004/05 2005/06 2006/07
  • 6.
    Within Districts, therewere large differences in relative Efficiency in Education P7 Completion Rate (vertical axis) Adult Literacy Rate (horizontal axis) and Primary Education 120.00%Expenditure Per Student (Avg. 2004 -2008) (size of bubbles) 100.00% P7 Completion Rate (%) Bukwo 80.00% 52,317.24 UShs Wakiso Abim 41,137.49 UShs (2008) Kumi 60.00% 49,388.93 UShs Kampala 40.00% 20.00% Kotido Kalangala 55,237.01 UShs 135,180.90 UShs 0.00% 0.00% 20.00% 40.00% 60.00% 80.00% 100.00% 120.00% Adult Literacy Rate (%) (2007)
  • 7.
    Benchmarking revealed thatthe spread in indicators within Uganda was a wide as for countries in the world 140 140 Primary Completion Rate (%)… Pupil Teacher Ratio… Kaabong Romania 120 120 100 100 Central African Republic 80 Cape Verde Maracha-Terego 80 Rwanda Koboko 60 Namutumba Sub-Saharan Africa 60 Uganda Katakwi 40 40 20 Central African Republic Pader 20 Colombia Kampala Kotido Liechtenstein 0 0 Countries in the World Countries in the World Uganda Districts Uganda Districts
  • 8.
    Relationship between LifeExpectancy (vertical axis) and GDP Per Capita (PPP$) (horizontal axis) and Health Expenditure Per Capita (US$) (2006-2007 average) (size of bubbles) 100.00 90.00 Life Expectancy (2007) 80.00 70.00 Uzbekistan 60.00 Namibia 50.00 Jinja Kampala 40.00 30.00 20.00 0.00 1,000.00 2,000.00 3,000.00 4,000.00 5,000.00 6,000.00 GDP Per Capita (PPP$) (2007) Uganda Districts Countries in the World
  • 9.

Editor's Notes

  • #3  In 2007/2008 the World Bank Uganda PREM team created the world’s first “BOOST” data tool. BOOST Analysis allowed the team to see the big picture in terms of trends in spending trends in Uganda. During the period 2003/04 to 2006/07 the focus of public expenditure analysis and dialogue in Uganda was on fixing budget implementation processes (see PERs 2003, 2004). Budget composition was deteriorating - fewer and fewer non-staff resources were available for front-line services, and infrastructure bottlenecks were emerging (See CEM 2007). However, our WB budget analysis tended to be forward looking, and sector based, following multi-donor dialogue around the MTEF. There was no thorough backward look at budget trends, and no single disaggregated database was available to de-compose the budget by economic, sector, or organizational levels. BOOST changed this. Created under the 2007 PER and developed under the 2008 PER, BOOST shone more light on damaging trends which were emerging in budget composition. These trends had not been clearly identified under 4 annual multi-donor budget support operations. Government subsequently moved to address underspending on infrastructure, and sought efficiency gains from staff budgets, eg by reducing absenteeism.
  • #4  Despite all the Budget Support that donors were providing, Central Agency grants were rising faster than front-line health service funding. Additional funding for agencies was almost twice the increase in District Development Budgets from 2003/4 to 2006/7
  • #5  One of the striking findings was that even though numbers of people seeking care from public health centers and dispensaries had increased by 50%, non-salary funding at District level was frozen in nominal terms.
  • #6  Similarly, all of the increase in District school funding was going to teacher salaries.
  • #7  BOOST allowed the PER team to link spending to results in Ugandan Districts for the first time This revealed wide differences in relative performance, even for similar Districts with similar endowments in adult literacy. This allowed the team to discuss possible management reasons for the differences, in addition to seeking more funding for services, Government started looking to increase the efficiency of funding
  • #8  Benchmarking revealed that the spread of indicators within Uganda was as wide as for countries around the world
  • #9  This was even truer in health,where life expectancy varied as much between Districtin Uganda as it did countries in the world.
  • #10  Connecting spending to these wide ranging results by District under the BOOST allowed the PER team in the health sector to consider spending and efficiency on a spatial basis The resultant map made it clear that spending was lowest and relative efficiency was highest in the poorest Districts of the country (North and East)