This document provides an investor presentation for Ultra Clean Holdings, Inc. for Fall 2017. Some key points:
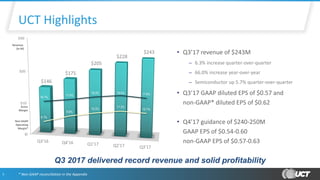
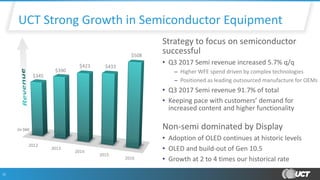
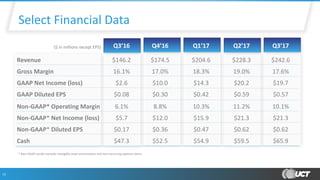
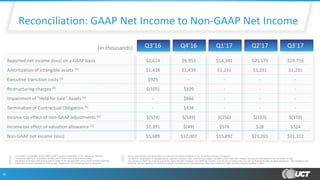
- Q3 2017 saw record revenue of $243 million, a 6.3% increase over Q2 2017, driven by growth in the semiconductor market. Non-GAAP diluted EPS was $0.62.
- Guidance for Q4 2017 is for revenue of $240-250 million and non-GAAP EPS of $0.57-0.63.
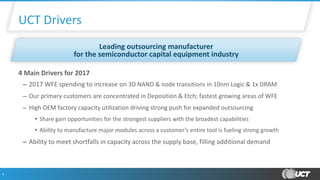
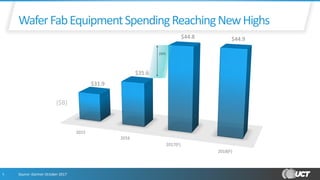
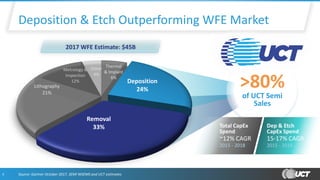
- The semiconductor market is expected to grow through 2017 due to increasing spending on memory technologies like 3D NAND and logic nodes. Ultra Clean is well positioned in the fast growing deposition and etch segments.
-