Download to read offline

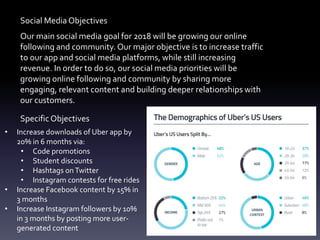
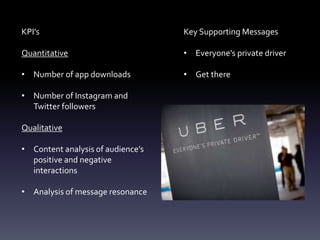
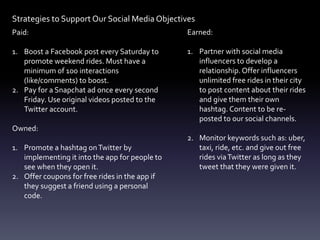

The social media strategy document outlines Uber's goals of growing its online community and increasing app usage and revenue. Key objectives include boosting app downloads, Facebook content, and Instagram followers. The strategy involves paid, owned, and earned media tactics like Facebook boosting, in-app promotions, and influencer partnerships. Progress will be measured quantitatively by metrics like followers and traffic, and qualitatively through sentiment analysis of social interactions.


