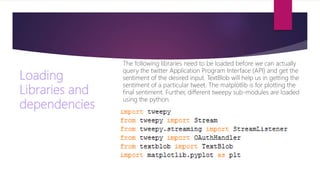
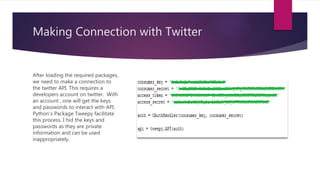
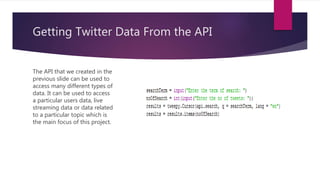
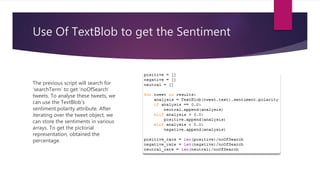
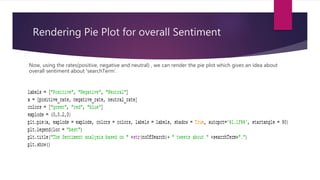
This is small twitter sentiment analysis project which will take one keyword(which is the primary way of storing the tweet in Twitter) and number of tweets, and gives you the pictorial representation of the overall sentiment.
Sentiment analysis of Twitter data using pythonHetu Bhavsar
Twitter is a popular social networking website where users posts and interact with messages known as “tweets”. To automate the analysis of such data, the area of Sentiment Analysis has emerged. It aims at identifying opinionative data in the Web and classifying them according to their polarity, i.e., whether they carry a positive or negative connotation. We will attempt to conduct sentiment analysis on “tweets” using various different machine learning algorithms.
SentiTweet is a sentiment analysis tool for identifying the sentiment of the tweets as positive, negative and neutral.SentiTweet comes to rescue to find the sentiment of a single tweet or a set of tweets. Not only that it also enables you to find out the sentiment of the entire tweet or specific phrases of the tweet.
Project Report for Twitter Sentiment Analysis done using Apache Flume and data is analysed using Hive.
I intend to address the following questions:
How raw tweets can be used to find audience’s perception or sentiment about a person ?
How Hadoop can be used to solve this problem?
How Apache Hive can be used to organize the final data in a tabular format and query it?
How a data visualization tool can be used to display the findings?
Sentiment Analysis/Opinion Mining of Twitter Data on Unigram/Bigram/Unigram+Bigram Model using:
1. Machine Learning
2. Lexical Scores
3. Emoticon Scores
YouTube Video: https://youtu.be/VuR16P87yPE
Link to the WebPage: http://akirato.github.io/Twitter-Sentiment-Analysis-Tool
Github Page: https://github.com/Akirato/Twitter-Sentiment-Analysis-Tool
Sentiment analysis - Our approach and use casesKarol Chlasta
I. Introduction to Sentiment Analysis and its applications.
II. How to approach Sentiment Analysis?
III. 2015 Elections in Poland on Twitter.com & Onet.pl.
Cloud Technologies providing Complete Solution for all
AcademicProjects Final Year/Semester Student Projects
For More Details,
Contact:
Mobile:- +91 8121953811,
whatsapp:- +91 8522991105,
Office:- 040-66411811
Email ID: cloudtechnologiesprojects@gmail.com
Sentiment analysis in twitter using python
This presentation consist of detail description regarding how social media sentiments analysis is performed , what is its scope and benefits in real life scenario.
Make a query regarding a topic of interest and come to know the sentiment for the day in pie-chart or for the week in form of line-chart for the tweets gathered from twitter.com
Sentiment analysis is essential operation to understand the polarity of particular text, blog etc. This presentation has introduction to SA and the approaches in which they can be designed.
Sentiment analysis is the interpretation and classification of emotions (positive, negative and neutral) within text data using text analysis techniques. Sentiment analysis allows businesses to identify customer sentiment toward products, brands or services in online conversations and feedback
Sentiment Analysis of tweets which are extracted using twitter API and applying various filters according to the use . The sentiment analysis is done using the Afinn dictionary which is a dictionary consisting of words with their corresponding rating. A rating between +5 and -5 . A positive rating is indicated a positive statement and a negative rating indicated a negative one and a rating of 0 indicates a neutral statement.
MOVIE RATING PREDICTION BASED ON TWITTER SENTIMENT ANALYSISEditor Jacotech
With microblogging platforms such as Twitter generating
huge amounts of textual data every day, the possibilities of
knowledge discovery through Twitter data becomes
increasingly relevant. Similar to the public voting mechanism
on websites such as the Internet Movie Database (IMDb) that
aggregates movies ratings, Twitter content contains
reflections of public opinion about movies. This study aims to
explore the use of Twitter content as textual data for
predicting the movie rating. In this study, we extract number
of tweets and compiled to predict the rating scores of newly
released movies. Predictions were done with the algorithms,
exploring the tweet polarity. In addition, this study explores
the use of several different kinds of tweet classification
Algorithm and movie rating algorithm. Results show that
movie rating developed by our application is compared to
IMDB and Rotten Tomatoes.
With the rise of social networking epoch, there has been a surge of user generated content. Micro blogging sites have millions of people sharing their thoughts daily because of its characteristic short and simple manner of expression. We propose and investigate a paradigm to mine the sentiment from a popular real-time micro blogging service, Twitter, where users post real time reactions to and opinions about “everything”. In this paper, we expound a hybrid approach using both corpus based and dictionary based methods to determine the semantic orientation of the opinion words in tweets. A case study is presented to illustrate the use and effectiveness of the proposed system.
Twitter Sentiment Analysis Project Done using R.
In these Project we deal with the tweets database that are avaialble to us by the Twitter. We clean the tweets and break them out into tokens and than analysis each word using Bag of Word concept and than rate each word on the basis of the score wheter it is positive, negative and neutral.
We used Naive Baye's Classifier as our base.
What Is Sentiment Analysis?
Problem Statement
Why Twitter data?
The Process at a Glance
Methodology: How are we doing it?
Pre-processing of the datasets
Extract the candidate or take it as user input.
Calculate sentiment
Visualizing the candidate data
What visualization are we talking about?
Show drafts
volume_up
Empowering the Data Analytics Ecosystem: A Laser Focus on Value
The data analytics ecosystem thrives when every component functions at its peak, unlocking the true potential of data. Here's a laser focus on key areas for an empowered ecosystem:
1. Democratize Access, Not Data:
Granular Access Controls: Provide users with self-service tools tailored to their specific needs, preventing data overload and misuse.
Data Catalogs: Implement robust data catalogs for easy discovery and understanding of available data sources.
2. Foster Collaboration with Clear Roles:
Data Mesh Architecture: Break down data silos by creating a distributed data ownership model with clear ownership and responsibilities.
Collaborative Workspaces: Utilize interactive platforms where data scientists, analysts, and domain experts can work seamlessly together.
3. Leverage Advanced Analytics Strategically:
AI-powered Automation: Automate repetitive tasks like data cleaning and feature engineering, freeing up data talent for higher-level analysis.
Right-Tool Selection: Strategically choose the most effective advanced analytics techniques (e.g., AI, ML) based on specific business problems.
4. Prioritize Data Quality with Automation:
Automated Data Validation: Implement automated data quality checks to identify and rectify errors at the source, minimizing downstream issues.
Data Lineage Tracking: Track the flow of data throughout the ecosystem, ensuring transparency and facilitating root cause analysis for errors.
5. Cultivate a Data-Driven Mindset:
Metrics-Driven Performance Management: Align KPIs and performance metrics with data-driven insights to ensure actionable decision making.
Data Storytelling Workshops: Equip stakeholders with the skills to translate complex data findings into compelling narratives that drive action.
Benefits of a Precise Ecosystem:
Sharpened Focus: Precise access and clear roles ensure everyone works with the most relevant data, maximizing efficiency.
Actionable Insights: Strategic analytics and automated quality checks lead to more reliable and actionable data insights.
Continuous Improvement: Data-driven performance management fosters a culture of learning and continuous improvement.
Sustainable Growth: Empowered by data, organizations can make informed decisions to drive sustainable growth and innovation.
By focusing on these precise actions, organizations can create an empowered data analytics ecosystem that delivers real value by driving data-driven decisions and maximizing the return on their data investment.
Data Centers - Striving Within A Narrow Range - Research Report - MCG - May 2...pchutichetpong
M Capital Group (“MCG”) expects to see demand and the changing evolution of supply, facilitated through institutional investment rotation out of offices and into work from home (“WFH”), while the ever-expanding need for data storage as global internet usage expands, with experts predicting 5.3 billion users by 2023. These market factors will be underpinned by technological changes, such as progressing cloud services and edge sites, allowing the industry to see strong expected annual growth of 13% over the next 4 years.
Whilst competitive headwinds remain, represented through the recent second bankruptcy filing of Sungard, which blames “COVID-19 and other macroeconomic trends including delayed customer spending decisions, insourcing and reductions in IT spending, energy inflation and reduction in demand for certain services”, the industry has seen key adjustments, where MCG believes that engineering cost management and technological innovation will be paramount to success.
MCG reports that the more favorable market conditions expected over the next few years, helped by the winding down of pandemic restrictions and a hybrid working environment will be driving market momentum forward. The continuous injection of capital by alternative investment firms, as well as the growing infrastructural investment from cloud service providers and social media companies, whose revenues are expected to grow over 3.6x larger by value in 2026, will likely help propel center provision and innovation. These factors paint a promising picture for the industry players that offset rising input costs and adapt to new technologies.
According to M Capital Group: “Specifically, the long-term cost-saving opportunities available from the rise of remote managing will likely aid value growth for the industry. Through margin optimization and further availability of capital for reinvestment, strong players will maintain their competitive foothold, while weaker players exit the market to balance supply and demand.”
Explore our comprehensive data analysis project presentation on predicting product ad campaign performance. Learn how data-driven insights can optimize your marketing strategies and enhance campaign effectiveness. Perfect for professionals and students looking to understand the power of data analysis in advertising. for more details visit: https://bostoninstituteofanalytics.org/data-science-and-artificial-intelligence/
Chatty Kathy - UNC Bootcamp Final Project Presentation - Final Version - 5.23...John Andrews
SlideShare Description for "Chatty Kathy - UNC Bootcamp Final Project Presentation"
Title: Chatty Kathy: Enhancing Physical Activity Among Older Adults
Description:
Discover how Chatty Kathy, an innovative project developed at the UNC Bootcamp, aims to tackle the challenge of low physical activity among older adults. Our AI-driven solution uses peer interaction to boost and sustain exercise levels, significantly improving health outcomes. This presentation covers our problem statement, the rationale behind Chatty Kathy, synthetic data and persona creation, model performance metrics, a visual demonstration of the project, and potential future developments. Join us for an insightful Q&A session to explore the potential of this groundbreaking project.
Project Team: Jay Requarth, Jana Avery, John Andrews, Dr. Dick Davis II, Nee Buntoum, Nam Yeongjin & Mat Nicholas
2. Background
This is a simple twitter sentiment analysis project I did during my mid semester break.
It takes a topic and number of inputs to analyse and gives you a nice pictorial
representation of the overall sentiment of that topic.
On a daily basis, we are constantly bombarded by facts and figures by advertisement
agencies, governments, people etcetera. How will we get to know whether these facts
makes sense or not. I always desired to know what common people think about any
particular topic which is popular right now. I don’t want to just believe on a particular
figure blindly. Then it struck me why not use my newly acquired knowledge of Python
for this purpose. Hence, I got motivated to do this project. Now, I don’t rely on anyone
telling me how common people feel about a particular topic. I can just open up my
script and within few minutes, I can get real time analysis of twitter data about a certain
topic.
3. Tools Used
Twitter API
Twitter is an Excellent source of data about public opinion. It also contains some
sensitive information. Not anyone can get access to this data. As of 20th October 2018,
one need to fill developers form to get the access of this API.
Python: Specifically, following libraries of the python are used:
Tweepy: To interact with the Twitter API.
TextBlob: To do text and sentiment analysis.
Matplotlib: To plot the results in a Pie char to show the final sentiment.
5. Loading
Libraries and
dependencies
The following libraries need to be loaded before we can actually
query the twitter Application Program Interface (API) and get the
sentiment of the desired input. TextBlob will help us in getting the
sentiment of a particular tweet. The matplotlib is for plotting the
final sentiment. Further, different tweepy sub-modules are loaded
using the python.
6. Making Connection with Twitter
After loading the required packages,
we need to make a connection to
the twitter API. This requires a
developers account on twitter. With
an account , one will get the keys
and passwords to interact with API.
Python’s Package Tweepy facilitate
this process. I hid the keys and
passwords as they are private
information and can be used
inappropriately.
7. Getting Twitter Data From the API
The API that we created in the
previous slide can be used to
access many different types of
data. It can be used to access
a particular users data, live
streaming data or data related
to a particular topic which is
the main focus of this project.
8. Use Of TextBlob to get the Sentiment
The previous script will search for
‘searchTerm’ to get ‘noOfSearch’
tweets. To analyse these tweets, we
can use the TextBlob’s
sentiment.polarity attribute. After
iterating over the tweet object, we
can store the sentiments in various
arrays. To get the pictorial
representation, obtained the
percentage.
9. Rendering Pie Plot for overall Sentiment
Now, using the rates(positive, negative and neutral) , we can render the pie plot which gives an idea about
overall sentiment about ‘searchTerm’.
10. We are done with the script. Now, after executing the
script, it will prompt us for two inputs. The first will be
the term that we want to get the sentiment of and the
next will be ‘How many tweets we want to analyse?’.
Now, lets run the scripts for few times and analyse the
sentiment about some common topics.
16. Reason For the strange result
In the previous slide, it seems like a lot of people are neutral about Rahul Gandhi
which is actually the case as many people use sarcasm for Rahul Gandhi. The TextBlob
is not good at detecting sarcasm and humour. It can only detect the positive and
negative sentiment using some of the keywords which are a strong indicator of either
of the sentiment. If it does not find any positive or negative phrase in the tweet, it
gives a 0 polarity score which mean no sentiment at all.
Results on Modi is quite alarming for the ruling party as almost 1/3rd of the tweets are
negative. Considering the image of PM, this results is rather alarming.
18. Demonetization: Again, there are
large percentage of tweets as
neutral which can also be a sarcasm
or humor against the government’s
move. There were many who were
actually neutral about this move.
Considering the tweet “It is good
move but needs a robust
infrastructure”. This statement is
obviously neutral. The high
percentage indicate that there are
large number of people who aren’t
quite sure about the move.
19. The main motive behind this was to create a tool which can
work for us and tell us what is the general sentiment of people
on twitter about a certain topic. In twitter, most of the things
work as a particular keyword. Such as #metoo, #narendramodi,
#raga etcetera. Hence, keywords can tell us hidden stories.
I intend to create a more advanced version of this in future such
as getting live sentiment analysis for which advanced machine
capabilities are required.
This finishes the project.