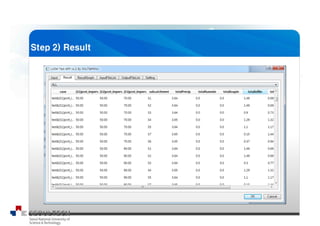
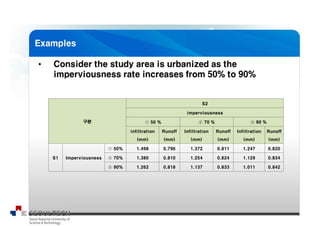
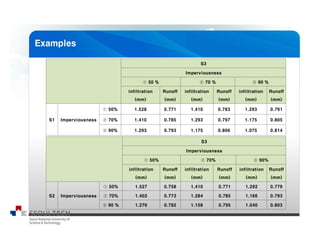
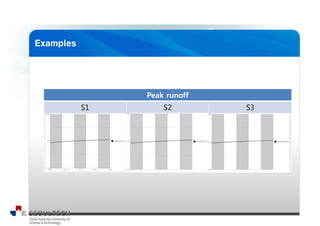
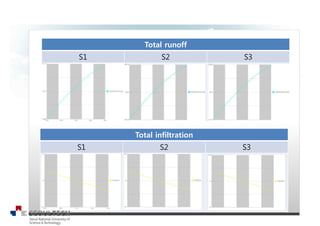
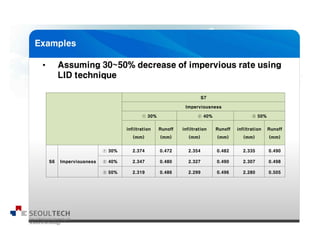
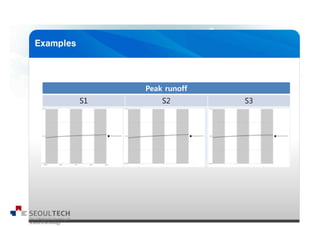
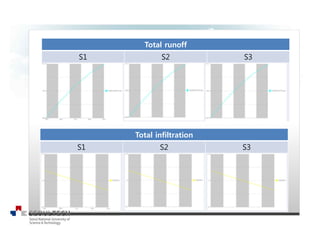
The document contains data on infiltration and runoff for 3 sites (S1, S2, S3) with varying percentages of impervious surface (1=50%, 2=70%, 3=90%). It shows infiltration decreasing and runoff increasing with higher imperviousness for each site. Total values are given for peak runoff, total runoff, and total infiltration for the 3 sites. Similar data is shown for another 3 sites (S6, S7, S8) with lower imperviousness ranges (1=30%, 2=40%, 3=50%).