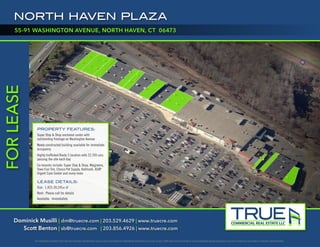
The information contained in this document has been collected from various sources and should be independently verified for its accuracy. As such, TRUE shall not be held liable for any consequential damage arising out of any use or reliance on any content or materials contained herein.
Dominick Musilli | dm@truecre.com | 203.529.4629 | www.truecre.com
Scott Benton | sb@truecre.com | 203.856.4926 | www.truecre.com
	
PROPERTY FEATURES:
Super Stop & Shop anchored center with
outstanding frontage on Washington Avenue
Newly constructed building available for immediate
occupancy
Highly trafficked Route 5 location with 22,700 cars
passing the site each day
Co-tenants include: Super Stop & Shop, Walgreens,
Town Fair Tire, Choice Pet Supply, Hallmark, ASAP
Urgent Care Center and many more
LEASE DETAILS:
Size: 1,423-20,245± sf
Rent: Please call for details
Available: Immediately
55-91 WASHINGTON AVENUE, NORTH HAVEN, CT 06473
NORTH HAVEN PLAZAFORLEASE
CricketGifts
11,093±SF
ASAPUrgent
CareCenters
1,423±SF
3,865±SF
4,652±SF
6,676±SF
HibachiGrill
&SupremeBuffet
PetSupply
6,708±SF
RetroFitness
4,317±SF
4,303±SF
9,672±SF
Vacant
8,142±SF
NORTH HAVEN PLAZA
55-91 WASHINGTON AVENUE, NORTH HAVEN, CT 06473
SITEPLAN
NORTH HAVEN PLAZA
55-91 WASHINGTON AVENUE, NORTH HAVEN, CT 06473
AREA DEMOGRAPHIC 1 MILE 3 MILE 5 MILE
POPULATION:
2016 Projection 4,234 40,929 112,904
2011 Estimate 4,130 40,012 111,535
2010 Census 4,096 39,834 111,440
Growth 2011-2016 2.50% 2.30% 1.20%
Growth 2010-2011 0.80% 0.40% 0.10%
2011 Population By Hispanic Origin 160 1,788 9,153
2010 POPULATION BY RACE:
White 3,695 35,026 91,150
Black or African American 130 1,822 9,614
American Indian and Alaska Native 11 38 172
Asian 196 2,105 5,340
Native Hawaiian and Pacific Islander 4 10 22
Other Race 33 390 3,091
Two or More Races 62 620 2,147
2010 HOUSEHOLDS:
2016 Projection 1,656 15,295 44,601
2011 Estimate 1,609 14,875 44,024
2010 Census 1,595 14,814 44,020
Growth 2011-2016 2.90% 2.80% 1.30%
Growth 2010-2011 0.90% 0.40% 0.00%
Owner Occupied 1,251 11,042 30,947
Renter Occupied 358 3,833 13,077
2011 Avg Household Income $85,929 $91,659 $86,712
2011 Med Household Income $70,068 $76,095 $67,901
2011 Per Capita Income $33,720 $36,927 $35,401
2010 HOUSEHOLDS BY HOUSEHOLD INC:
Income Less than $15,000 114 1,066 3,505
Income $15,000 - $24,999 103 1,000 3,401
Income $25,000 - $34,999 108 832 3,233
Income $35,000 - $49,999 199 1,812 5,474
Income $50,000 - $74,999 327 2,575 8,150
Income $75,000 - $99,999 264 2,530 6,710
Income $100,000 - $149,999 301 2,965 7,973
Income $150,000 - $199,999 126 1,222 3,084
Income $200,000+ 66 875 2,493
DAYTIME POPULATION 1 MILE 3 MILE 5 MILE 1 MILE 3 MILE 5 MILE
# BUSINESSES # EMPLOYEES
Total Businesses 432 2,132 4,515 3,957 22,497 48,205
Total Retail 87 413 935 889 4,121 9,052
Home Improvement Stores 6 28 58 24 365 721
General Merchandise Stores 3 11 28 39 298 1,062
Food Stores 7 32 89 352 655 1,663
Auto Dealers & Service Stations 13 52 105 73 863 1,303
Apparel & Accessory Stores 6 30 65 20 101 412
Home Furniture & Furnishings 7 36 96 20 103 317
Eating & Drinking Places 24 113 260 270 1,235 2,497
Miscellaneous Retail 21 111 234 91 501 1,077
Financial/Insurance/Real Estate 51 257 444 333 2,807 3,762
Banks, Saving & Lending Institutions 13 39 77 102 304 511
Securities Brokers and Investments 8 48 67 42 278 311
Insurance Carriers & Agencies 12 73 130 64 1,584 1,849
Real Estate/Trust/Holding Companies 18 97 170 125 641 1,091
Services 189 899 1,922 1,379 8,101 19,010
Hotels & Lodging 1 5 8 137 228 238
Motion Picture & Amusement 14 54 135 60 264 855
Health Services 27 155 250 269 1,820 4,193
Legal Services 13 64 94 34 266 385
Education Services 6 43 117 146 1,847 4,556
Auto Services 11 40 134 34 166 581
Other Services 117 538 1,184 699 3,510 8,202
Agriculture/Mining 6 48 106 11 190 404
Construction 38 187 414 147 1,146 2,761
Manufacturing 18 103 210 644 3,025 7,306
Transp/Commun/Pub Util 12 64 147 20 777 1,938
Wholesale Trade 19 113 236 476 1,648 2,789
Government 12 48 101 58 682 1,183
DEMOGRAPHICS

TRUE_NorthHavenCT_PlazaFinal

  • 1.
    The information containedin this document has been collected from various sources and should be independently verified for its accuracy. As such, TRUE shall not be held liable for any consequential damage arising out of any use or reliance on any content or materials contained herein. Dominick Musilli | dm@truecre.com | 203.529.4629 | www.truecre.com Scott Benton | sb@truecre.com | 203.856.4926 | www.truecre.com PROPERTY FEATURES: Super Stop & Shop anchored center with outstanding frontage on Washington Avenue Newly constructed building available for immediate occupancy Highly trafficked Route 5 location with 22,700 cars passing the site each day Co-tenants include: Super Stop & Shop, Walgreens, Town Fair Tire, Choice Pet Supply, Hallmark, ASAP Urgent Care Center and many more LEASE DETAILS: Size: 1,423-20,245± sf Rent: Please call for details Available: Immediately 55-91 WASHINGTON AVENUE, NORTH HAVEN, CT 06473 NORTH HAVEN PLAZAFORLEASE
  • 2.
  • 3.
    NORTH HAVEN PLAZA 55-91WASHINGTON AVENUE, NORTH HAVEN, CT 06473 AREA DEMOGRAPHIC 1 MILE 3 MILE 5 MILE POPULATION: 2016 Projection 4,234 40,929 112,904 2011 Estimate 4,130 40,012 111,535 2010 Census 4,096 39,834 111,440 Growth 2011-2016 2.50% 2.30% 1.20% Growth 2010-2011 0.80% 0.40% 0.10% 2011 Population By Hispanic Origin 160 1,788 9,153 2010 POPULATION BY RACE: White 3,695 35,026 91,150 Black or African American 130 1,822 9,614 American Indian and Alaska Native 11 38 172 Asian 196 2,105 5,340 Native Hawaiian and Pacific Islander 4 10 22 Other Race 33 390 3,091 Two or More Races 62 620 2,147 2010 HOUSEHOLDS: 2016 Projection 1,656 15,295 44,601 2011 Estimate 1,609 14,875 44,024 2010 Census 1,595 14,814 44,020 Growth 2011-2016 2.90% 2.80% 1.30% Growth 2010-2011 0.90% 0.40% 0.00% Owner Occupied 1,251 11,042 30,947 Renter Occupied 358 3,833 13,077 2011 Avg Household Income $85,929 $91,659 $86,712 2011 Med Household Income $70,068 $76,095 $67,901 2011 Per Capita Income $33,720 $36,927 $35,401 2010 HOUSEHOLDS BY HOUSEHOLD INC: Income Less than $15,000 114 1,066 3,505 Income $15,000 - $24,999 103 1,000 3,401 Income $25,000 - $34,999 108 832 3,233 Income $35,000 - $49,999 199 1,812 5,474 Income $50,000 - $74,999 327 2,575 8,150 Income $75,000 - $99,999 264 2,530 6,710 Income $100,000 - $149,999 301 2,965 7,973 Income $150,000 - $199,999 126 1,222 3,084 Income $200,000+ 66 875 2,493 DAYTIME POPULATION 1 MILE 3 MILE 5 MILE 1 MILE 3 MILE 5 MILE # BUSINESSES # EMPLOYEES Total Businesses 432 2,132 4,515 3,957 22,497 48,205 Total Retail 87 413 935 889 4,121 9,052 Home Improvement Stores 6 28 58 24 365 721 General Merchandise Stores 3 11 28 39 298 1,062 Food Stores 7 32 89 352 655 1,663 Auto Dealers & Service Stations 13 52 105 73 863 1,303 Apparel & Accessory Stores 6 30 65 20 101 412 Home Furniture & Furnishings 7 36 96 20 103 317 Eating & Drinking Places 24 113 260 270 1,235 2,497 Miscellaneous Retail 21 111 234 91 501 1,077 Financial/Insurance/Real Estate 51 257 444 333 2,807 3,762 Banks, Saving & Lending Institutions 13 39 77 102 304 511 Securities Brokers and Investments 8 48 67 42 278 311 Insurance Carriers & Agencies 12 73 130 64 1,584 1,849 Real Estate/Trust/Holding Companies 18 97 170 125 641 1,091 Services 189 899 1,922 1,379 8,101 19,010 Hotels & Lodging 1 5 8 137 228 238 Motion Picture & Amusement 14 54 135 60 264 855 Health Services 27 155 250 269 1,820 4,193 Legal Services 13 64 94 34 266 385 Education Services 6 43 117 146 1,847 4,556 Auto Services 11 40 134 34 166 581 Other Services 117 538 1,184 699 3,510 8,202 Agriculture/Mining 6 48 106 11 190 404 Construction 38 187 414 147 1,146 2,761 Manufacturing 18 103 210 644 3,025 7,306 Transp/Commun/Pub Util 12 64 147 20 777 1,938 Wholesale Trade 19 113 236 476 1,648 2,789 Government 12 48 101 58 682 1,183 DEMOGRAPHICS