Toward a predictive fundraising model
•Download as PPTX, PDF•
1 like•470 views

This document summarizes research presented at the 2015 Nonprofit Technology Conference on developing a predictive model for fundraising. The research involved surveying 900 advocacy nonprofits about their 2013 fundraising practices and matching responses with IRS data. Key findings included that certain practices like giving clubs, matching campaigns, and consistent conditional asks were associated with higher revenue. Experience of the development director also correlated with increased fundraising, whereas board participation and executive tenure did not. Limitations of the research were noted and next steps proposed further analyzing correlations and sharing findings.

Recommended
Recommended
More Related Content
What's hot
What's hot (8)
Viewers also liked
Viewers also liked (20)
Similar to Toward a predictive fundraising model
Similar to Toward a predictive fundraising model (20)
Recently uploaded
Recently uploaded (20)
Toward a predictive fundraising model
- 1. TOWARD A PREDICTIVE MODEL FOR FUNDRAISING #15NTCPREDICTIVE Mary Dillon Kerwin President, Blue Strike NTen Nonprofit Technology Conference Austin #15NTC March 6, 2015
- 2. Introduction Friday March 6, 2015 1:30pm - 3:00pm Twitter Hashtag: #15NTCpredictive CFRE Credits: Approved - 1.5 Collaboration Notes: http://po.st/tHUJMN Tags Advocacy, Data, Strategy
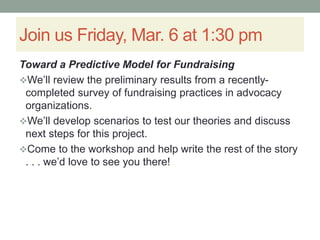
- 3. This session ❖ Launch the next phase of research into a fundraising tool that will help development directors set goals, manage time, and deploy resources. ❖ Look at preliminary findings and ask for your reactions, comments, and questions regarding the research. ❖ Recommendations for phase II.
- 4. Session intended audience Fundraisers/Managers Interactive session Collaboration Notes: http://po.st/tHUJMN Volunteer scribes? Download/view slides-NTEN Connect Library or bluestrike.org/resources
- 5. Slides-Connect/Discussions Enter “Toward a predictive model” in the search box
- 6. Agenda How we got started What we found (so far) Take the survey A look at the study’s limitations Real life scenarios Where we go next
- 7. BACKGROUND Project Development Saturday, March 7, 2015 #15NTCpredictive
- 8. It started with . . . . . . a question from the audience “Can you tell me which strategy will yield the best results?” Why is this question so hard to answer? Saturday, March 7, 2015 #15NTCpredictive
- 9. Tools that help us predict • We have retirement calculators, we have mortgage calculators, we even have workout calculators . . . Saturday, March 7, 2015 #15NTCpredictive
- 10. How about one for development? Your organization’s revenue mix, number of donors Your staff size and level of experience Your volunteer profiles, willingness to help Saturday, March 7, 2015 #15NTCpredictive
- 11. If not data science, then what? Saturday, March 7, 2015 #15NTCpredictive
- 12. Hypothetical #1 If your organization is less than 10 years old, and you have fewer than 500 donors, and you have a part-time development director, then you are likely to find success . . . 1. Starting a sustainer program 2. Relying on board participation 3. Focusing on a combination of web-based giving strategies
- 13. Hypothetical #2 If your organization is going through an executive director transition, and you have approximately 2,500 donors, and you raised $2 million last year, you are likely to find success . . . 1. Starting a giving club for major donors 2. Hiring additional fundraising staff 3. Focusing on cultivation of high net worth individuals
- 14. Enlisting help for the project ❖ Conference calls with nonprofits, discussions with businesses and consultants ❖ Faculty advisor for independent study ❖ Data collection ❖ Analysis -- here we are at NTC! Saturday, March 7, 2015 #15NTCpredictive
- 15. Different perspectives/perceptions Saturday, March 7, 2015 #15NTCpredictive
- 16. Questions to think about As we go through the research, here are a few questions to consider: Have you seen similar, supporting or contradictory research? How might you use the findings? What other correlations or causes should we look for? Saturday, March 7, 2015 #15NTCpredictive
- 17. RESEARCH Descriptives and Group Differences Saturday, March 7, 2015 #15NTCpredictive
- 18. Research design ❖ Focused on organizations engaged in advocacy, public policy, civic engagement, and public interest law ❖ 900 organizations selected at random received an online survey from Jan. 20 to Feb. 17, 2015 ❖ Questionnaire asked about 2013 fundraising practices ❖ Responses were matched with IRS administrative records (FY2013) to create the datafile. Saturday, March 7, 2015 #15NTCpredictive
- 19. About the sample 175 responses 162 completed surveys 44 states and 14 different categories Saturday, March 7, 2015 #15NTCpredictive
- 20. Figure 2.1 Nonprofit Category 4 4 5 6 8 12 20 21 24 30 41 Education Community Improvement Animal Related Intl, Foreigh Afrs, Natl Sec Public Society Other (Arts, Housing, Food) Enviro Educ/Outdoor Crime and Legal Related Environment Civil Rights Enviro Conservation Survey responses by nonprofit category Saturday, March 7, 2015 #15NTCpredictive
- 21. Individual giving and revenue ❖ Most organizations (77%) have fewer than 1,000 donors ❖ Most (60%) have fewer than 5,000 names on their email files ❖ Only 17% count on individual donors to make up 50% or more of their revenue ❖ Average revenue is $2 million Saturday, March 7, 2015 #15NTCpredictive
- 22. Staff and volunteers ❖ Two-thirds of the organizations have staff dedicated to development ❖ 38% have executive directors with less than five years tenure; while one-third have tenure of 10 years or more ❖ Board participation is present, but modest Saturday, March 7, 2015 #15NTCpredictive
- 23. SURVEY Nonprofit Fundraising Practices Questionnaire Saturday, March 7, 2015 #15NTCpredictive
- 24. Figure 3.1 Fundraising Practices 22% recognition and fundraising 20% heavy/moderate emphasis 20% all/most 24% heavy/moderate emphasis 30% mobil compatible 45% three times or more 42% 47% 51% 54% 85% 89% Giving clubs Matching campaigns Conditional ask string Sustainer program Donate button on website Second gift ask Saturday, March 7, 2015 #15NTCpredictive
- 25. Figure 3.2 Giving Clubs $1,748,474 $1,940,761 $2,697,044 $0 $500,000 $1,000,000 $1,500,000 $2,000,000 $2,500,000 $3,000,000 $3,500,000 $4,000,000 No Giving Club Recognition Only Recognition and Fundraising Giving clubs with a fundraising component are associated with higher revenue Saturday, March 7, 2015 #15NTCpredictive
- 26. Figure 3.3 Matching Campaigns $1,778,860 $1,848,724 $2,655,744 $3,246,755 $0 $500,000 $1,000,000 $1,500,000 $2,000,000 $2,500,000 $3,000,000 $3,500,000 $4,000,000 No Matching Campaigns Low emphasis Moderate Emphasis Heavy Emphasis Matching campaigns are associated with higher revenue Saturday, March 7, 2015 #15NTCpredictive
- 27. Figure 3.4 Conditional Ask String $1,543,682 $2,768,055 $1,841,081 $1,683,012 $4,964,755 $0 $1,000,000 $2,000,000 $3,000,000 $4,000,000 $5,000,000 Did not use Used in few Used in some Used in most Used always Consistent use of conditional ask strings yields best results Saturday, March 7, 2015 #15NTCpredictive
- 28. Figure 3.5 Sustainer Program $1,789,965 $2,726,310 $0.00 $500,000.00 $1,000,000.00 $1,500,000.00 $2,000,000.00 $2,500,000.00 $3,000,000.00 $3,500,000.00 $4,000,000.00 Low emphasis/no program Moderate and heavy emphasis Sustainer campaigns see higher revenue Saturday, March 7, 2015 #15NTCpredictive
- 29. Figure 3.6 Second Gift Ask $1,659,148 $1,836,170 $2,697,201 $1,654,427 $2,217,072 $0 $500,000 $1,000,000 $1,500,000 $2,000,000 $2,500,000 $3,000,000 $3,500,000 $4,000,000 Did not solicit Solicited once Some once, others more Solicited all 2 to 3 times Solicited all 4 times or more Asking more than once a year helps when it’s targeted Saturday, March 7, 2015 #15NTCpredictive
- 30. Figure 3.1 Fundraising Practices 22% recognition and fundraising 20% heavy/moderate emphasis 20% all/most 24% heavy/moderate emphasis 30% mobil compatible 45% three times or more 42% 47% 51% 54% 85% 89% Giving clubs Matching campaigns Conditional ask string Sustainer program Donate button on website Second gift ask Saturday, March 7, 2015 #15NTCpredictive
- 31. Figure 4.1 Development Directors $1,537,686 $1,297,823 $2,170,352 $3,066,418 $3,213,659 $0 $500,000 $1,000,000 $1,500,000 $2,000,000 $2,500,000 $3,000,000 $3,500,000 $4,000,000 No DevDir Less than 5 yrs 5 to 9 yrs 10 to 14 yrs 15 plus yrs Experienced development directors see higher revenue Saturday, March 7, 2015 #15NTCpredictive
- 32. Figure 4.2 Board Participation $1,829,662 $1,973,2673 $2,109,688 $2,506,708 $0 $500,000 $1,000,000 $1,500,000 $2,000,000 $2,500,000 $3,000,000 $3,500,000 $4,000,000 Low Low to moderate Moderate to high High Board participation has little to no impact Saturday, March 7, 2015 #15NTCpredictive
- 33. Figure 4.3 Executive Director Tenure $1,873,090 $1,945,450 $2,105,967 $2,242,143 $0 $500,000 $1,000,000 $1,500,000 $2,000,000 $2,500,000 $3,000,000 $3,500,000 $4,000,000 Less than 5 yrs 5 to 9 yrs 10 to 14 yrs 15 plus yrs Executive Director tenure has little to no impact Saturday, March 7, 2015 #15NTCpredictive
- 34. Figure 4.4 Comparison $0 $500,000 $1,000,000 $1,500,000 $2,000,000 $2,500,000 $3,000,000 $3,500,000 $4,000,000 DD & ED<5yr, BD Low DD & ED 5-10yr, BD L/M DD & ED 10-15yr, BD M/H DD & ED 15yr+, BD H An increase in development director experience has the greatest impact Board participation Executive director tenure Development director yrs experience Saturday, March 7, 2015 #15NTCpredictive
- 35. Other variables Age of organization* Category Number of donors/email file* Assets to revenue ratio Revenue mix * Indication of possible statistical significance Saturday, March 7, 2015 #15NTCpredictive
- 36. LIMITATIONS Considerations in using the research Saturday, March 7, 2015 #15NTCpredictive
- 37. Limitations ❖ Not generalizable to all nonprofits ❖ Does not measure all practices ❖ Revenue is an imperfect dependent variable ❖ Survey focused on 2013 - risk of memory decay ❖ Ranges are difficult to use in regression ❖ Low response rate may result in non-response bias Saturday, March 7, 2015 #15NTCpredictive
- 38. DISCUSSION Real Life Scenarios Saturday, March 7, 2015 #15NTCpredictive
- 39. Discussion questions Have you seen similar, supporting or contradictory research? How might you use the findings? What other correlations or causes should we look for? Saturday, March 7, 2015 #15NTCpredictive
- 40. NEXT STEPS Phase II of research, sharing findings through webinars Saturday, March 7, 2015 #15NTCpredictive
- 41. Additional testing Looking for correlations Segmenting by age, category, income Controlling for media and unusual gifts Saturday, March 7, 2015 #15NTCpredictive
- 42. Sharing research findings Email to all survey respondents Webinars with state nonprofit associations Brown bag lunch with Association of Fundraising Professionals Final report – May 2015 Saturday, March 7, 2015 #15NTCpredictive
- 43. Wrap up Evaluation Survey: http://po.st/FldqRm Collaboration notes: http://po.st/tHUJMN Saturday, March 7, 2015 #15NTCpredictive
Editor's Notes
- About me