The Timken Company reported third quarter results with the following highlights:
- Sales increased slightly year-over-year to $1.27 billion due to strong industrial markets offsetting declines in the automotive sector.
- Net income increased to $46.5 million compared to $39.8 million in the prior year period. Excluding special items, earnings per share were $0.57.
- Industrial markets continued to drive demand while the automotive sector faced significant volume reductions in North America, posing challenges. Actions are underway to adapt to the decline in automotive demand.
REQUIRED Compose your answers in Standard English.Answer al.docxdebishakespeare
REQUIRED:
Compose your answers in Standard English.
Answer all parts of each question separately.
Label each of your responses accordingly.
Provide and label the elements of any supporting calculations. Exams that contain references to materials or information that is not contained in the case will receive a grade of zero!
BE SPECIFIC!NEW YORK--(BUSINESS WIRE)—01/09/2008Alcoa (NYSE: AA) today announced it achieved record results in revenues, income from continuing operations and cash from operations for the full year 2007. Revenues for 2007 were $30.7 billion, compared to $30.4 billion in 2006. Annual income from continuing operations rose to $2.6 billion, or $2.95 per diluted share, for 2007, a 19 percent increase compared to $2.2 billion, or $2.47, in 2006. And, cash from operations for 2007 increased 21 percent to more than $3.1 billion from $2.6 billion in 2006.
“For the second year in a row, Alcoa has achieved company all-time records in revenues, income from continuing operations and cash generation,” said Alain Belda, Alcoa Chairman and CEO. “We battled substantially higher material input and energy costs, and currency impacts while simultaneously continuing to execute on the largest capital investment program in our history.
“We have invested in new plants, expanded production at others, modernized operations, renegotiated long-term power agreements, and built new energy facilities to extend our energy access at competitive rates, while also continuing to invest in growth markets such as Brazil, China and Russia,” Belda said.
"These actions, combined with portfolio and cash flow management, our share repurchase program, conservative leverage, and our commitment to sustainability delivered results now, and will continue to generate quality profitable growth for decades,” added Belda. “In 2007, Alcoans delivered yet again. This is what builds a stronger Company for our stakeholders.”
Fourth quarter income from continuing operations was $624 million, or $0.74. Included in the results are a favorable restructuring adjustment and a tax benefit totaling $323 million or $0.38 per share, almost all of which stems from the recent agreement to sell the packaging and consumer businesses. Income from continuing operations in the 2006 fourth quarter was $258 million, or $0.29, and $558 million, or $0.64, in the third quarter 2007.
Net income for the fourth quarter 2007 was $632 million, or $0.75, which includes the restructuring adjustment and the benefit from the agreement to sell the packaging and consumer business. Net income for the fourth quarter 2006 was $359 million, or $0.41, and $555 million, or $0.63, in the 2007 third quarter.
Revenues for the 2007 fourth quarter were $7.4 billion, compared to $7.8 billion a year ago as a result of lower LME prices and the exclusion of results from the soft alloy extrusion business which is now part of a joint venture. The soft alloy extrusion business had revenues of approximately $560 mil ...
NEW YORK--(BUSINESS WIRE)—01092008Alcoa (NYSE AA) today announc.docxhenrymartin15260
NEW YORK--(BUSINESS WIRE)—01/09/2008
Alcoa (NYSE: AA) today announced it achieved record results in revenues, income from continuing operations and cash from operations for the full year 2007. Revenues for 2007 were $30.7 billion, compared to $30.4 billion in 2006. Annual income from continuing operations rose to $2.6 billion, or $2.95 per diluted share, for 2007, a 19 percent increase compared to $2.2 billion, or $2.47, in 2006. And, cash from operations for 2007 increased 21 percent to more than $3.1 billion from $2.6 billion in 2006.
“For the second year in a row, Alcoa has achieved company all-time records in revenues, income from continuing operations and cash generation,” said Alain Belda, Alcoa Chairman and CEO. “We battled substantially higher material input and energy costs, and currency impacts while simultaneously continuing to execute on the largest capital investment program in our history.
“We have invested in new plants, expanded production at others, modernized operations, renegotiated long-term power agreements, and built new energy facilities to extend our energy access at competitive rates, while also continuing to invest in growth markets such as Brazil, China and Russia,” Belda said.
"These actions, combined with portfolio and cash flow management, our share repurchase program, conservative leverage, and our commitment to sustainability delivered results now, and will continue to generate quality profitable growth for decades,” added Belda. “In 2007, Alcoans delivered yet again. This is what builds a stronger Company for our stakeholders.”
Fourth quarter income from continuing operations was $624 million, or $0.74. Included in the results are a favorable restructuring adjustment and a tax benefit totaling $323 million or $0.38 per share, almost all of which stems from the recent agreement to sell the packaging and consumer businesses. Income from continuing operations in the 2006 fourth quarter was $258 million, or $0.29, and $558 million, or $0.64, in the third quarter 2007.
Net income for the fourth quarter 2007 was $632 million, or $0.75, which includes the restructuring adjustment and the benefit from the agreement to sell the packaging and consumer business. Net income for the fourth quarter 2006 was $359 million, or $0.41, and $555 million, or $0.63, in the 2007 third quarter.
Revenues for the 2007 fourth quarter were $7.4 billion, compared to $7.8 billion a year ago as a result of lower LME prices and the exclusion of results from the soft alloy extrusion business which is now part of a joint venture. The soft alloy extrusion business had revenues of approximately $560 million in the fourth quarter of 2006.
LME = LONDON METAL EXCHANGE. Prices for aluminum, copper and nickel, unlike steel, are set by contracts traded on commodity exchanges such as the London Metal Exchange and the New York Mercantile Exchange.
Cash Generation, ROC, and Growth
Cash from operations in the fourth quarter 2007 was $643 million, .
NEW YORK--(BUSINESS WIRE)—01092008Alcoa (NYSE AA) t.docxabhi353063
NEW YORK--(
BUSINESS WIRE
)—01/09/2008
Alcoa
(NYSE: AA)
today announced it achieved record results in revenues, income from continuing operations and cash from operations for the full year 2007. Revenues for 2007 were $30.7 billion, compared to $30.4 billion in 2006. Annual income from continuing operations rose to $2.6 billion, or $2.95 per diluted share, for 2007, a 19 percent increase compared to $2.2 billion, or $2.47, in 2006. And, cash from operations for 2007 increased 21 percent to more than $3.1 billion from $2.6 billion in 2006.
“For the second year in a row, Alcoa has achieved company all-time records in revenues, income from continuing operations and cash generation,” said Alain Belda, Alcoa Chairman and CEO. “We battled substantially higher material input and energy costs, and currency impacts while simultaneously continuing to execute on the largest capital investment program in our history.
“We have invested in new plants, expanded production at others, modernized operations, renegotiated long-term power agreements, and built new energy facilities to extend our energy access at competitive rates, while also continuing to invest in growth markets such as Brazil, China and Russia,” Belda said.
"These actions, combined with portfolio and cash flow management, our share repurchase program, conservative leverage, and our commitment to sustainability delivered results now, and will continue to generate quality profitable growth for decades,” added Belda. “In 2007, Alcoans delivered yet again. This is what builds a stronger Company for our stakeholders.”
Fourth quarter income from continuing operations was $624 million, or $0.74. Included in the results are a favorable restructuring adjustment and a tax benefit totaling $323 million or $0.38 per share, almost all of which stems from the recent agreement to sell the packaging and consumer businesses. Income from continuing operations in the 2006 fourth quarter was $258 million, or $0.29, and $558 million, or $0.64, in the third quarter 2007.
Net income for the fourth quarter 2007 was $632 million, or $0.75, which includes the restructuring adjustment and the benefit from the agreement to sell the packaging and consumer business. Net income for the fourth quarter 2006 was $359 million, or $0.41, and $555 million, or $0.63, in the 2007 third quarter.
Revenues for the 2007 fourth quarter were $7.4 billion, compared to $7.8 billion a year ago as a result of lower LME prices and the exclusion of results from the soft alloy extrusion business which is now part of a joint venture. The soft alloy extrusion business had revenues of approximately $560 million in the fourth quarter of 2006.
LME = LONDON METAL EXCHANGE.
Prices for aluminum, copper and nickel, unlike steel, are set by contracts traded on commodity exchanges such as the London Metal Exchange and the New York Mercantile Exchange
.
Cash Generation, ROC, and Growth
Cash from operations in the fourth quarter 200.
Even tho Pi network is not listed on any exchange yet.
Buying/Selling or investing in pi network coins is highly possible through the help of vendors. You can buy from vendors[ buy directly from the pi network miners and resell it]. I will leave the telegram contact of my personal vendor.
@Pi_vendor_247
how to sell pi coins in South Korea profitably.DOT TECH
Yes. You can sell your pi network coins in South Korea or any other country, by finding a verified pi merchant
What is a verified pi merchant?
Since pi network is not launched yet on any exchange, the only way you can sell pi coins is by selling to a verified pi merchant, and this is because pi network is not launched yet on any exchange and no pre-sale or ico offerings Is done on pi.
Since there is no pre-sale, the only way exchanges can get pi is by buying from miners. So a pi merchant facilitates these transactions by acting as a bridge for both transactions.
How can i find a pi vendor/merchant?
Well for those who haven't traded with a pi merchant or who don't already have one. I will leave the telegram id of my personal pi merchant who i trade pi with.
Tele gram: @Pi_vendor_247
#pi #sell #nigeria #pinetwork #picoins #sellpi #Nigerian #tradepi #pinetworkcoins #sellmypi
The Evolution of Non-Banking Financial Companies (NBFCs) in India: Challenges...beulahfernandes8
Role in Financial System
NBFCs are critical in bridging the financial inclusion gap.
They provide specialized financial services that cater to segments often neglected by traditional banks.
Economic Impact
NBFCs contribute significantly to India's GDP.
They support sectors like micro, small, and medium enterprises (MSMEs), housing finance, and personal loans.
BYD SWOT Analysis and In-Depth Insights 2024.pptxmikemetalprod
Indepth analysis of the BYD 2024
BYD (Build Your Dreams) is a Chinese automaker and battery manufacturer that has snowballed over the past two decades to become a significant player in electric vehicles and global clean energy technology.
This SWOT analysis examines BYD's strengths, weaknesses, opportunities, and threats as it competes in the fast-changing automotive and energy storage industries.
Founded in 1995 and headquartered in Shenzhen, BYD started as a battery company before expanding into automobiles in the early 2000s.
Initially manufacturing gasoline-powered vehicles, BYD focused on plug-in hybrid and fully electric vehicles, leveraging its expertise in battery technology.
Today, BYD is the world’s largest electric vehicle manufacturer, delivering over 1.2 million electric cars globally. The company also produces electric buses, trucks, forklifts, and rail transit.
On the energy side, BYD is a major supplier of rechargeable batteries for cell phones, laptops, electric vehicles, and energy storage systems.
how to swap pi coins to foreign currency withdrawable.DOT TECH
As of my last update, Pi is still in the testing phase and is not tradable on any exchanges.
However, Pi Network has announced plans to launch its Testnet and Mainnet in the future, which may include listing Pi on exchanges.
The current method for selling pi coins involves exchanging them with a pi vendor who purchases pi coins for investment reasons.
If you want to sell your pi coins, reach out to a pi vendor and sell them to anyone looking to sell pi coins from any country around the globe.
Below is the contact information for my personal pi vendor.
Telegram: @Pi_vendor_247
Exploring Abhay Bhutada’s Views After Poonawalla Fincorp’s Collaboration With...beulahfernandes8
The financial landscape in India has witnessed a significant development with the recent collaboration between Poonawalla Fincorp and IndusInd Bank.
The launch of the co-branded credit card, the IndusInd Bank Poonawalla Fincorp eLITE RuPay Platinum Credit Card, marks a major milestone for both entities.
This strategic move aims to redefine and elevate the banking experience for customers.
when will pi network coin be available on crypto exchange.DOT TECH
There is no set date for when Pi coins will enter the market.
However, the developers are working hard to get them released as soon as possible.
Once they are available, users will be able to exchange other cryptocurrencies for Pi coins on designated exchanges.
But for now the only way to sell your pi coins is through verified pi vendor.
Here is the telegram contact of my personal pi vendor
@Pi_vendor_247
how can i use my minded pi coins I need some funds.DOT TECH
If you are interested in selling your pi coins, i have a verified pi merchant, who buys pi coins and resell them to exchanges looking forward to hold till mainnet launch.
Because the core team has announced that pi network will not be doing any pre-sale. The only way exchanges like huobi, bitmart and hotbit can get pi is by buying from miners.
Now a merchant stands in between these exchanges and the miners. As a link to make transactions smooth. Because right now in the enclosed mainnet you can't sell pi coins your self. You need the help of a merchant,
i will leave the telegram contact of my personal pi merchant below. 👇 I and my friends has traded more than 3000pi coins with him successfully.
@Pi_vendor_247
What website can I sell pi coins securely.DOT TECH
Currently there are no website or exchange that allow buying or selling of pi coins..
But you can still easily sell pi coins, by reselling it to exchanges/crypto whales interested in holding thousands of pi coins before the mainnet launch.
Who is a pi merchant?
A pi merchant is someone who buys pi coins from miners and resell to these crypto whales and holders of pi..
This is because pi network is not doing any pre-sale. The only way exchanges can get pi is by buying from miners and pi merchants stands in between the miners and the exchanges.
How can I sell my pi coins?
Selling pi coins is really easy, but first you need to migrate to mainnet wallet before you can do that. I will leave the telegram contact of my personal pi merchant to trade with.
Tele-gram.
@Pi_vendor_247
where can I find a legit pi merchant onlineDOT TECH
Yes. This is very easy what you need is a recommendation from someone who has successfully traded pi coins before with a merchant.
Who is a pi merchant?
A pi merchant is someone who buys pi network coins and resell them to Investors looking forward to hold thousands of pi coins before the open mainnet.
I will leave the telegram contact of my personal pi merchant to trade with
@Pi_vendor_247
Turin Startup Ecosystem 2024 - Ricerca sulle Startup e il Sistema dell'Innov...Quotidiano Piemontese
Turin Startup Ecosystem 2024
Una ricerca de il Club degli Investitori, in collaborazione con ToTeM Torino Tech Map e con il supporto della ESCP Business School e di Growth Capital
how to sell pi coins at high rate quickly.DOT TECH
Where can I sell my pi coins at a high rate.
Pi is not launched yet on any exchange. But one can easily sell his or her pi coins to investors who want to hold pi till mainnet launch.
This means crypto whales want to hold pi. And you can get a good rate for selling pi to them. I will leave the telegram contact of my personal pi vendor below.
A vendor is someone who buys from a miner and resell it to a holder or crypto whale.
Here is the telegram contact of my vendor:
@Pi_vendor_247
Empowering the Unbanked: The Vital Role of NBFCs in Promoting Financial Inclu...Vighnesh Shashtri
In India, financial inclusion remains a critical challenge, with a significant portion of the population still unbanked. Non-Banking Financial Companies (NBFCs) have emerged as key players in bridging this gap by providing financial services to those often overlooked by traditional banking institutions. This article delves into how NBFCs are fostering financial inclusion and empowering the unbanked.
how to sell pi coins effectively (from 50 - 100k pi)DOT TECH
Anywhere in the world, including Africa, America, and Europe, you can sell Pi Network Coins online and receive cash through online payment options.
Pi has not yet been launched on any exchange because we are currently using the confined Mainnet. The planned launch date for Pi is June 28, 2026.
Reselling to investors who want to hold until the mainnet launch in 2026 is currently the sole way to sell.
Consequently, right now. All you need to do is select the right pi network provider.
Who is a pi merchant?
An individual who buys coins from miners on the pi network and resells them to investors hoping to hang onto them until the mainnet is launched is known as a pi merchant.
debuts.
I'll provide you the Telegram username
@Pi_vendor_247
how to sell pi coins effectively (from 50 - 100k pi)
timken 2006Q3TimkenEarningsRelease
1. NEWS RELEASE
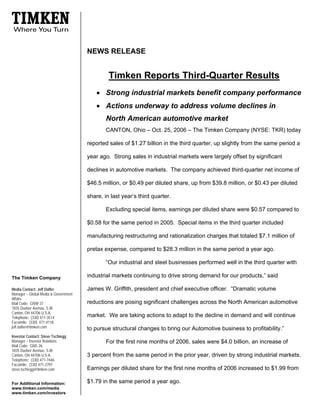
Timken Reports Third-Quarter Results
• Strong industrial markets benefit company performance
• Actions underway to address volume declines in
North American automotive market
CANTON, Ohio – Oct. 25, 2006 – The Timken Company (NYSE: TKR) today
reported sales of $1.27 billion in the third quarter, up slightly from the same period a
year ago. Strong sales in industrial markets were largely offset by significant
declines in automotive markets. The company achieved third-quarter net income of
$46.5 million, or $0.49 per diluted share, up from $39.8 million, or $0.43 per diluted
share, in last year’s third quarter.
Excluding special items, earnings per diluted share were $0.57 compared to
$0.58 for the same period in 2005. Special items in the third quarter included
manufacturing restructuring and rationalization charges that totaled $7.1 million of
pretax expense, compared to $28.3 million in the same period a year ago.
“Our industrial and steel businesses performed well in the third quarter with
industrial markets continuing to drive strong demand for our products,” said
The Timken Company
James W. Griffith, president and chief executive officer. “Dramatic volume
Media Contact: Jeff Dafler
Manager – Global Media & Government
Affairs
reductions are posing significant challenges across the North American automotive
Mail Code: GNW-37
1835 Dueber Avenue, S.W.
Canton, OH 44706 U.S.A.
market. We are taking actions to adapt to the decline in demand and will continue
Telephone: (330) 471-3514
Facsimile: (330) 471-4118
jeff.dafler@timken.com to pursue structural changes to bring our Automotive business to profitability.”
Investor Contact: Steve Tschiegg
Manager – Investor Relations For the first nine months of 2006, sales were $4.0 billion, an increase of
Mail Code: GNE-26
1835 Dueber Avenue, S.W.
3 percent from the same period in the prior year, driven by strong industrial markets.
Canton, OH 44706 U.S.A.
Telephone: (330) 471-7446
Facsimile: (330) 471-2797
Earnings per diluted share for the first nine months of 2006 increased to $1.99 from
steve.tschiegg@timken.com
$1.79 in the same period a year ago.
For Additional Information:
www.timken.com/media
www.timken.com/investors
2. -2- Special items in the first nine months of 2006 totaled $32.9 million of pretax
expense, compared to $33.1 million in the same period a year ago, and included
manufacturing, restructuring and rationalization charges and the impact of asset
dispositions. Excluding special items, earnings per diluted share in the first nine
months of 2006 were $2.19, compared to $1.99 during the same period in 2005,
due to continued strong industrial market demand.
Total debt was $752.8 million as of Sept. 30, 2006, or 30.7 percent of
capital. Net debt at Sept. 30, 2006, was $698.7 million, or 29.2 percent of capital,
compared to $655.6 million, or 30.5 percent of capital, as of Dec. 31, 2005. Year-
to-date, the increase in net debt was primarily due to capital expenditures to support
the company’s growth initiatives, pension contributions and seasonal working
capital requirements. The company anticipates ending the year with lower net debt
and leverage, compared to Dec. 31, 2005.
Industrial Group Results
The Industrial Group had third-quarter sales of $501.8 million, up 7 percent
from $468.2 million for the same period last year. The company continued to
benefit from strong demand across its broad industrial segments, led by increases
in the aerospace, industrial distribution and heavy industry segments.
The Industrial Group’s earnings before interest and taxes (EBIT) in the third
quarter were $48.2 million, compared to $47.4 million for the same period last year.
EBIT performance reflected continued strong volume and pricing, which were offset
primarily by higher manufacturing costs, including those for capacity additions and
increased investments for growth initiatives. Timken continues to make investments
in Asia and key global industrial markets, including construction of the company’s
fifth manufacturing facility in China, opening of a global aerospace facility in Arizona
and introduction of a new line of large-bore seals.
The Timken Company
3. -3- For the first nine months of 2006, Industrial Group sales were $1.5 billion, up
7 percent over the same period a year ago. EBIT for the first nine months of 2006
was $157.6 million, compared to EBIT of $158.1 million over the prior-year period.
Automotive Group Results
The Automotive Group’s third-quarter sales of $363.6 million were
11 percent below the same period a year ago. The decline in sales was the result
of significant reductions in vehicle production by automakers headquartered in
North America, which was partially offset by improved pricing.
The Automotive Group recorded a third-quarter loss of $26.3 million,
compared to a loss of $6.0 million for the same period a year ago. EBIT during the
quarter was negatively impacted by lower volume, leading to underutilization of
manufacturing capacity. In response to the recent drop in demand, Timken
announced in September 2006 the reduction of 700 positions from its Automotive
Group. This action is expected to result in savings of approximately $35 million,
which will be fully realized by the middle of 2007, at a cost of approximately $25
million. This program is in addition to the automotive restructuring plan announced
in July 2005, which has targeted savings of approximately $40 million by the end of
2007. The company anticipates taking additional actions to structurally improve the
performance of this business going forward.
For the first nine months of 2006, Automotive Group sales of $1.2 billion
were 3 percent below the same period last year. The group recorded a loss of
$31.4 million for the first nine months of 2006, compared to a loss of $12.4 million in
the first nine months of 2005.
Steel Group Results
Steel Group third-quarter sales were $442.6 million, a 3 percent increase
from $427.9 million in the same period a year ago. The sales were driven by
increased pricing, surcharges and higher demand in the service center, aerospace
and energy segments, and were negatively impacted by lower automotive demand.
The Timken Company
4. -4- Third-quarter EBIT was $63.0 million, compared to $49.7 million for the
same period last year. The strong results were due to price increases, surcharges,
better sales mix and improved manufacturing productivity.
During the quarter, the Steel Group announced an investment in a new
induction heat-treat line that will increase Timken’s capacity and ability to provide
differentiated products to more customers in important global energy markets. In
addition, the group recently announced its intention to exit its European seamless
steel tube manufacturing operation as part of its strategy to strengthen its business
portfolio.
For the first nine months of 2006, Steel Group sales were $1.4 billion, a
3 percent increase over the first nine months of last year. EBIT for the first nine
months of 2006 was $209.6 million compared to EBIT of $170.2 million in the first
nine months of 2005.
Outlook
Based on third-quarter performance, Timken is estimating 2006 earnings per
diluted share, excluding special items, of $2.65 to $2.75. In 2005, the company
earned $2.53 per diluted share, excluding special items.
Conference Call Information
The company will host a conference call for investors and analysts today to
discuss financial results.
Conference Call: Wednesday, Oct. 25, 2006
11:00 a.m. Eastern Daylight Time
All Callers: Live Dial-In: 800-344-0593 or 706-634-0975
(Call in 10 minutes prior to be included.)
Replay Dial-In through Nov. 1, 2006:
800-642-1687 or 706-645-9291
Conference ID: 5677550 (Valid for live call and
replay)
Live Webcast: www.timken.com/investors
The Timken Company
5. -5-
About The Timken Company
The Timken Company (NYSE: TKR, http://www.timken.com) keeps the
world turning, with innovative ways to make customers’ products run smoother,
faster and more efficiently. Timken’s highly engineered bearings, alloy steels and
related products and services turn up everywhere. With operations in 27 countries,
sales of $5.2 billion in 2005 and 27,000 employees, Timken is Where You Turn™
for better performance.
Certain statements in this news release (including statements regarding the
company’s forecasts, estimates and expectations) that are not historical in nature
are “forward-looking” statements within the meaning of the Private Securities
Litigation Reform Act of 1995. In particular, statements related to expected savings
and costs of the company's programs and initiatives and expectations regarding the
company's financial performance, including the information under the heading
“Outlook,” are forward-looking. The company cautions that actual results may differ
materially from those projected or implied in forward-looking statements due to a
variety of important factors, including: the company’s ability to respond to the
changes in its end markets, especially the North American automotive industry;
fluctuations in raw-material and energy costs and the operation of the company’s
surcharge mechanisms; changes in the financial health of the company’s
customers; and the impact on operations of general economic conditions, higher
raw-material and energy costs, fluctuations in customer demand and the company’s
ability to achieve the benefits of its future and ongoing programs and initiatives,
including, without limitation, the implementation of its Automotive Group
restructuring program and initiatives and the rationalization of the company's
Canton bearing operations. These and additional factors are described in greater
detail in the company’s Annual Report on Form 10-K for the year ended Dec. 31,
2005, page 65, and in the company’s Quarterly Report on Form 10-Q for the quarter
ended June 30, 2006. The company undertakes no obligation to update or revise
any forward-looking statement.
###
The Timken Company
6. CONSOLIDATED STATEMENT OF INCOME AS REPORTED ADJUSTED (1)
(Thousands of U.S. dollars, except share data) (Unaudited) Q3 06 Q3 05 Nine Months 06 Nine Months 05 Q3 06 Q3 05 Nine Months 06 Nine Months 05
Net sales $1,272,922 $1,258,133 $4,008,027 $3,887,351 $1,272,922 $1,258,133 $4,008,027 $3,887,351
Cost of products sold 1,021,019 1,002,705 3,147,732 3,076,089 1,021,019 1,002,705 3,147,732 3,076,089
Manufacturing rationalization/reorganization expenses -
cost of products sold 3,419 3,017 11,400 10,189 - - - -
Gross Profit $248,484 $252,411 $848,895 $801,073 $251,903 $255,428 $860,295 $811,262
Selling, administrative & general expenses (SG&A) 162,955 162,231 511,778 487,325 162,955 162,231 511,778 487,325
Manufacturing rationalization/reorganization expenses - SG&A 1,044 790 2,737 1,477 - - - -
Impairment and restructuring 2,682 24,451 21,162 24,407 - - - -
Operating Income $81,803 $64,939 $313,218 $287,864 $88,948 $93,197 $348,517 $323,937
Other (expense) income (2,018) (4,265) (11,367) (12,433) (2,018) (4,265) (11,367) (12,433)
Special items - other (expense) income 76 (8) 2,430 2,987 - - - -
Earnings Before Interest and Taxes (EBIT) (2) $79,861 $60,666 $304,281 $278,418 $86,930 $88,932 $337,150 $311,504
Interest expense, net (10,850) (11,968) (34,149) (37,157) (10,850) (11,968) (34,149) (37,157)
Income Before Income Taxes $69,011 $48,698 $270,132 $241,261 $76,080 $76,964 $303,001 $274,347
Provision for income taxes 22,465 8,867 82,955 75,861 21,849 23,501 96,960 90,809
Net Income $46,546 $39,831 $187,177 $165,400 $54,231 $53,463 $206,041 $183,538
Earnings Per Share $0.50 $0.43 $2.01 $1.81 $0.58 $0.58 $2.21 $2.01
Earnings Per Share-assuming dilution $0.49 $0.43 $1.99 $1.79 $0.57 $0.58 $2.19 $1.99
Average Shares Outstanding 93,500,491 91,688,231 93,239,292 91,238,444 93,500,491 91,688,231 93,239,292 91,238,444
Average Shares Outstanding-assuming dilution 94,376,937 92,821,344 94,238,413 92,181,013 94,376,937 92,821,344 94,238,413 92,181,013
(1) quot;Adjustedquot; statements exclude the impact of impairment and restructuring, manufacturing rationalization/reorganization and special charges and credits for all periods shown.
Management believes that the adjusted statements are more representative of the company's performance and therefore useful to investors.
7. BUSINESS SEGMENTS
(Thousands of U.S. dollars) (Unaudited) Q3 06 Q3 05 Nine Months 06 Nine Months 05
Industrial Group
Net sales to external customers $501,347 $467,774 $1,533,397 $1,433,746
Intersegment sales 469 435 1,366 1,461
Total net sales $501,816 $468,209 $1,534,763 $1,435,207
Adjusted earnings before interest and taxes (EBIT) * (2) $48,180 $47,444 $157,557 $158,072
Adjusted EBIT Margin (2) 9.6% 10.1% 10.3% 11.0%
Automotive Group
Net sales to external customers $363,586 $407,959 $1,211,284 $1,254,173
Adjusted (loss) earnings before interest and taxes (EBIT) * (2) ($26,276) ($6,040) ($31,377) ($12,357)
Adjusted EBIT (Loss) Margin (2) -7.2% -1.5% -2.6% -1.0%
Steel Group
Net sales to external customers $407,989 $382,400 $1,263,346 $1,199,432
Intersegment sales 34,584 45,512 116,556 141,248
Total net sales $442,573 $427,912 $1,379,902 $1,340,680
Adjusted earnings before interest and taxes (EBIT) * (2) $63,010 $49,698 $209,580 $170,171
Adjusted EBIT Margin (2) 14.2% 11.6% 15.2% 12.7%
*Industrial Group, Automotive Group and Steel Group EBIT do not equal Consolidated EBIT due to intersegment adjustments which are eliminated upon consolidation.
(2) EBIT is defined as operating income plus other income (expense). EBIT Margin is EBIT as a percentage of net sales. EBIT and EBIT margin on a segment basis
exclude certain special items set forth above. EBIT and EBIT Margin are important financial measures used in the management of the business, including decisions
concerning the allocation of resources and assessment of performance. Management believes that reporting EBIT and EBIT Margin best reflect the performance of
our business segments and EBIT disclosures are responsive to investors.
8. Reconciliation of Total Debt to Net Debt and the Ratio of Net Debt to Capital:
(Thousands of U.S. Dollars) (Unaudited) Sept 30, 2006 Jun 30, 2006 Dec 31, 2005
Short-term debt $204,166 $150,983 $159,279
Long-term debt 548,611 553,016 561,747
Total Debt 752,777 703,999 721,026
Less: cash and cash equivalents (54,069) (38,752) (65,417)
Net Debt $698,708 $665,247 $655,609
Shareholders' equity 1,697,303 1,661,302 1,497,067
Ratio of Total Debt to Capital 30.7% 29.8% 32.5%
Ratio of Net Debt to Capital (Leverage) 29.2% 28.6% 30.5%
This reconciliation is provided as additional relevant information about Timken's financial position. Capital is defined as debt plus shareholder's equity.
Management believes Net Debt is more representative of Timken's indicative financial position, due to the amount of cash and cash equivalents.
Reconciliation of GAAP net income and EPS - Basic and Diluted as previously disclosed.
This reconciliation is provided as additional relevant information about the company's performance. Management believes adjusted net income and adjusted earnings
per share are more representative of the company's performance and therefore useful to investors. Management also believes that it is appropriate to compare GAAP
net income to adjusted net income in light of special items related to impairment and restructuring and manufacturing rationalization/ reorganization costs,
Continued Dumping and Subsidy Offset Act (CDSOA) receipts, and gain on the sale of non-strategic assets.
Third Quarter Nine Months
06 05 06 05
(Thousands of U.S. dollars, except share data) (Unaudited) $ EPS $ EPS $ EPS $ EPS
assuming dilution assuming dilution assuming dilution assuming dilution
Net income $46,546 $0.49 $39,831 $0.43 $187,177 $1.99 $165,400 $1.79
Pre-tax special items:
Manufacturing rationalization/reorganization expenses - cost of products
sold 3,419 0.04 3,017 0.03 11,400 0.12 10,189 0.11
Manufacturing rationalization/reorganization expenses - SG&A 1,044 0.01 790 0.01 2,737 0.03 1,477 0.02
Impairment and restructuring 2,682 0.03 24,451 0.26 21,162 0.22 24,407 0.26
Special items - other expense (income) (76) - 8 - (2,430) (0.03) (2,987) (0.03)
Provision for income taxes 616 - (14,634) (0.15) (14,005) (0.14) (14,948) (0.16)
Adjusted net income $54,231 $0.57 $53,463 $0.58 $206,041 $2.19 $183,538 $1.99
Reconciliation of Outlook Information.
Expected earnings per diluted share for the full year exclude special items. Examples of such special items include impairment and restructuring, manufacturing
rationalization/reorganization expenses, gain or loss on the sale of non-strategic assets, and payments under the CDSOA. It is not possible at this time to identify the potential amount or significance
of these special items. We cannot predict whether we will receive any additional payments under the CDSOA in 2006 and if so, in what amount. If we do receive any additional
CDSOA payments, they will most likely be received in the fourth quarter.
9. CONSOLIDATED BALANCE SHEET Sept 30 Dec 31
2006 2005
(Thousands of U.S. dollars) (Unaudited)
ASSETS
Cash & cash equivalents $54,069 $65,417
Accounts receivable, net 734,631 711,783
Inventories, net 1,077,792 998,368
Deferred income taxes 92,369 104,978
Other current assets 104,646 102,763
Total Current Assets $2,063,507 $1,983,309
Property, plant & equipment 1,606,782 1,547,044
Goodwill 216,961 204,129
Other assets 256,804 259,252
Total Assets $4,144,054 $3,993,734
LIABILITIES
Accounts payable & other liabilities $506,866 $501,423
Short-term debt 204,166 159,279
Income Taxes 60,633 35,360
Accrued expenses 313,075 375,264
Total Current Liabilities $1,084,740 $1,071,326
Long-term debt 548,611 561,747
Accrued pension cost 209,052 246,692
Accrued postretirement benefits cost 519,792 513,771
Other non-current liabilities 84,556 103,131
Total Liabilities $2,446,751 $2,496,667
SHAREHOLDERS' EQUITY 1,697,303 1,497,067
Total Liabilities and Shareholders' Equity $4,144,054 $3,993,734
10. CONDENSED CONSOLIDATED STATEMENT OF CASH FLOWS For the three months ended For the nine months ended
Sept 30 Sept 30 Sept 30 Sept 30
(Thousands of U.S. dollars) (Unaudited) 2006 2005 2006 2005
Cash Provided (Used)
OPERATING ACTIVITIES
Net Income $46,546 $39,831 $187,177 $165,400
Adjustments to reconcile net income to net cash provided (used)
by operating activities:
Depreciation and amortization 49,640 53,066 151,226 160,765
Other 6,302 207 (1,548) (4,203)
Changes in operating assets and liabilities:
Accounts receivable 54,808 13,460 (14,082) (110,262)
Inventories (29,495) (37,512) (57,837) (162,106)
Other assets (9,945) (52) (8,732) (28,671)
Accounts payable and accrued expenses (45,434) 2,374 (73,963) 79,190
Foreign currency translation loss (gain) 1,116 (1,854) (9,891) 5,581
Net Cash Provided by Operating Activities 73,538 69,520 172,350 105,694
INVESTING ACTIVITIES
Capital expenditures (74,490) (45,379) (179,419) (128,605)
Other 4,896 2,937 6,158 6,847
Divestments - 848 (2,723) 11,729
Acquisitions (4,299) (73) (4,299) (6,629)
Net Cash Used by Investing Activities (73,893) (41,667) (180,283) (116,658)
FINANCING ACTIVITIES
Cash dividends paid to shareholders (15,049) (13,824) (43,170) (41,238)
Net proceeds from common share activity 3,967 18,160 22,066 30,740
Net borrowings (payments) on credit facilities 26,848 (37,533) 15,122 38,399
Net Cash Provided (Used) by Financing Activities 15,766 (33,197) (5,982) 27,901
Effect of exchange rate changes on cash (94) 1,469 2,567 (4,799)
Increase (Decrease) in Cash and Cash Equivalents 15,317 (3,875) (11,348) 12,138
Cash and Cash Equivalents at Beginning of Period $38,752 $66,980 $65,417 $50,967
Cash and Cash Equivalents at End of Period $54,069 $63,105 $54,069 $63,105