VIP Kolkata Call Girl Serampore 👉 8250192130 Available With Room
3Q 2008T RANSCRIPT
1. PPG Industries, Inc. Third Quarter 2008 Financial Results
William H. Hernandez, Sr. Vice President, Finance – October 16, 2008, Recorded Comments
Highlights – Q3, 2008
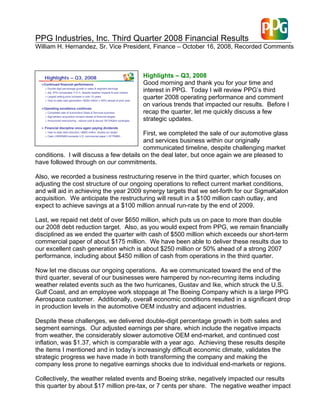
Highlights – Q3, 2008
Good morning and thank you for your time and
Continued financial performance
interest in PPG. Today I will review PPG’s third
Double-digit percentage growth in sales & segment earnings
Adj. EPS comparable Y-O-Y, despite weather impacts & auto market
quarter 2008 operating performance and comment
Largest selling price increase in over 10 years
Year-to-date cash generation >$250 million (~50%) ahead of prior year
on various trends that impacted our results. Before I
Operating excellence continues
recap the quarter, let me quickly discuss a few
Completed sale of Automotive Glass & Services business
strategic updates.
SigmaKalon acquisition remains ahead of financial targets
Announced restructuring - reduce cost & secure ‘09 S/Kalon synergies
Financial discipline once again paying dividends
First, we completed the sale of our automotive glass
Year-to-date debt reduction >$650 million, double our target
Cash (>$500MM) exceeds U.S. commercial paper (~$175MM)
and services business within our originally
communicated timeline, despite challenging market
conditions. I will discuss a few details on the deal later, but once again we are pleased to
have followed through on our commitments.
Also, we recorded a business restructuring reserve in the third quarter, which focuses on
adjusting the cost structure of our ongoing operations to reflect current market conditions,
and will aid in achieving the year 2009 synergy targets that we set-forth for our SigmaKalon
acquisition. We anticipate the restructuring will result in a $100 million cash outlay, and
expect to achieve savings at a $100 million annual run-rate by the end of 2009.
Last, we repaid net debt of over $650 million, which puts us on pace to more than double
our 2008 debt reduction target. Also, as you would expect from PPG, we remain financially
disciplined as we ended the quarter with cash of $500 million which exceeds our short-term
commercial paper of about $175 million. We have been able to deliver these results due to
our excellent cash generation which is about $250 million or 50% ahead of a strong 2007
performance, including about $450 million of cash from operations in the third quarter.
Now let me discuss our ongoing operations. As we communicated toward the end of the
third quarter, several of our businesses were hampered by non-recurring items including
weather related events such as the two hurricanes, Gustav and Ike, which struck the U.S.
Gulf Coast, and an employee work stoppage at The Boeing Company which is a large PPG
Aerospace customer. Additionally, overall economic conditions resulted in a significant drop
in production levels in the automotive OEM industry and adjacent industries.
Despite these challenges, we delivered double-digit percentage growth in both sales and
segment earnings. Our adjusted earnings per share, which include the negative impacts
from weather, the considerably slower automotive OEM end-market, and continued cost
inflation, was $1.37, which is comparable with a year ago. Achieving these results despite
the items I mentioned and in today’s increasingly difficult economic climate, validates the
strategic progress we have made in both transforming the company and making the
company less prone to negative earnings shocks due to individual end-markets or regions.
Collectively, the weather related events and Boeing strike, negatively impacted our results
this quarter by about $17 million pre-tax, or 7 cents per share. The negative weather impact
2. 2
to our financial results was less severe than we originally anticipated and communicated in
September, due to better end-of-month performance in our commodity chemical business,
as customer demand in the Gulf Coast region returned more quickly and stronger than we
expected.
Meanwhile, the lower automotive OEM activity levels, which are primarily reflected in our
Industrial Coatings reporting segment, combined with higher cost inflation, resulted in the
majority of the substantial operating earnings decline for that segment versus last year as
segment earnings fell 46 percent. And, although we sold the business at quarter-end, the
third quarter automotive glass operating results were included in our reported earnings and
also dropped versus last year.
Again, despite these notable headwinds, the company still delivered comparable results as
the remainder of our business portfolio performed well despite slowing in the overall
economy, and our results were aided by our largest quarterly selling price increase in at
least a decade.
Our Commodity Chemical business, despite some negative impact from the weather related
events, performed exceptionally well with year-over-year earnings up about 30 percent.
Additionally, our Optical and Specialty Materials segment grew earnings by nearly 11
percent and our Performance Coatings segment, despite the Boeing work stoppage in
September, still grew earnings by about 6 percent.
Finally our SigmaKalon acquisition remains ahead of our financial targets supported by the
continued growth of our Architectural EMEA segment, which consists of the majority of the
SigmaKalon acquisition. Third quarter year-over-year sales were up over 12 percent to
$632 million as organic growth, comprised of higher prices and stronger volumes,
accelerated further this quarter, and was supplemented by currency gains. Segment
earnings were $61 million, which includes a reduction of $30 million for depreciation and
ongoing amortization stemming from acquisition accounting.
Let me conclude my recap of the quarter by stating once again the strong execution which
you have come to expect from PPG, our broad geographic reach and diverse end-markets,
and our prudent approach toward managing our cash has once again produced solid
financial performance despite a variety of headwinds. Also, with our recently announced
restructuring, we are taking further action to adjust our cost structure to the shifts in the
global markets we serve.
And now if you turn to the next slide let me review some of the details for the quarter.
Segment Results
Business Segment Results
First, our reported sales exceeded $4.2 billion, up
Third Quarter
$MM (USD)
about 37 percent from last year, establishing a new
Sales Segment Earnings
2008 2007 Chg. 2008 2007 Chg.
PPG third quarter record. Despite the challenging
Performance Coatings $ 1,229 $ 963 28% $ 148 $ 140 6%
Industrial Coatings 1,022 901 13% 48 89 -46%
economic backdrop, we delivered for the twenty-
Architectural Coatings EMEA 632 - - 61 - -
Optical & Specialty Mtls. 290 257 13% 61 55 11%
second consecutive quarter a year-over-year
Commodity Chemicals 500 400 25% 116 89 30%
Sub-Total $ 3,673 $ 2,521 46% $ 434 $ 373 16%
Glass
quarterly sales record. Every one of our segments,
Fiber Glass & P/Glazings $ 323 $ 303 7% $ 22 $ 27 -19%
Auto Glass & Services 229 249 -8% 8 -163%
(5)
Grand-Total $ 4,225 $ 3,073 37% $ 451 $ 408 11%
except Glass, posted double-digit sales growth.
Double-digit-percent growth in sales and segment earnings
3. 3
Our acquisitions, primarily SigmaKalon, added about 30 percent to PPG’s total sales and
increased the sales in our combined coatings segments by about 50 percent.
We also delivered our best quarterly pricing results in at least a decade, as year-over-year
selling prices added about $175 million to our sales.
Our volumes were down less than one percent. We experienced extremely weak U.S. end-
market demand in automotive OEM and lower demand in residential construction. We offset
those volume declines with solid volume growth in several businesses including optical and
aerospace, as well as continued growth in emerging regions.
Currency was also slightly incremental, adding an additional 2 percent to sales.
Our segment earnings grew by over 10 percent, which is a result of the earnings of acquired
businesses, the double-digit growth in the commodity chemical and optical and specialty
materials segments, and the growth we delivered in emerging regions. Many of our
business units delivered third quarter earnings records as well.
Once again, we are proud of our growth and overall solid performance in today’s economy.
Now let’s review our earnings per share results.
Quarterly EPS Reconciliation - 2007 & 2008
Adjusted Financial Results
The next slide provides a reconciliation of our
continuing operations reported earnings per share to
Third quarter earnings-per-share Reg G 2008 2007
Reconciliation
our adjusted earnings per share for both this year
Reported Earnings per Share, Continuing Operations,
$0.70 $1.29
Fully Diluted
and last, adjusting for unusual charges.
Add: 2008 Business Restructuring 0.67 --
Less: 2008 Auto Glass Gain on Business Sale (0.02) --
Our reported earnings per share in the quarter was
Add: Asbestos 0.02 0.02
$0.70. We had unusual charges of $0.67 for
Add: 2007 Acquisition Related Charges -- 0.03
business restructuring and $0.02 for our proposed
Add: 2007 Auto Glass Charges -- 0.06
Adjusted Earnings per Share, Continuing Operations,
asbestos settlement. We also had a one-time gain of
$1.37 $1.40
Fully Diluted
$0.02 relating to our completed automotive glass
divestiture. Our third quarter adjusted earnings per share excluding the one-time and
unusual items is $1.37. This compares with $1.40 last year.
This performance provides both validation of the strength of our portfolio as well as a
milepost on the progress of the company’s transformation to a coatings, optical and
specialty materials company.
Now let’s review some of the details.
4. 4
Sales U.S. and Canada
Sales – United States & Canada
Looking quickly at our sales results by region, our
Sales growth rates higher
year-over-year sales in the U.S. and Canada grew by
than last year despite
negative weather impacts
6 percent in the third quarter, which is a much higher
Price gains accelerated
6%
growth rate than last year despite volumes being
2% Significant declines in U.S.
Auto OEM volumes
hampered by weather related issues. Pricing
Lower Y-O-Y volumes in
improved by 8 percent with every business, except
residential construction
our automotive OEM businesses, posting fairly solid
Volume gains in most
other PPG businesses
pricing gains as we continue to work to offset cost
Additional Q4 pricing
actions underway
inflation.
Volumes in the region were down 2 percent including the negative weather and Boeing
strike effects. As mentioned, the U.S. automotive OEM industry weakened even further this
quarter, while residential construction remained weak. Many of our other business units did
experience higher volumes in this region highlighted by optical and aerospace.
We anticipate the fourth quarter to be equally challenging from an automotive OEM volume
perspective, but we also expect to gain additional pricing.
Organic Growth - Europe
Organic Growth – Europe
Moving to the next slide, our European sales grew by
Stable organic results on
about $850 million dollars, up more than 130 percent,
top of difficult “comps”
the past two years
primarily due to our SigmaKalon acquisition and
Pricing gains outpaced
slight volume drop
currency. All SigmaKalon sales, including organic
Excludes
SigmaKalon
acquisition
Overall European sales
growth versus their 2007 performance, are classified
up $850MM (130%)
versus last year –
as increases due to acquisition and thus not
SigmaKalon acquisition
illustrated on this chart. As I mentioned
SigmaKalon organic
growth accelerated
SigmaKalon’s organic growth rate accelerated during
Q4 pricing actions
2006 2007 2008 underway
the quarter.
Excluding SigmaKalon, our selling prices increased by 2 percent which offset slightly
negative volumes which were down 1 percent. As you can see on the graph, activity in the
region has been fairly comparable all year. Also, as with the last few quarters, our quarterly
comparables from both 2007 and 2006 were exceedingly difficult so maintaining these prior
year gains is pleasing.
Regarding the fourth quarter, we are currently expecting additional slowing of general
industrial growth in Western Europe, which will be partially offset by solid growth in Eastern
Europe. We also expect to realize higher selling prices in this region.
Sales by Region Asia
Organic Growth – Asia
Our Asian results are detailed on the next slide and
September ‘08 YTD
sales 20% higher than
our year-to-date sales in this region through
full year 2007 sales.
September have already eclipsed, by about 20
Double-digit percent
organic growth despite
slowing surrounding
percent, our full year sales from 2007 exemplifying
2008 Olympics
our continued rapid growth in the region.
Each PPG coatings
business is well
established
During the quarter we still delivered double-digit
Excellent operating
margins
organic growth despite lower activity levels around
Solid growth expected
2006 2007 2008
in Q4
the 2008 Summer Olympics held in Beijing.
5. 5
In the region, we have established a good market presence in each of our coatings
businesses and our profitability remains at a high level when compared with both overall
coatings industry margins and even PPG’s other regions.
We expect similar growth rates to continue in this region in the fourth quarter.
Now before I discuss each of our individual business segments, let me discuss a few macro
topics.
Macro Topics and Outlook
Macro Topics
As detailed on the next slide, during the quarter we
Coatings Raw Materials Inflation
continued to experience year-over-year inflationary
Percentage – 2008 (year-over-year)
Q1 Expected Range & Actual
increases in the cost of energy and raw materials.
2% 4%
Q2 Expected Range & Actual
In the quarter, our primary energy cost, natural gas,
2% 4%
Incremental YOY Transportation Costs
inflated to just above $9.50 per unit, compared with
Q3 Expected Range & Actual
slightly under $7.00 in the third quarter of last year.
4% 6%
Our cost did move down from the second quarter of
Q4 Expected Range
this year when it was about $10.50 per unit.
5% 8%
$MM
For those of you less familiar with PPG, we use 60 to 70 trillion BTUs of natural gas a year
to generate power for the production of chlorine and caustic soda, and to produce glass and
fiber glass. So if natural gas unit costs change by one dollar per million BTU, our pre-tax
costs change by about 60 to 70 million dollars on an annual basis.
Looking ahead we have about forty percent of our fourth quarter gas needs hedged at about
$8.75 per MMBTU. As a reference point, our fourth quarter 2007 unit costs were about
$7.50.
We have also experienced inflation in our coatings raw material costs which include
petroleum based materials. Raw materials are the largest major component of production
costs for coatings. Our expectation at the outset of the third quarter was for year-over-year
inflation in the range of 4 to 6 percent and our actual inflation was right at 6 percent.
Our expectation for the fourth quarter is for year-over-year inflation in the range of 5 to 8
percent, but I will comment that it is a dynamic market today with both energy costs falling,
but remaining very volatile, and our suppliers growing concerned about demand levels.
In addition to raw materials and direct energy costs, we also experienced higher year-over-
year transportation costs and surcharges associated with higher gasoline and diesel costs.
Our total transportation costs in the quarter increased by about $20 million versus last year.
Regarding inflation overall, we have continually increased efforts to identify and qualify new
and more cost effective sources of raw materials. Also, as I mentioned earlier, our selling
price was up 6 percent this past quarter and our businesses are working to secure additional
pricing to further offset the higher costs.
Now before I review our business results in more detail, I typically provide an update on our
proposed asbestos settlement. For those not familiar with the details of the proposed
6. 6
settlement, please refer to the disclosures beginning on page 22 of our second quarter 2008
form 10 Q.
As we said in previous updates, we have filed motions asking the court to reconsider, alter
or amend its ruling from December, 2006. Also, various parties, including PPG, are
currently working toward an amended PPG settlement agreement to address issues the
court raised in its ruling. We continue to believe we are close to a potential resolution,
however given the overall complexity of the issue we are not able to offer any time line upon
which any next step will be taken.
Now let’s discuss the performance in each of our business segments.
Business Segment Performance – Performance
Performance Coatings
Coatings
Third Quarter 2008 $MM (USD) Q308 Q307 Chg %
The next slide illustrates the results in our
Aerospace sales +10% despite Sales 1,229 963 266 28%
Boeing employee work stoppage Earnings 148 140 8 6%
Protective & Marine volumes ↑
Performance Coatings segment. Third quarter sales
Double-digit organic growth in
acquired SigmaKalon business
grew by over $250 million or 28 percent. Acquisitions
U.S. Architectural pricing offsets
lower volumes
added 21 percent growth, currency added 3 percent,
Active sales pricing efforts
continue in all businesses
volumes were flat and price added 4 percent.
Yr. To Yr. % Change - Sales
Sales Volume Price Currency Acq./Other
Total Performance Coatings 28% 0% 4% 3% 21%
Aerospace 10% 6%
Automotive Refinish 12% 1%
Our segment earnings were $148 million, up 6
Architectural (Americas & Asia) 9% -6%
Protective & Marine 181% 4% (Volume growth excludes SigmaKalon
percent versus the prior year. A few key elements
acquired business)
driving the increased earnings were our pricing
efforts, our continued growth in Aerospace despite the negative impact of the Boeing work
stoppage, cost management in our U.S. Architectural business and our protective & marine
coatings business results which include a portion acquired in the SigmaKalon acquisition.
Let me review a few key items in our business units:
• In aerospace, our sales grew 10 percent, resulting primarily from our volume and pricing
gains. Volume growth outside the U.S. was up double-digit percentages, with U.S.
growth up moderately despite the Boeing work stoppage which started in early
September. This remains a solid business with continued growth prospects, but the level
of growth next quarter will depend on the length of the Boeing work stoppage.
• Our automotive refinish sales grew 12 percent supported by moderate gains in price,
volumes, currency and acquisitions. Share gains are offsetting industry volume declines
in the mature regions. Of note is the fact that we are delivering double-digit volume
growth in Asia and our quarter-end acquisition of the Chinese refinish paint company
Bonny will further expand our offering into that rapidly growing market.
• Our architectural coatings Americas and Asia business unit grew sales by 9 percent.
Our non-U.S. markets grew primarily as a result of a prior year acquisition and favorable
currency.
Our U.S. and Canadian sales were flat. Volumes were down mid-single digits as volume
in our national accounts rose, while company owned store and independent dealer
7. 7
volumes were down. We did achieve price increases in most channels as we continue to
work to offset raw material inflation. We remain at a very low activity level in the U.S,
and we continue to aggressively manage costs in this business.
Looking ahead we are continuing to seek further pricing to offset inflationary impacts,
and don’t expect any material changes in the overall activity level outside of the normal
seasonal decline.
• We continue to achieve high growth rates in our protective & marine coatings business
unit. The SigmaKalon acquisition has more than doubled our sales into this end-market
and the acquired business grew organically this quarter by mid-teen percentages, while
our legacy business grew both pricing and volumes by mid-single digits. We expect end-
market activity to remain strong for the foreseeable future.
To summarize the quarter for this segment, we offset lower activity levels in our U.S.
architectural coatings business with continued growth in aerospace, protective & marine and
in all businesses in emerging regions. Also, we realized a notable portion of our initial
pricing efforts which were intended to offset current year inflationary impacts. Finally, as I
have mentioned all this year, the protective & marine portion of SigmaKalon has been nicely
accretive and is performing ahead of our expectations both in end-market results and in
synergies.
Business Segment Performance – Industrial
Industrial Coatings
Coatings
Third Quarter 2008 $MM (USD) Q308 Q307 Chg %
Moving to the next slide detailing our Industrial
Significant auto OEM industry Sales 1,022 901 121 13%
production volume declines
Coatings segment, our sales rose by about $120
Earnings 48 89 -41 -46%
Slower general industrial activity in
mature regions
million or 13 percent. The gain was due primarily to
Stable Packaging coatings
Emerging regions now larger than
U.S. & Canada
our acquisitions, including the SigmaKalon industrial
Restructuring targeting slower end-
markets
coatings business. Favorable currency and price
Yr. To Yr. % Change - Sales
Sales Volume Price Currency Acq./Other
outpaced lower volumes.
Total Industrial Coatings 13% -2% 1% 3% 11%
Automotive OEM 2% -2%
Industrial 36% -2%
Packaging 9% -1%
Our segment earnings were down significantly,
dropping from $89 million to $48 million. A major
factor in this decline was the rapid deterioration in automotive OEM industry production
levels. In the quarter, U.S. auto OEM industry production declined by about 20 percent, a
sizable downward shift from just last quarter. Other impacts were from higher inflation and
industrial sales in the mature regions which slowed slightly. Continued growth in emerging
regions partially offset the slower end-markets and mature regions. Of note is that our sales
in emerging regions of Asia, Latin America and Eastern Europe, are now collectively much
larger than the sales in the U.S. and Canadian region.
Let me quickly comment on each of the businesses comprising the Industrial Coatings
segment:
• Our automotive OEM coatings sales were up 2 percent as volumes fell 2 percent,
including a 15 percent drop in the U.S. and Canadian market. The U.S. and Canadian
region represents about 30 percent of the business unit sales. Our combined non-U.S.
regions continued to grow by mid-single digit percentages, but growth rates in all these
regions moderated. Looking ahead, we expect at a minimum, an equally challenging
end-market in the fourth quarter.
8. 8
• Industrial coatings business unit sales improved over 35 percent, as the SigmaKalon
acquisition remained the main growth factor. Overall volumes were down 2 percent due
to softer demand in mature regions, partially offset by growth in emerging regions which
now account for over 40 percent of this business unit. Price gains accelerated to 2
percent for the business. We anticipate overall global activity levels to soften further in
the fourth quarter.
• Packaging coatings sales grew by 9 percent aided by currency and price, with slightly
lower volumes.
Overall our Industrial Coatings segment experienced a very difficult end-market decline. We
are reacting quickly to this decline and announced a business restructuring late in the
quarter which, in part, is targeted to lower this segment’s ongoing cost structure in regions
with lower ongoing activity levels. We will continue to focus on managing costs and will
respond to as any other challenges that arise in the end-markets served.
Business Performance – Architectural EMEA
Architectural Coatings EMEA
Our next slide is Architectural Europe, Middle East
and Africa or EMEA, and it represents about three-
Third Quarter 2008 $MM (USD) Q308 Q207 Chg %
Organic growth vs. 2007 accelerated Sales 632 n/a n/a n/a
to mid-single digit percentages
quarters of the acquired SigmaKalon business.
Earnings 61 n/a n/a n/a
Earnings include depreciation and
non-cash amortization of ~$30MM
Segment sales in a seasonally strong quarter were
Business is seasonally lighter in
fourth quarter
$632 million. Organic sales growth accelerated to
mid-single digit percentages versus pre-acquisition
Overall SigmaKalon Acquisition Update
Ahead of financial expectations
SigmaKalon results last year, reflecting continued
Organic growth accelerated this quarter
On pace for 2008 cost synergy target
growth in most regions.
Announced restructuring targeted to deliver 2009 cost synergies
Earnings for the segment were $61 million. These
earnings include $30 million each quarter in ongoing depreciation and non-cash
amortization of intangibles stemming from the acquisition.
The business is performing well and is pacing well ahead of a solid 2007 financial
performance. As I mentioned last quarter, we have minimal participation in several of the
most negatively impacted construction markets in Europe, such as Spain, Italy and Ireland.
We do participate in the U.K. market and that was our only major market with negative
growth when compared with last year. However, solid pricing gains and strong positions in
other, more stable regions and several Eastern European countries resulted in our
accelerated organic growth.
Looking ahead, I will remind you that the fourth quarter is traditionally our slowest quarter
seasonally in this business with about 20 percent of our annual sales in the fourth quarter
versus roughly 27 to 29 percent in the second and third quarters.
As with last quarter, I will take this opportunity to provide you with an update on the overall
SigmaKalon acquisition. This update includes our Architectural EMEA business, along with
the SigmaKalon businesses which we merged into our industrial and protective & marine
businesses.
As we mentioned previously, during the first quarter we secured permanent debt financing
within the interest rate guidance we set forth last November. Also, our integration efforts
9. 9
remain on schedule to achieve over $50 million of cost synergies this year. On top of that
we have through the first three quarters of the year achieved additional raw material cost
mitigation due to our enhanced purchasing power. This quarter, we announced business
restructuring plans within the acquired businesses that will aid us in delivering our 2009
synergies.
Looking at the combined financial results from all the acquired SigmaKalon businesses, I am
happy to report that we are exceeding our original 2008 financial targets due to stronger
performance by all three business segments, and this does not include the incremental raw
material cost mitigation I just mentioned.
Obviously we are pleased with the acquisition results and the notable impact on our financial
results this year.
Business Segment Performance – Optical
Products and Specialty Materials
Optical & Specialty Materials
Shifting to our Optical and Specialty Materials
Third Quarter 2008 $MM (USD) Q308 Q307 Chg %
segment on the next slide, we achieved double-digit
Double-digit percent sales and Sales 290 257 33 13%
earnings growth
Earnings 61 55 6 11%
segment sales and earnings growth. This was a
Double-digit optical volume
growth
European launch of new
result of 10 percent volume growth in optical
Transitions product in October
products, including Transitions. The growth rate
Yr. To Yr. % Change - Sales
accelerated versus the second quarter. Our specialty
Sales Volume Price Currency Acq./Other
materials business delivered strong price gains, but
Total Optical &
Specialty Materials 13% 7% 2% 4% 0%
posted volume declines reflecting lower automotive
demand for our silica products in tires and batteries.
As we communicated last quarter we increased, yet again, our marketing investments with
notably higher selling and marketing costs. The investments continued to drive profitable
growth as segment earnings grew 11 percent driven by optical volume gains.
Looking ahead, the roll-out of our new generation Transition Optical lens product in certain
European countries is now underway. As a result of this and continued strong demand in
general, we anticipate further growth in this segment in a seasonally slower fourth quarter.
Business Segment Performance – Commodity
Commodity Chemicals Chemicals
The next slide details our Commodity Chemicals
Third Quarter 2008 $MM (USD) Q308 Q307 Chg %
30% earnings improvement, despite Sales 500 400 100 25%
segment. This segment was negatively affected by
lost production/volumes due to U.S.
Earnings 116 89 27 30%
hurricanes
both U.S. hurricanes Ike and Gustav, which resulted
Increased selling prices in Q3, 2008
and announced for Q4, 2008
Low inventory position due to outages
in two voluntary shutdowns of our largest facility
Louisiana plant back to operating at
normal rates by end of September
which is located in Louisiana. While our facility
sustained minimal damage, production was curtailed
Yr. To Yr. % Change - Sales
Sales Volume Price Currency Acq./Other
by difficulties in securing critical raw materials and
Total Commodity
Chemicals 25% 1% 24% 0% 0%
transportation equipment, and similar issues for our
customer’s including inability to secure energy to
power their facilities.
Our facility returned to normal operating rates toward the end of September and the
hurricane impacts on the business were not as severe as we initially projected as customer
demand returned sooner and stronger than anticipated.
10. 10
In the quarter our sales increased by 25 percent to a new all-time quarterly record. Pricing,
in response to industry supply and demand dynamics plus higher costs for both natural gas
and ethylene, drove the majority of the sales gain.
Segment earnings improved by 30 percent, which includes negative effects from the
hurricanes.
As we look ahead, the fourth quarter is traditionally slower than the third quarter due to
seasonality. As we exited the third quarter, several products remained on force majeure do
to our low inventory position resulting from the outages and continued strong demand. Last,
price increases have been announced for select products for the fourth quarter.
Business Segment Performance - Glass
Glass Our next business segment slide details our Glass
segment. We sold the automotive glass and services
Total Glass Segment
Third Quarter 2008
$MM (USD) Q308 Q307 Chg %
Solid pricing gains
business on September 30, so our reported results
Sales 552 552 0 0%
Divested Auto Glass – Sept. 30th
Q3 - auto market very challenging Earnings 17 35 -18 -51%
for the quarter include the automotive glass business
Fiber Glass & Performance Glazings Automotive Glass & Services
results. However, to aid in the understanding of the
$MM (USD)
Q308 Q307 Chg % Q308 Q307 Chg %
Sales 323 303 20 7% Sales 229 249 -20 -8%
remaining glass businesses, we are providing
-163%
Earnings 22 27 -5 -19% Earnings -5 8 -13
financial figures both including and excluding the
Yr. To Yr. % Change - Sales
Sales Volume Price Currency Acq./Other
Total Glass 0% -5% 4% 1% 0%
automotive glass business.
Performance Glazings 8% -2%
Fiber Glass 5% -2%
Automotive Glass & Svcs. -8% -3%
Looking at the businesses which remain:
• Performance glazings sales improved 8 percent. Pricing was favorable as higher prices
in a few end-markets were combined with our energy surcharge. Volumes dropped
slightly as volumes into the commercial construction segment were up, while residential
construction volumes sagged.
• Fiber glass sales advanced 5 percent mostly due to pricing gains.
Combined earnings from these two businesses declined by about $5 million versus last year
as lower volumes and inflation more than countered the improved pricing and lower
manufacturing costs. Looking ahead we anticipate some additional, moderate demand
erosion in some industrial end-markets of these businesses in the fourth quarter.
Now let me quickly describe our automotive glass and services operating results.
Automotive glass and services sales decreased 8 percent, stemming, in part, from lower
end-market demand. Earnings were down by $13 million.
The business sale was completed on September 30, and on an ongoing basis we will hold
about a 40 percent minority share in the new entity. Also, PPG retained liabilities for
pension and retirement benefits which were earned up to the business sale date, and we will
recognize earnings and balance sheet impacts from these liabilities going forward based on
GAAP requirements.
Now let’s move to the company’s cash results.
11. 11
Cash
Cash Generation and Cash Uses
The subsequent slide provides some details on our
Cash From Operations:
cash position and year-to-date cash uses. For the
Strong Q3 and YTD performance
quarter we generated about $450 million in cash from
YTD cash from operations >$800MM
operations. On a year-to-date basis our cash from
2008 YTD results ~50% higher than 2007
operations exceeds $800 million, and is more than
$250 million, or about 50 percent ahead of last year’s
Cash / Liquidity:
Debt reduction ($650MM) on pace for more than
pace. Our uses of cash through September are as
double full year target
follows:
Cash (>$500MM) exceeds U.S. commercial
paper (~$175MM)
• Year-to-date we have spent approximately $260
million on organic capital spending, excluding acquisitions, or about 2 percent of sales.
• Our dividend payments year-to-date totaled about $256 million, as dividends per share
are up 3 percent versus last year.
• Regarding debt, we assumed about $1.5 billion in the first quarter as a result of our
SigmaKalon acquisition. Year-to-date we have paid down net debt of over $650 million
which has already nearly doubled our debt reduction target for the entire year.
Regarding pensions, we made pre-tax contributions of about $100 million this year.
• Next are acquisitions, and outside of SigmaKalon we have made a few bolt-on
acquisitions this year.
• Finally are share repurchases and through the third quarter our focus remained on
offsetting dilution from options.
Let me conclude my cash discussion by reiterating what I stated in my opening comments.
Our culture as a company, both historically and currently, is one of financial discipline.
Given the recent issues in the credit markets our long-standing financial policies are
providing us with an even larger benefit today. We currently have $500 million of cash
which well outpaces our commercial paper outstanding of about $175 million. Additionally,
the fourth quarter is traditionally a strong cash generation quarter for us, so we remain
extremely comfortable in our liquidity position and have actually been receiving interest on
our excess cash at rates higher than our short-term debt interest rates.
Conclusion
Now let me conclude my commentary on our third quarter results by highlighting a few key
takeaways from the quarter:
• As I mentioned at the outset, we are proud to deliver comparable year-over-year
adjusted earnings per share despite weather related issues and a generally more difficult
economic environment.
12. 12
• Our SigmaKalon acquisition performance continues to demonstrate how successful that
acquisition has been.
• We continue to execute on our transformation strategy with this quarter’s highlight being
the completion of the sale our automotive glass and services business.
• We are managing some difficult end-markets and, as you would expect us to do, have
reacted by quickly announcing business restructuring targeted at reducing our cost
footprint serving those markets.
• And a key measure of any company’s success is cash generation, and the level of our
year-over-year increase is providing us benefits and flexibility today and will do so into
the future.
In conclusion, we are experiencing one of the most tumultuous economic environments in
recent history. A time where a broad business portfolio and extended geographic reach,
traits that we have successfully built into PPG, are providing stability and continued growth
potential. Our performance this quarter and year-to-date confirms this, and we expect to
continue our solid performance including our pace of record cash generation.
13. 13
PPG INDUSTRIES, INC.
Business Segment Information
3rd Quarter Results
(Millions of Dollars)
Net Sales Segment Income (Loss)
2008 2007 2008 2007
PERFORMANCE COATINGS $ 1,229 $ 963 $ 148 $ 140
INDUSTRIAL COATINGS 1,022 901 48 89
ARCHITECTURAL COATINGS EMEA 632 - 61 -
OPTICAL and SPECIALTY MATERIALS 290 257 61 55
COMMODITY CHEMICALS 500 400 116 89
GLASS (NOTE A) 552 552 17 35
SUBTOTAL $ 4,225 $ 3,073 $ 451 $ 408
(4) (20)
LEGACY COSTS (NOTE B)
(163) -
BUSINESS RESTRUCTURING (NOTE C)
GAIN ON AUTOMOTIVE GLASS AND SERVICES
15 -
DIVESTITURE
- (6)
ACQUISITION RELATED COSTS (NOTE D)
(5) (5)
ASBESTOS SETTLEMENT - NET
(57) (19)
INTEREST EXPENSE, NET OF INTEREST INCOME (NOTE E)
UNALLOCATED STOCK BASED
(12) (13)
COMPENSATION (NOTE F)
(22) (9)
OTHER UNALLOCATED CORP. EXPENSE - NET
INCOME BEFORE INCOME TAXES AND
MINORITY INTEREST $ 203 $ 336
Note A:
Glass net sales and segment income include the results of the automotive glass and services business for the three months ended September
30, 2008 and 2007, respectively.
Note B:
Legacy costs include current costs related to former operations of the Company, including certain environmental remediation, pension and other
postretirement benefit costs and certain charges that are considered to be unusual or non-recurring. For the three months ended Sept. 30, 2007,
these costs included a pretax charge of $17 million, primarily representing curtailment losses on certain defined benefit pension plans related to
automotive glass and services business.
Note C:
In the three months ended Sept. 30, 2008, business restructuring includes total charges of $42 million for the Performance Coatings segment, $53
million for the Industrial Coatings segment, $13 million for the Commodity Chemicals segment, and $55 million for the Glass segment. These costs
are considered to be unusual and non-recurring and will not reduce the segment earnings used to evaluate the performance of the operating
segments.
Note D:
Represents the flow through costs of sales of sales of the step up to fair value of acquired inventory related to the inventory acquired in the
Barloworld Coatings Australia transaction for the three months ended September 30, 2007. These costs are considered to be unusual and non-
recurring and will not reduce the segment earnings used to evaluate the performance of the operating segments.
Note E:
The increase in Interest expense, net of interest income, for the three months ended September 30, 2008, as compared to September 30, 2007,
is due to increased interest costs related to the financing of the SigmaKalon acquisition.
Note F:
Unallocated stock-based compensation includes the cost of stock options, restricted stock units and contingent share grants which are not
allocated to the operating segments.
14. 14
PPG INDU STRIES, INC.
Condensed Statement of Operations
3rd Quarter Results
(Millions of Dollars)
3 Months Ended
September 30,
2008 2007 % Change
Net Sales $ 4,225 $ 3,073 37.5
Cost of Sales 2,701 1,947
Selling and Other 991 681 45.5
Depreciation 105 89 18.0
Interest Expense 62 22
Amortization 34 15 126.7
Asbestos Settlement - Net 5 5
Business restructuring 163 -
Other - net (Note A) (39) (22)
Income Before Income Taxes,
203 336
and Minority Interest
Income Tax Expense 65 105 (38.1)
Minority Interest 21 18
Income from continuing operations 117 213
Income from discontinued operations, net of tax - (22)
(38.7)
Net Income $ 117 $ 191
Earnings per common share
Income from continuing operations $ 0.71 $ 1.30
Income from discontinued operations $ - $ (0.14)
(38.8)
Net Income $ 0.71 $ 1.16
Earnings per common share -- assuming dilution
Income from continuing operations $ 0.70 $ 1.29
Income from discontinued operations $ - $ (0.14)
(39.1)
Net Income $ 0.70 $ 1.15
0.2
Average shares outstanding 164.7 164.4
Average shares outstanding --
(0.2)
assuming dilution 165.6 166.0
Note A
The three months ended September 30, 2008, include a pretax gain of $15 million for the divestiture of the
automotive glass and services business.
15. 15
Forward-Looking Statement
Statements contained herein relating to matters that are not historical facts are forward-
looking statements reflecting PPG’s current view with respect to future events and financial
performance. These matters involve risks and uncertainties that may affect PPG’s
operations, as discussed in PPG’s filings with the Securities and Exchange Commission
pursuant to Sections 13(a), 13(c) or 15(d) of the Securities Exchange Act of 1934, as
amended, and the rules and regulations promulgated thereunder. Accordingly, many factors
may cause actual results to differ materially from the forward-looking statements contained
herein. Such factors include increasing price and product competition by foreign and
domestic competitors, fluctuations in cost and availability of raw materials and energy, the
ability to maintain favorable supplier relationships and arrangements, economic and political
conditions in international markets, foreign exchange rates and fluctuations in such rates,
the impact of environmental regulations, unexpected business disruptions, and the
unpredictability of existing and possible future litigation, including litigation that could result if
the asbestos settlement discussed in PPG’s filings with the Securities and Exchange
Commission does not become effective. However, it is not possible to predict or identify all
such factors. Consequently, while the list of factors presented here is considered
representative, no such list should be considered to be a complete statement of all potential
risks and uncertainties. Unlisted factors may present significant additional obstacles to the
realization of forward-looking statements. Consequences of material differences in results
compared with those anticipated in the forward-looking statements could include, among
other things, business disruption, operational problems, financial loss, legal liability to third
parties and similar risks, any of which could have a material adverse effect on PPG’s
consolidated financial condition, operations or liquidity. All information in this presentation
speaks only as of October 16, 2008, and any distribution of this presentation after that date
is not intended and will not be construed as updating or confirming such information.