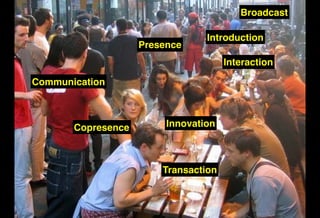
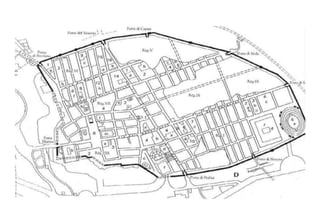
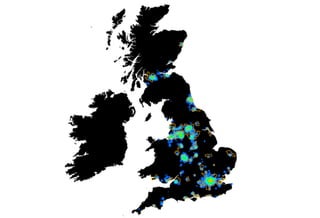
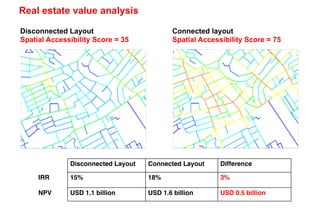
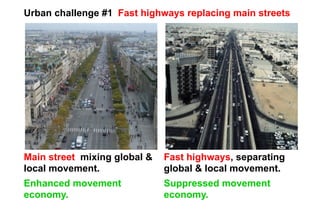
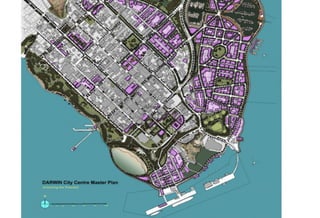
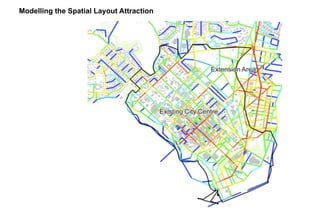
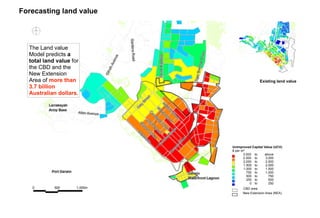
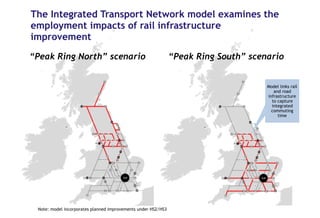
Northern Kentucky Business Leaders present how to grow the Life Science Industry in the Northern Kentucky region at the Covington Business Council Luncheon on April 21, 2011.
1. Letter to all state governments to shortlist potential Smart Cities based on Stage-I criteria according to a number of Smart Cities distributed across states /UTs by the MoUD. This is the first stage of the Intra-State competition.
2. On the basis of response from States/UTs, the list of potential 100 Smart Cities is announced. The second stage of the All India competition begins.
3. Each potential Smart City prepares its proposal assisted by a consultant (from a panel prepared by MoUD) and a hand-holding External Agency (various offers received such as World Bank, ADB, GEF, USTDA, JICA, DFID, AFD, KfW, UN-Habitat)
4. By stipulated date, Stage 2 proposals submitted. Evaluation by a panel of experts.
5. Selected cities declared – Round 1 Smart Cities
6. Selected cities set up SPV and start the implementation of their SCP. Preparation of DPRs, tenders, etc. and Other cities prepare to improve their proposal for the next round of the Challenge
K mark dyer_peoplefriendlycitiesdatarichworldevaminerva
Presentation by Prof. Mark Dyer, chair of the COST Action TU1204, People Friendly Cities in a Data Rich World at
the kick off meeting - 2013
Presented by the Chair of the session at the
EVA/Minerva Jerusalem International Conference on Digitisation of Culture,
Jerusalem, The Jerusalem Van Leer Institute, 12-13 November 2013
http://www.digital-heritage.org.il
Presentations available at: http://2013.minervaisrael.org.il
I did this brief presentation for the Urban Design and Mobility Forum - a public interface partnership between civil society and the Office of the Mayor of Cape Town in conjunction with Young Urbanists. I was asked to speak on the theme of "getting density right" in the context of Cape Town, South Africa.
Open Data Innovation in Smart Cities: Challenges and TrendsEdward Curry
Open Data initiatives are increasingly considered as defining elements of emerging smart cities. However, few studies have attempted to provide a better understanding of the nature of this convergence and the impact on both domains. This talk examines the challenges and trends with open data initiatives using a socio-technical perspective of smart cities. The talk presents findings from a detailed study of 18 open data initiatives across five smart cities to identify emerging best practice. Three distinct waves of open data innovation for smart cities are discussed. The talk details the specific impacts of open data innovation on the different smart cities domains, governance of the cities, and the nature of datasets available in the open data ecosystem within smart cities.
On June 9 in Washington, DC, the Metropolitan Policy Program at Brookings released “The Rise of Innovation Districts,” a report analyzing the new geography of innovation in America. The authors of the paper, Brookings Vice President Bruce Katz and Nonresident Senior Fellow Julie Wagner, were joined by leaders from emerging innovation districts across the country to discuss this shift and provide guidance to U.S. metro areas on ways to harness its potential.
The report is available here: http://www.brookings.edu/about/programs/metro/innovation-districts
We are delighted to share our insights to date on the Future of Cities. This is being released before our upcoming event in Singapore on 14 July 2016, to be led by Anupam Yog and Patrick Harris.
Future Agenda would like to thank Haworth for their kind hosting of the event on the 14th and The Partners who are kindly helping us with logistics in advance. Material here is from an initial perspective written by Harry Rich, CEO RIBA and which has been built upon subsequently with conversations in Dubai, Christchurch NZ, Singapore and Beiruit.
More Future of Cities workshops are planned throughout 2016 for Los Angeles, Shanghai, London and Dubai.
Comments very welcome.
Adjusting primitives for graph : SHORT REPORT / NOTESSubhajit Sahu
Graph algorithms, like PageRank Compressed Sparse Row (CSR) is an adjacency-list based graph representation that is
Multiply with different modes (map)
1. Performance of sequential execution based vs OpenMP based vector multiply.
2. Comparing various launch configs for CUDA based vector multiply.
Sum with different storage types (reduce)
1. Performance of vector element sum using float vs bfloat16 as the storage type.
Sum with different modes (reduce)
1. Performance of sequential execution based vs OpenMP based vector element sum.
2. Performance of memcpy vs in-place based CUDA based vector element sum.
3. Comparing various launch configs for CUDA based vector element sum (memcpy).
4. Comparing various launch configs for CUDA based vector element sum (in-place).
Sum with in-place strategies of CUDA mode (reduce)
1. Comparing various launch configs for CUDA based vector element sum (in-place).
Adjusting OpenMP PageRank : SHORT REPORT / NOTESSubhajit Sahu
For massive graphs that fit in RAM, but not in GPU memory, it is possible to take
advantage of a shared memory system with multiple CPUs, each with multiple cores, to
accelerate pagerank computation. If the NUMA architecture of the system is properly taken
into account with good vertex partitioning, the speedup can be significant. To take steps in
this direction, experiments are conducted to implement pagerank in OpenMP using two
different approaches, uniform and hybrid. The uniform approach runs all primitives required
for pagerank in OpenMP mode (with multiple threads). On the other hand, the hybrid
approach runs certain primitives in sequential mode (i.e., sumAt, multiply).
Levelwise PageRank with Loop-Based Dead End Handling Strategy : SHORT REPORT ...Subhajit Sahu
Abstract — Levelwise PageRank is an alternative method of PageRank computation which decomposes the input graph into a directed acyclic block-graph of strongly connected components, and processes them in topological order, one level at a time. This enables calculation for ranks in a distributed fashion without per-iteration communication, unlike the standard method where all vertices are processed in each iteration. It however comes with a precondition of the absence of dead ends in the input graph. Here, the native non-distributed performance of Levelwise PageRank was compared against Monolithic PageRank on a CPU as well as a GPU. To ensure a fair comparison, Monolithic PageRank was also performed on a graph where vertices were split by components. Results indicate that Levelwise PageRank is about as fast as Monolithic PageRank on the CPU, but quite a bit slower on the GPU. Slowdown on the GPU is likely caused by a large submission of small workloads, and expected to be non-issue when the computation is performed on massive graphs.
The Building Blocks of QuestDB, a Time Series Databasejavier ramirez
Talk Delivered at Valencia Codes Meetup 2024-06.
Traditionally, databases have treated timestamps just as another data type. However, when performing real-time analytics, timestamps should be first class citizens and we need rich time semantics to get the most out of our data. We also need to deal with ever growing datasets while keeping performant, which is as fun as it sounds.
It is no wonder time-series databases are now more popular than ever before. Join me in this session to learn about the internal architecture and building blocks of QuestDB, an open source time-series database designed for speed. We will also review a history of some of the changes we have gone over the past two years to deal with late and unordered data, non-blocking writes, read-replicas, or faster batch ingestion.
06-04-2024 - NYC Tech Week - Discussion on Vector Databases, Unstructured Data and AI
Discussion on Vector Databases, Unstructured Data and AI
https://www.meetup.com/unstructured-data-meetup-new-york/
This meetup is for people working in unstructured data. Speakers will come present about related topics such as vector databases, LLMs, and managing data at scale. The intended audience of this group includes roles like machine learning engineers, data scientists, data engineers, software engineers, and PMs.This meetup was formerly Milvus Meetup, and is sponsored by Zilliz maintainers of Milvus.
Analysis insight about a Flyball dog competition team's performanceroli9797
Insight of my analysis about a Flyball dog competition team's last year performance. Find more: https://github.com/rolandnagy-ds/flyball_race_analysis/tree/main
1. Growing smarter
An approach to intelligent spatial
planning using the evidence
How should Norfolk grow?
Norwich, 20th November 2015
Tim Stonor
t.stonor@spacesyntax.com
@Tim_Stonor
Space Syntax
7. Underpinning policy with evidence
Short-term
50 yearsThe right science
for emergencies
Current issues:
Well-being, health,
security & resilience
e.g. Ebola e.g. Cybersecurity e.g. Future of Cities
Medium-term Long-term
Knowledge translated to economic advantage
Advocacy and leadership for science
Government’s Chief Scientific Adviser
16. New Extension Area (NEA)
CBD area
2,000
3,000
750
2,500
1,500
1,000
500
250
2,000
750
2,500
1,500
1,000
500
250
0
to
to
to
to
to
to
to
to
Unimproved Capital Value (UCV)
$ per m²
above3,000 to
Existing land value
The Land value
Model predicts
a total land
value for the
CBD and the
New Extension
Area of more
than 3.7
billion
Australian
dollars.
Forecasting land value
17.
18. The Integrated Transport Network model examines the
employment impacts of rail infrastructure improvement
18
“Peak Ring North” scenario “Peak Ring South” scenario
Note: model incorporates planned improvements under HS2/HS3
Model links rail
and road
infrastructure to
capture
integrated
commuting time
Editor's Notes
Good morning. I would like to start this presentation with a simple definition of planning. To me, planning is a matter of what goes where and how it connects together. So let me take those two components - the what and the how - with a couple of brief references to history.
But first let’s start with "why". Why do we have cities, or towns, or villages? First, because they are places to bring goods into - to sell. And second, they are places of social exchange. They always have been and they always will be. So, in planning future places, we need to have this front and foremost in our minds: planning is about creating places that maximises opportunities to interact and exchange: to provide high levels of access between where people live and where they might work or take leisure.
Here is a first lesson from history: at a very local level, the Romans knew all about this. The merchants lived immediately behind the shops: commuting four or five toga'd steps from where they lived to where they worked.
A second lesson: the shops were arranged next door to each other, in lines, on the main streets, just like Harlesden: concentrating the land use to make it easier for shoppers to walk around as many of them as possible. And locating these shops on the main streets where people would mostly likely be in the first place.
Lesson: streets matter.
Next principle: streets connect as grids so that it is easy to move around them. It is hard to get lost in a grid.
Next principle: city regions. Creating a hierarchy of interconnected places.
Cities - and city regions - matter to the UK government for a number of reasons.
First because of the pace of change occurring in UK cities in recent history and the change that is anticipated to occur in coming years. Second, because cities are places where policies land and where they either thrive or fail.
And third because recent history in planning has sadly been one as much of failure as it has been of success: failed inner-city housing estates; underperforming low-density new towns - with the rare exception of the success of Milton Keynes. Traffic congestion, air-pollution and environmental degradation. Cities pose risks when they are planned badly.
And perhaps most physically, we no longer seem to build streets. Instead we build highways between housing estates - and within the housing estates the houses are located higgledy piggledy.
And this is where the science comes in. The government's Chief Scientific Advisor, Sir Mark Walport, is leading a project to look at the future of the UK cities over the next 25 to 50 years. I am a member of the group of eight advisors which is helping him and his colleagues prepare a report - in fact a series of reports which we have been publishing over the last two years - and will lead to a major final publication in the near future.
Among our concerns has been a lack of scientific rigour in the planning of future places. We have also identified relatively low levels of spatial literacy amongst policymakers at a national and local level. It seems many of the lessons of the Romans have been forgotten: how to mix uses, and create street-based places that work as parts of systems of cities.
But we have also identified the need to think boldly and often radically – to be imaginative. This has come as something of a challenge to people that we have met and as an amazing opportunity to many others.
We have convened meetings where we have brought urban policy makers together in rooms not to dissimilar to this - to think not just about the next 5 to 10 years but about the next 25 to 50. This is taking people out of their typical mindsets and allowed them the freedom to be imaginative.
At the same time, we have identified the need to bring professional disciplines together and for government departments, both national and local, to work with each other.
On the face of it this may sound simple and obvious – to integrate transport planning and town planning with economic planning.
In practice, as many of you know, this is harder to make happen. What has worked extremely well is when people have been able to meet not just once but regular and, when they do, to first identify a vision for the future: to describe or draw scenarios that they would like to achieve. Then to design the policies that will enable such a vision. And, at the same time, to create scenarios they would not like the future to look like so that policies that might produce these negative outcomes can be avoided.
A key, largely missing, next step is to run analytics to forecast the impacts of proposed changes. Now, fortunately, this is my business: my company, Space Syntax, forecasts the effects of new land uses, and new road and rail connections, on human behaviour patterns and then on the social and economic outcomes of those behaviours: the effects on land values, social interaction, crime risk and health outcomes.
We use computer models to do so. These have been developed over many years now and at the heart of them are spatial inputs: land use locations and road/rail connections. We have identified the science behind the everyday commonsense activities of real people. [Sadly, common sense that has largely been forgotten in modern town planning.]
Here is a model of the UK system of cities where the colours, from hot to cold, indicate the density of the street network. What we have found is that the pattern of connectivity correlates with movement patterns inside as well as between urban settlements, with employment density numbers and crime patterns. What we found is that the spatial layout itself influences a very large part of these outcomes.
This image shows two different versions of a masterplan for the same site: the only difference between the masterplans comes down to the location and number of street connections, yet if we look at the relationship between connectivity and lifetime land value, we can identify half a billion US dollars difference in the lifetime value of these masterplans. These are the kinds of values that are being made or lost when decisions on connectivity are being taken.
And it is not just about the connections themselves– it is also the character and quality of connections: how buildings along those connections either face towards your face away from them; whether there is a high quality landscape; cycle routes and pedestrian crossings. Compare the Champs Élysées in Paris, where citywide land values are the highest on the main boulevards, with the road to Medina in Jeddah, where they are the lowest.
Using these modelling techniques in practice it has been possible, as here in Darwin, Australia, to work with the Lord Mayr and her team of advisors, to create a plan that doubles the size of the city centre in a way that will create new, street-based urbanism with enhanced land values.
Working with the Government Office for Science, Space Syntax has looked speculatively at new rail scenarios for the UK. In each case, we have been measuring how different connections create different levels of access to opportunities. On this side of a basis, policy can be formed. How do we create the right connections to build a Northern Powerhouse, or an Eastern Powerhouse? Or both? Which connections might come first? These are questions that can be addressed through modelling.
In preparation for today’s event, I looked with my Space Syntax colleagues at Office for National Statistics projections of housing growth and employment growth across the UK. If we look at the East of England region, we see housing growth in large numbers being projected for Norwich and Ipswich - the green dots. At the same time we see employment numbers growing significantly in Peterborough and Cambridge - the red dots. Now I look at these and think you can either try to buck the trend and change the forecast numbers or you can try to work with them. If so, what could that mean?
I think it could mean providing connections - better connections - between where people will live in the future and where they will work. It could mean Norfolk and Ipswich focusing housing growth westwards, in two “beams” of development that focus on Peterborough and Cambridge.
That would then mean looking at road and rail between the spaces.
Our initial analysis of the region - from a position that is so far largely ignorant of the detail of what has been going on in this region in recent years (so please forgive me) - is that the rail line between Norwich and Cambridge is a hugely underused resource. From what we have learnt, this connection - and perhaps others - has significant potential to grow.
But when we then went looking for proposals to locate new housing and new jobs along the Norwich-Cambridge line, we could not find it - at least not in the numbers that the potential would suggest.
What we might instead expect to find is the redevelopment of the agricultural stops along the line into new villages or small towns, combining housing and shopping as well as local working; allowing people to take the train into Cambridge to work during the week and into Norwich to take leisure at the weekend.
This is one idea that I would like to explore with you today and clearly it is not the only idea. I look forward to hearing other ideas, especially those that focus on the creation of effective places for human transaction.
And, if I may suggest one further step, it will be to consider these ideas regularly into the future: to think boldly and to work together; to evolve a plan for the future of Norfolk as part of a system of cities, towns and villages across the East of England, grow sustainably by better connecting both within itself as well as with its regional setting.
Thank you.