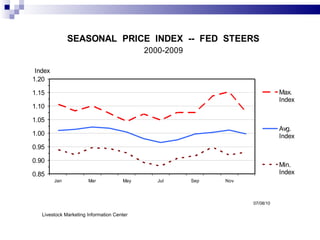
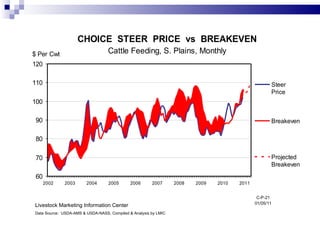
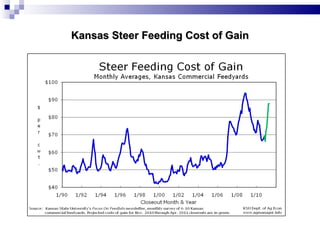
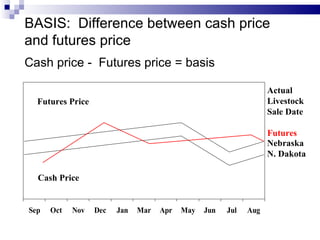
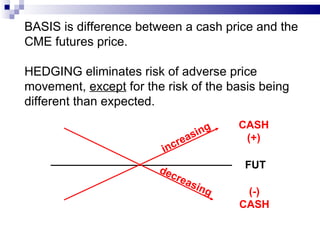
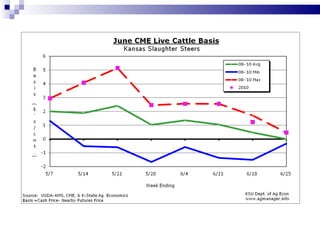
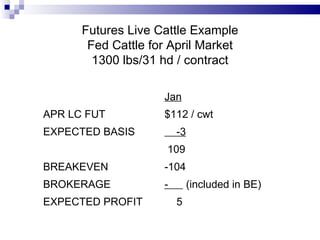
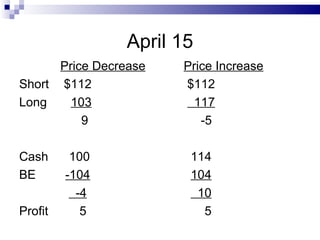
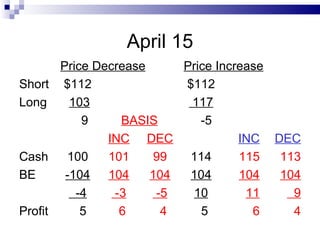
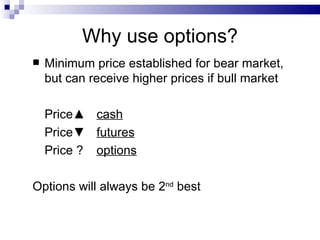
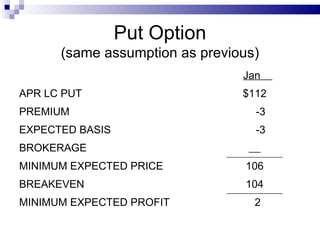
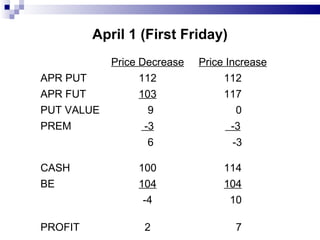
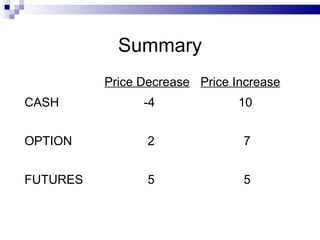
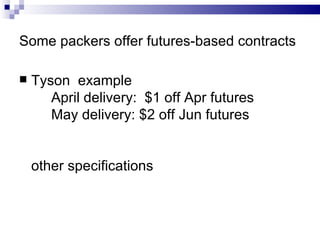
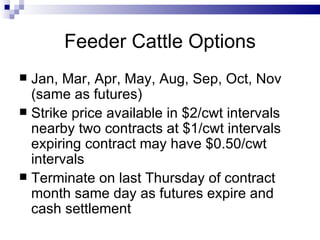
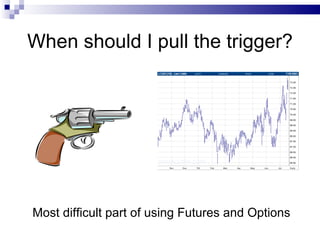
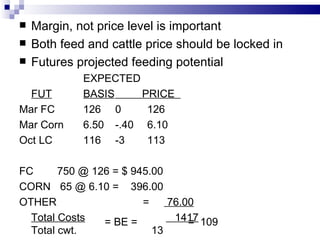
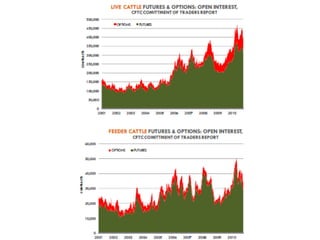
SlideShare a Scribd company logo
1 of 29
Futures and Options Live Cattle Feeder Cattle Tim Petry Livestock Marketing Economist NDSU Extension Service 1-28-11 FutOpt-Carrington-Jan2011.ppt
 
Live Cattle Contract ,[object Object],[object Object],[object Object],[object Object],[object Object],[object Object]
Live Cattle – April 2011
Livestock Marketing Information Center
Livestock Marketing Information Center Data Source:  USDA-AMS & USDA-NASS, Compiled & Analysis by LMIC
Breakeven Prices for 1300 lb Fed Steers 750 to 1300 lb ADG = 3.5 lbs 157 Days on Feed Feeder Price ($/cwt) Total Cost of Gain (¢/lb) 75 80 85 90 95 100 110 96.19 98.31 100.42 102.54 104.65 106.77 115 99.08 101.20 103.31 105.43 107.54 109.66 120 101.96 104.08 106.19 108.31 110.42 112.54 125 104.85 106.97 109.08 111.20 113.31 115.43 130 107.73 109.85 111.96 114.08 116.19 118.31 135 110.62 112.74 114.85 116.97 119.08 121.20
    Kansas Steer Feeding Cost of Gain
BASIS:  Difference between cash price and futures price Cash price -  Futures price = basis Futures Price Cash Price Actual Livestock Sale Date Futures Nebraska N. Dakota
BASIS is difference between a cash price and the CME futures price. HEDGING eliminates risk of adverse price movement,  except  for the risk of the basis being different than expected.  increasing decreasing CASH (+) FUT (-) CASH
 
Futures Live Cattle Example Fed Cattle for April Market 1300 lbs/31 hd / contract Jan APR LC FUT $112 / cwt EXPECTED BASIS -3 109 BREAKEVEN -104 BROKERAGE -  (included in BE) EXPECTED PROFIT 5
April 15 Price Decrease Price Increase Short $112 $112 Long 103 117 9 -5 Cash 100 114 BE -104 104 -4 10 Profit 5 5
April 15 Price Decrease Price Increase Short $112 $112 Long 103 117 9 BASIS -5 INC DEC INC DEC Cash 100 101 99 114 115 113 BE -104 104 104 104 104 104 -4 -3 -5 10 11 9 Profit 5 6 4 5 6 4
Options ,[object Object],[object Object],[object Object],[object Object],[object Object]
Live Cattle Options ,[object Object],[object Object],[object Object]
Why use options? ,[object Object],[object Object],[object Object],[object Object],[object Object]
Put Option (same assumption as previous) Jan  APR LC PUT $112 PREMIUM -3 EXPECTED BASIS -3 BROKERAGE MINIMUM EXPECTED PRICE 106 BREAKEVEN 104 MINIMUM EXPECTED PROFIT 2
April 1 (First Friday) Price Decrease Price Increase APR PUT 112 112 APR FUT 103 117 PUT VALUE 9 0 PREM -3 -3 6 -3 CASH 100 114 BE 104 104 -4 10 PROFIT 2 7
Summary Price Decrease Price Increase CASH -4 10 OPTION 2 7 FUTURES 5 5
Some packers offer futures-based contracts ,[object Object]
Feeder Cattle Contract ,[object Object],[object Object],[object Object],[object Object],[object Object],[object Object]
Livestock Marketing Information Center
Feeder Cattle – March 2011
Feeder Cattle – April 2009
Feeder Cattle Options ,[object Object],[object Object],[object Object]
When should I pull the trigger? Most difficult part of using Futures and Options
[object Object],[object Object],[object Object],[object Object],[object Object],[object Object],[object Object],[object Object],[object Object],[object Object],[object Object],[object Object],[object Object],= BE =  =  109
 

More Related Content

More from NDSUExt

2011 Cattle Situation and Outlook
2011 Cattle Situation and Outlook2011 Cattle Situation and Outlook
2011 Cattle Situation and OutlookNDSUExt
 
Optimizing Nutrient Management and Delivery
Optimizing Nutrient Management and DeliveryOptimizing Nutrient Management and Delivery
Optimizing Nutrient Management and DeliveryNDSUExt
 
Custom Feeding or Cattle Feeders
Custom Feeding or Cattle FeedersCustom Feeding or Cattle Feeders
Custom Feeding or Cattle FeedersNDSUExt
 
Feeds, Nutrients and Animal Requirements
Feeds, Nutrients and Animal RequirementsFeeds, Nutrients and Animal Requirements
Feeds, Nutrients and Animal RequirementsNDSUExt
 
The Relationship Between Carcass Quality and Value
The Relationship Between Carcass Quality and ValueThe Relationship Between Carcass Quality and Value
The Relationship Between Carcass Quality and ValueNDSUExt
 
Feed Additives and Implant Strategies
Feed Additives and Implant StrategiesFeed Additives and Implant Strategies
Feed Additives and Implant StrategiesNDSUExt
 
Soil Health – Cover Crops – Relay Cropping
Soil Health – Cover Crops – Relay CroppingSoil Health – Cover Crops – Relay Cropping
Soil Health – Cover Crops – Relay CroppingNDSUExt
 
Do We Want to Feed Cattle?
Do We Want to Feed Cattle?Do We Want to Feed Cattle?
Do We Want to Feed Cattle?NDSUExt
 

More from NDSUExt (8)

2011 Cattle Situation and Outlook
2011 Cattle Situation and Outlook2011 Cattle Situation and Outlook
2011 Cattle Situation and Outlook
 
Optimizing Nutrient Management and Delivery
Optimizing Nutrient Management and DeliveryOptimizing Nutrient Management and Delivery
Optimizing Nutrient Management and Delivery
 
Custom Feeding or Cattle Feeders
Custom Feeding or Cattle FeedersCustom Feeding or Cattle Feeders
Custom Feeding or Cattle Feeders
 
Feeds, Nutrients and Animal Requirements
Feeds, Nutrients and Animal RequirementsFeeds, Nutrients and Animal Requirements
Feeds, Nutrients and Animal Requirements
 
The Relationship Between Carcass Quality and Value
The Relationship Between Carcass Quality and ValueThe Relationship Between Carcass Quality and Value
The Relationship Between Carcass Quality and Value
 
Feed Additives and Implant Strategies
Feed Additives and Implant StrategiesFeed Additives and Implant Strategies
Feed Additives and Implant Strategies
 
Soil Health – Cover Crops – Relay Cropping
Soil Health – Cover Crops – Relay CroppingSoil Health – Cover Crops – Relay Cropping
Soil Health – Cover Crops – Relay Cropping
 
Do We Want to Feed Cattle?
Do We Want to Feed Cattle?Do We Want to Feed Cattle?
Do We Want to Feed Cattle?
 

2011 Futures and Options - Live Cattle, Feeder Cattle

  • 1. Futures and Options Live Cattle Feeder Cattle Tim Petry Livestock Marketing Economist NDSU Extension Service 1-28-11 FutOpt-Carrington-Jan2011.ppt
  • 2.  
  • 3.
  • 4. Live Cattle – April 2011
  • 6. Livestock Marketing Information Center Data Source: USDA-AMS & USDA-NASS, Compiled & Analysis by LMIC
  • 7. Breakeven Prices for 1300 lb Fed Steers 750 to 1300 lb ADG = 3.5 lbs 157 Days on Feed Feeder Price ($/cwt) Total Cost of Gain (¢/lb) 75 80 85 90 95 100 110 96.19 98.31 100.42 102.54 104.65 106.77 115 99.08 101.20 103.31 105.43 107.54 109.66 120 101.96 104.08 106.19 108.31 110.42 112.54 125 104.85 106.97 109.08 111.20 113.31 115.43 130 107.73 109.85 111.96 114.08 116.19 118.31 135 110.62 112.74 114.85 116.97 119.08 121.20
  • 9. BASIS: Difference between cash price and futures price Cash price - Futures price = basis Futures Price Cash Price Actual Livestock Sale Date Futures Nebraska N. Dakota
  • 10. BASIS is difference between a cash price and the CME futures price. HEDGING eliminates risk of adverse price movement, except for the risk of the basis being different than expected. increasing decreasing CASH (+) FUT (-) CASH
  • 11.  
  • 12. Futures Live Cattle Example Fed Cattle for April Market 1300 lbs/31 hd / contract Jan APR LC FUT $112 / cwt EXPECTED BASIS -3 109 BREAKEVEN -104 BROKERAGE - (included in BE) EXPECTED PROFIT 5
  • 13. April 15 Price Decrease Price Increase Short $112 $112 Long 103 117 9 -5 Cash 100 114 BE -104 104 -4 10 Profit 5 5
  • 14. April 15 Price Decrease Price Increase Short $112 $112 Long 103 117 9 BASIS -5 INC DEC INC DEC Cash 100 101 99 114 115 113 BE -104 104 104 104 104 104 -4 -3 -5 10 11 9 Profit 5 6 4 5 6 4
  • 15.
  • 16.
  • 17.
  • 18. Put Option (same assumption as previous) Jan APR LC PUT $112 PREMIUM -3 EXPECTED BASIS -3 BROKERAGE MINIMUM EXPECTED PRICE 106 BREAKEVEN 104 MINIMUM EXPECTED PROFIT 2
  • 19. April 1 (First Friday) Price Decrease Price Increase APR PUT 112 112 APR FUT 103 117 PUT VALUE 9 0 PREM -3 -3 6 -3 CASH 100 114 BE 104 104 -4 10 PROFIT 2 7
  • 20. Summary Price Decrease Price Increase CASH -4 10 OPTION 2 7 FUTURES 5 5
  • 21.
  • 22.
  • 24. Feeder Cattle – March 2011
  • 25. Feeder Cattle – April 2009
  • 26.
  • 27. When should I pull the trigger? Most difficult part of using Futures and Options
  • 28.
  • 29.