Download to read offline


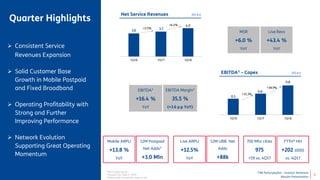
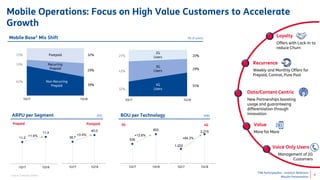
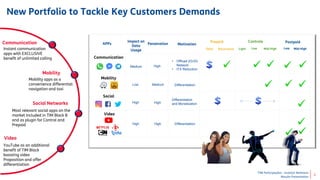

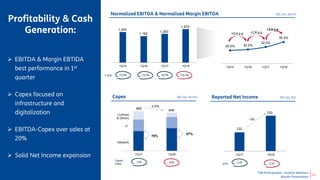
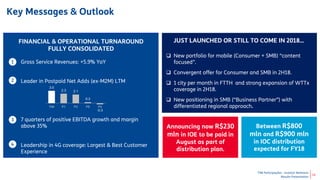

This presentation provides an overview of TIM Participações' financial and operational results for the first quarter of 2018. Key highlights include consistent growth in service revenues of 3.5% year-over-year and a 16.4% increase in EBITDA. The company achieved solid customer base growth in mobile postpaid and fixed broadband subscribers. Ongoing network evolution supported strong operating momentum, with the largest 4G coverage in Brazil and improvements in customer experience. TIM Participações maintained focus on high value customers and cost control to further improve profitability and cash generation.


