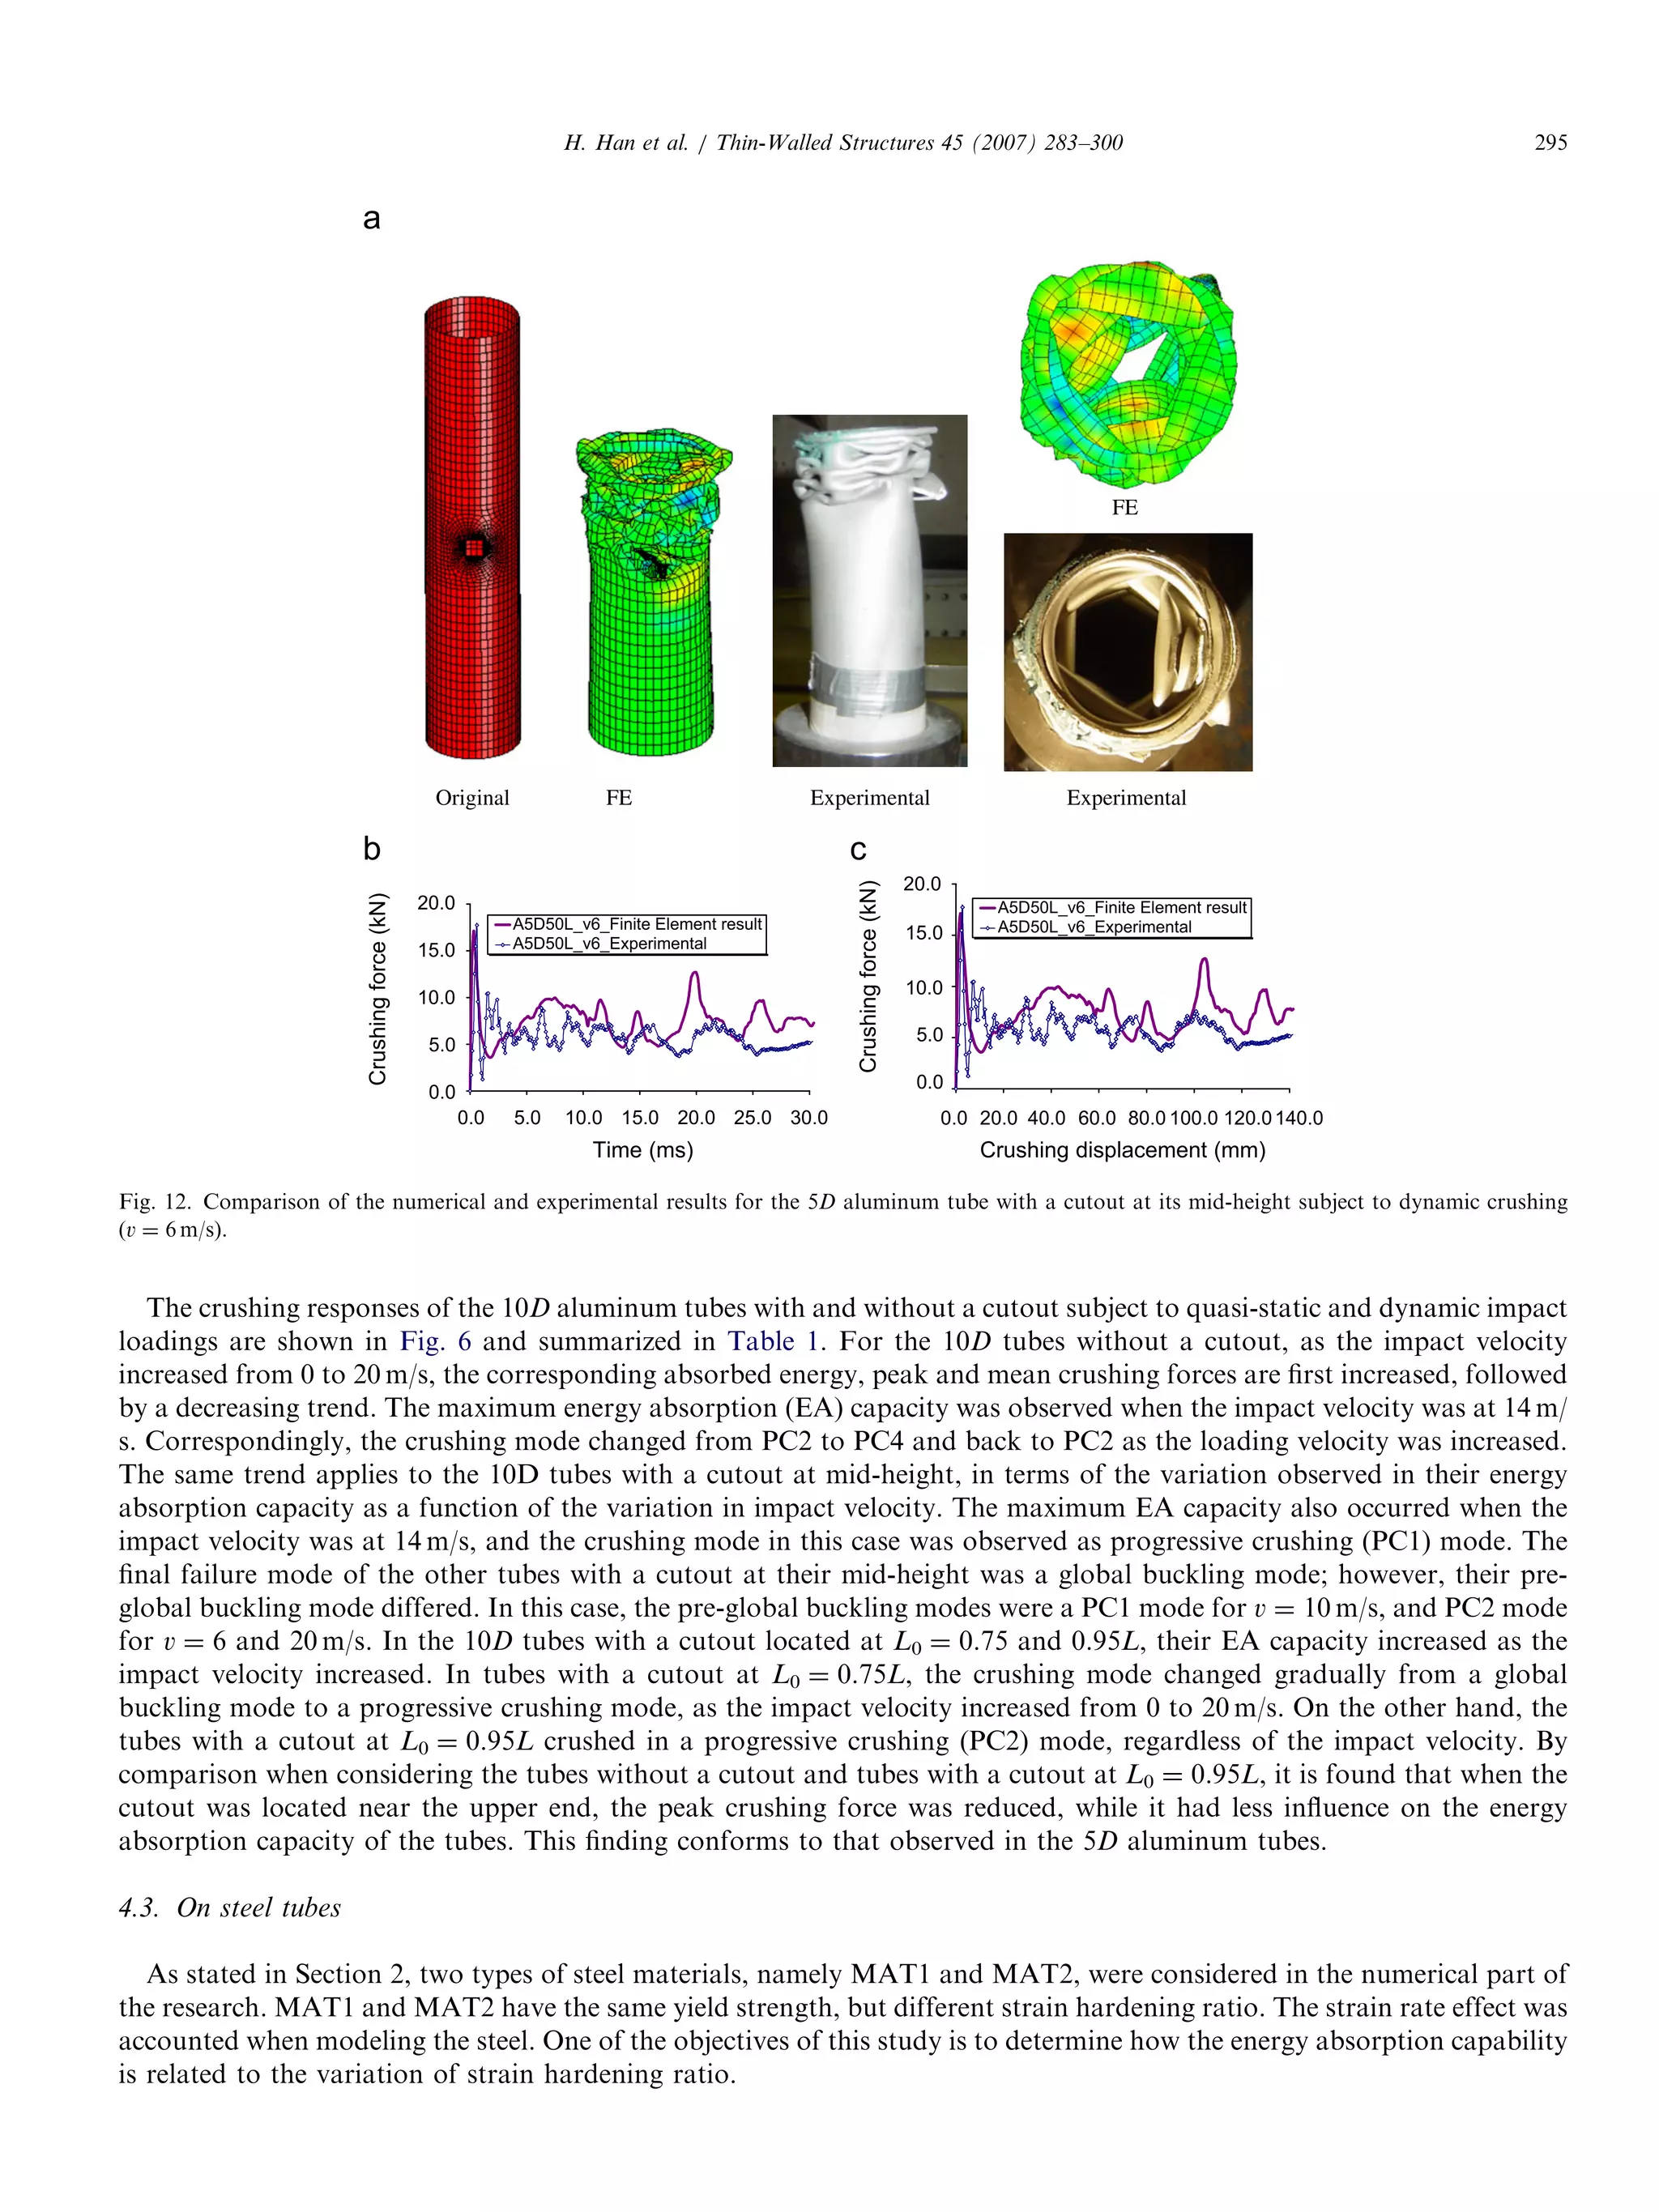
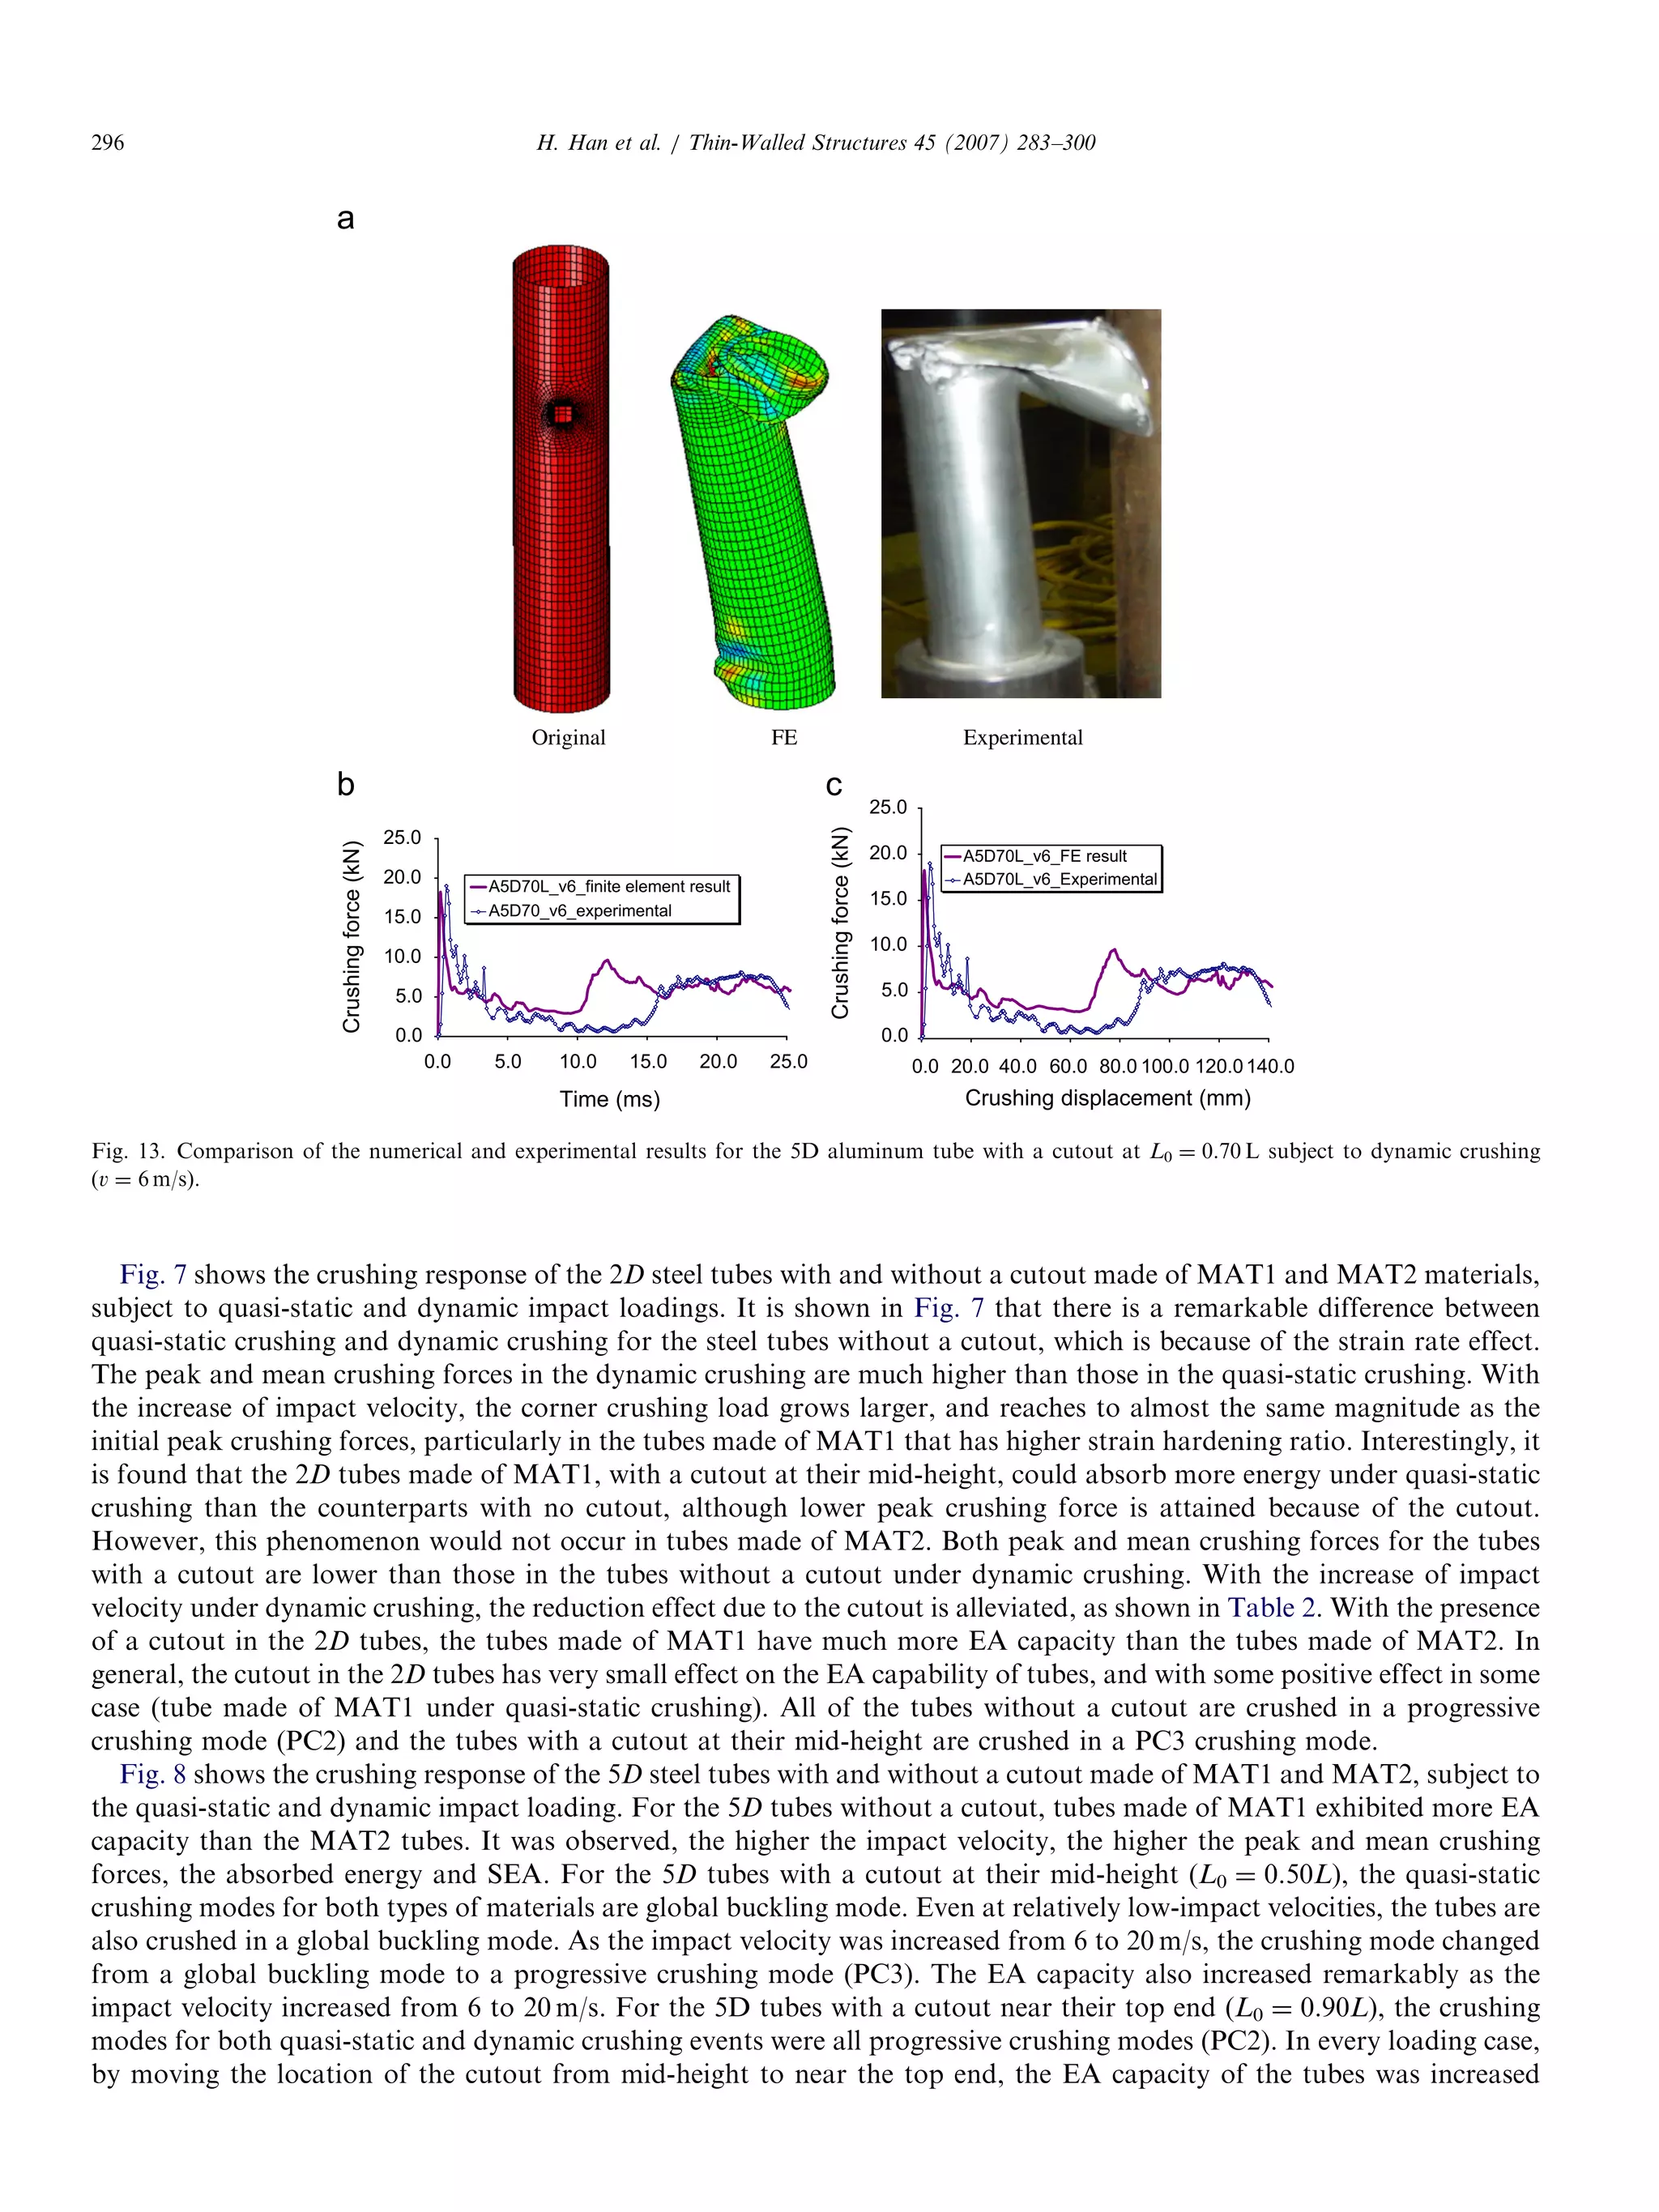
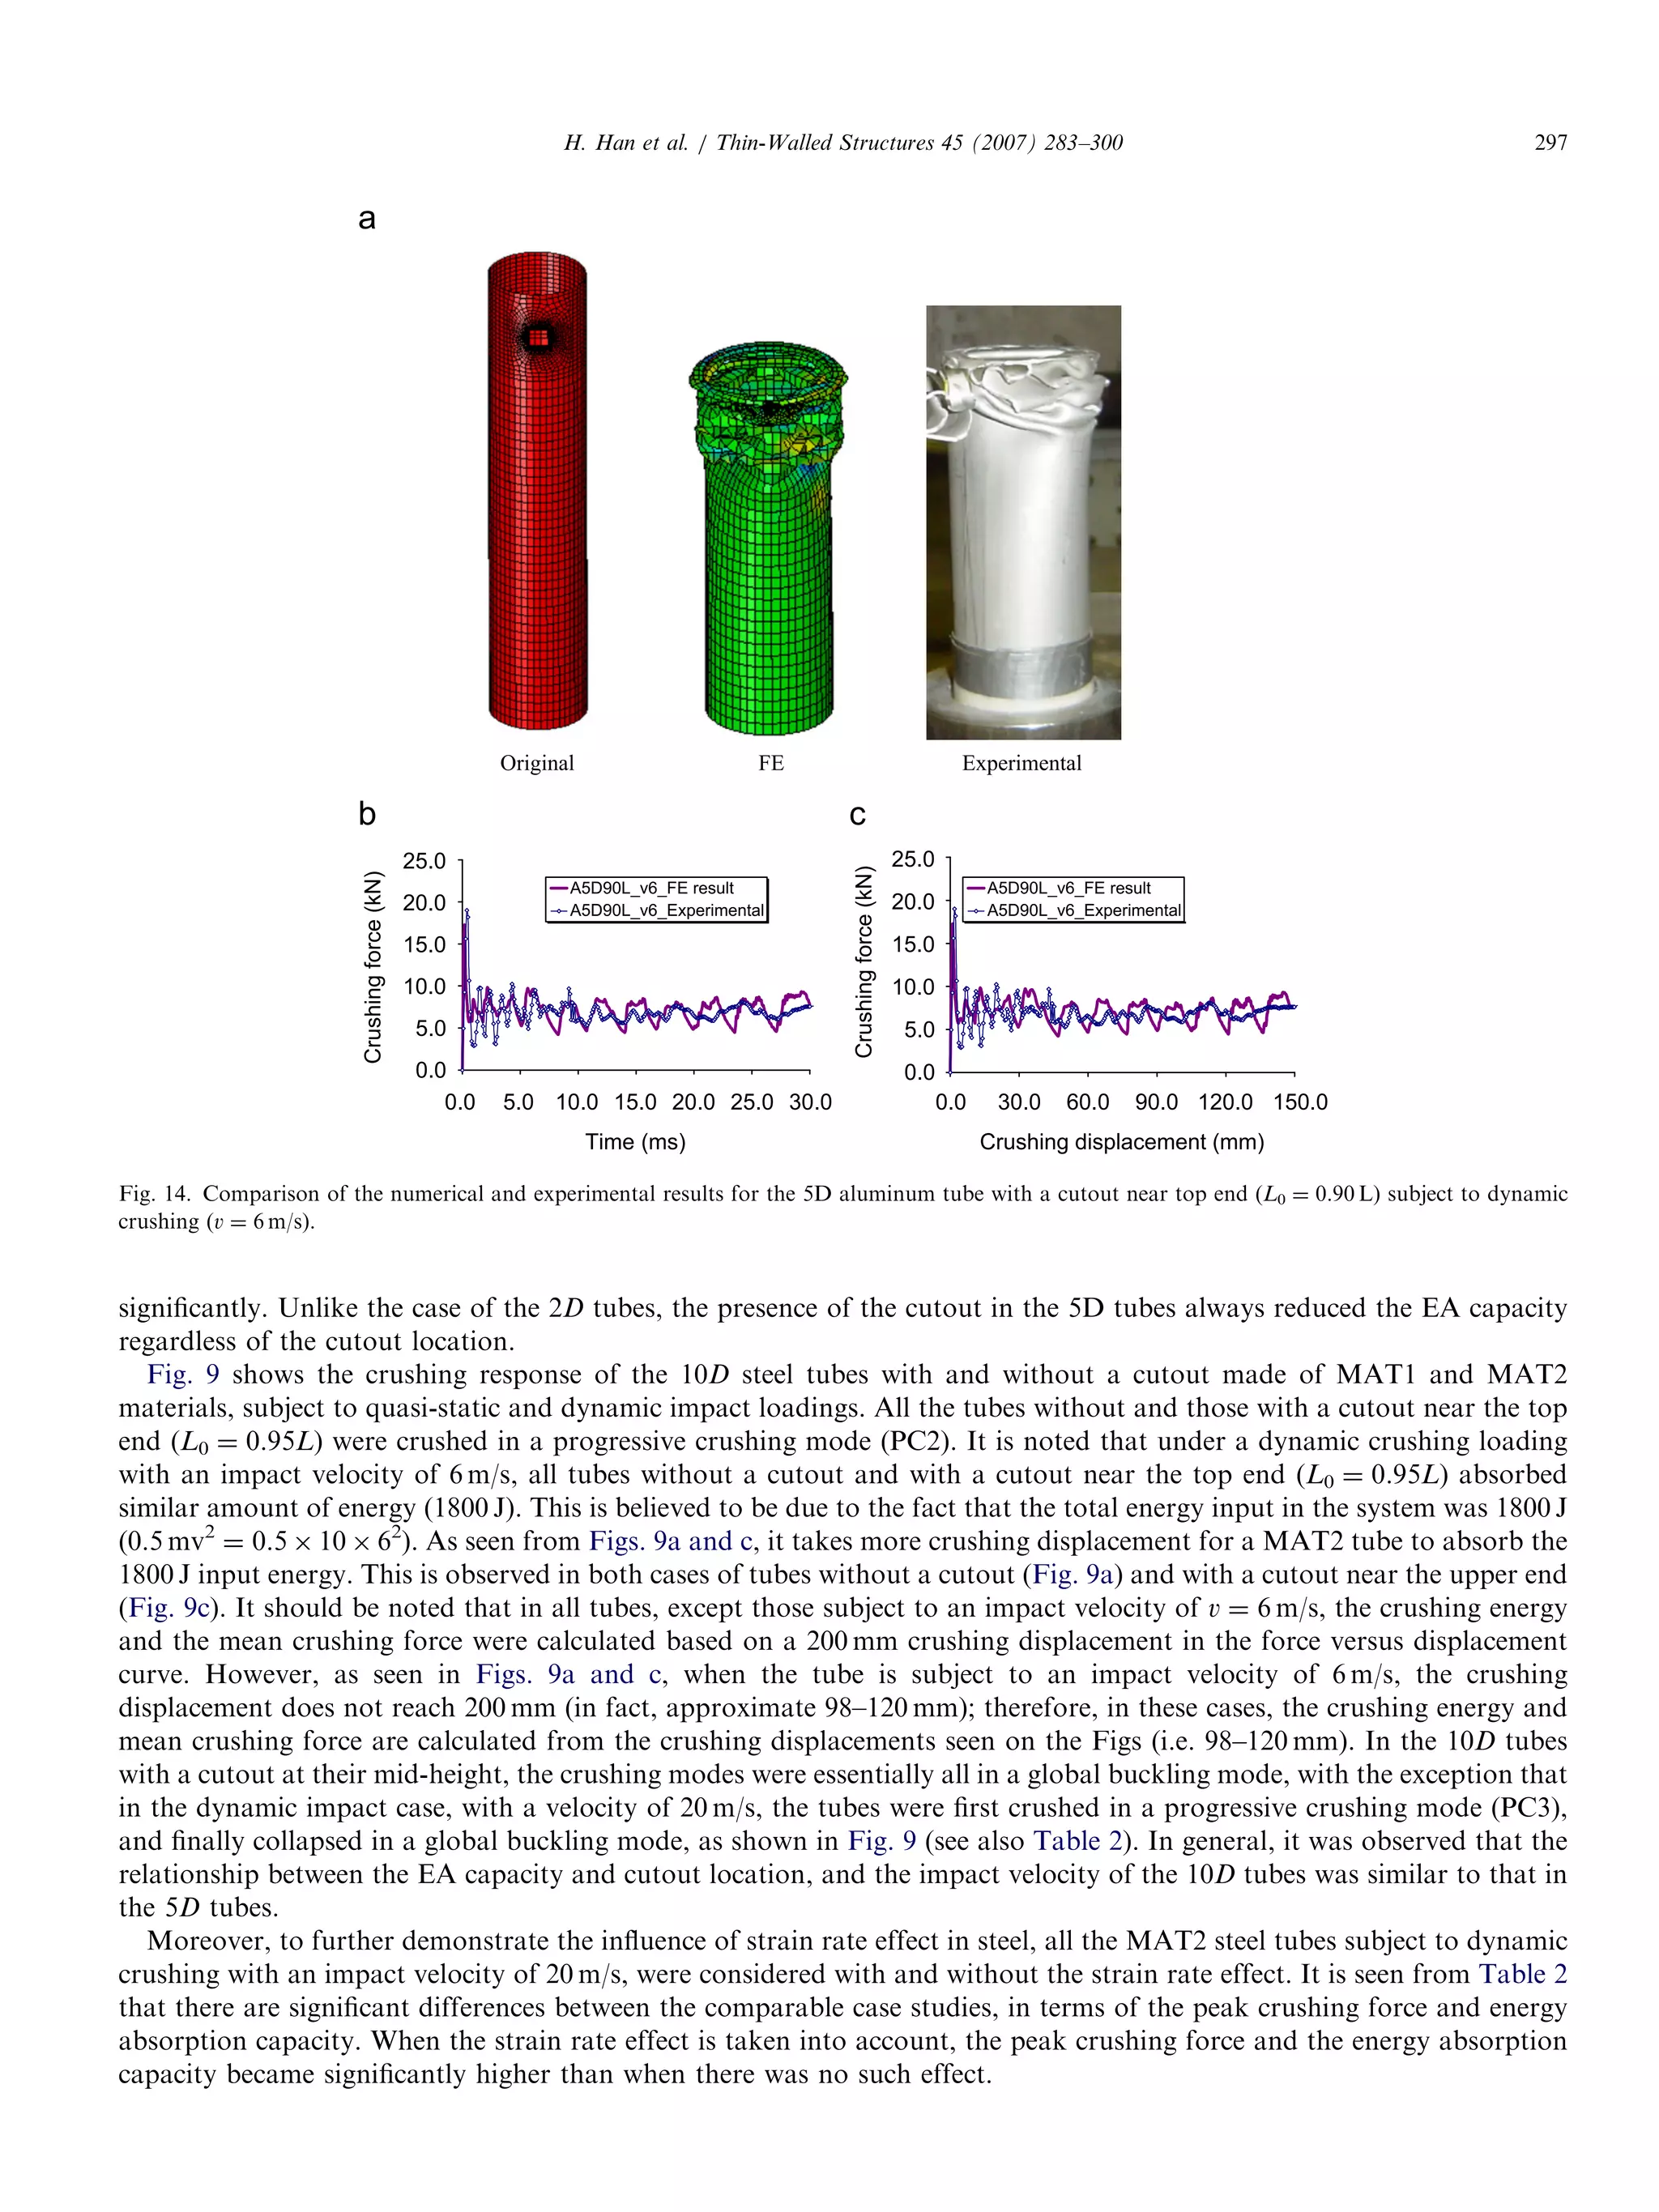
This document summarizes research on the crushing behavior of aluminum and steel tubes with a cutout. A numerical model was developed using LS-DYNA software to simulate the quasi-static and dynamic crushing of tubes. Experiments were also conducted to validate the numerical model. The effects of parameters like material properties, strain rate, cutout location, tube length and impact speed on energy absorption were evaluated. Empirical equations were developed to describe the mean and peak crushing forces based on the numerical and experimental results.
![Thin-Walled Structures 45 (2007) 283–300
Quasi-static and dynamic crushing behaviors of aluminum and
steel tubes with a cutout
Haipeng Hana
, Farid Taheria,Ã, Neil Peggb
a
Department of Civil Engineering, Dalhousie University, 1360 Barrington Street, Halifax, NS, Canada B3J 2Z1
b
Defense Research and Development Canada Atlantic, 9 Grove Street, Dartmouth, NS, Canada B2Y 3Z7
Received 8 June 2006; received in revised form 12 February 2007; accepted 23 February 2007
Available online 27 April 2007
Abstract
Tubular members are commonly used as an energy absorber in engineering structures and many such members have a cutout. In this
study, the crushing behaviors of tubes with a cutout are characterized and the effects of cutout on the energy absorption capabilities of
these tubes are quantified. Systematic parametric studies were carried out to study the effect of material properties, including yield and
ultimate strength of material, strain rate effect, location of cutout, tube length and impact speed on the crushing behaviors and energy
absorption capacity of aluminum and steel tubes. First, a numerical model was constructed with a commercial explicit finite element
code. It will be first proven that the numerical simulation can produce sufficiently accurate results in an economic manner. Subsequently,
the crushing behavior of aluminum and steel tubes with a cutout was experimentally characterized and their energy absorption capacity
was evaluated in terms of mean crushing force, peak crushing force and specific energy absorption (SEA). Tubes of various lengths with a
cutout located at different locations, subject to both quasi-static and dynamic impact loadings were considered. For steel tubes, the
numerical simulation investigated the influence of the strain rate effect and variation in strain hardening ratio of the material. Empirical
equations describing the mean and peak crushing forces of aluminum and steel tubes with a cutout were developed using linear and
nonlinear regression methods applied to the results obtained from the numerical and experimental studies.
r 2007 Published by Elsevier Ltd.
Keywords: Energy absorption; Tubes; Cutout; Finite element; Strain rate; Empirical equation
1. Introduction
An energy absorber is a system that converts, totally or partially, an applied kinetic energy into another form of energy.
Energy dissipated in the form of plastic deformation in metallic energy absorbers is irreversible. Generally, the objective of
an energy absorber is to dissipate the energy that is applied to the structure, so that the contents or occupants of the
structure are protected. An intensive review on the types and behaviors of collapsible impact energy absorbers can be found
in Ref. [1].
Tubular sections are commonly used in engineering structures, such as in fuselages and landing gears in aircrafts, in
pipelines and oil/gas risers in offshore oil fields, and in the chassis of automobiles. These structures commonly include some
geometric discontinuities, such as attachments of stiffeners and cutouts. Impact events are generated by many means, such
as traffic accidents, natural collisions, and earthquakes. Therefore, understanding the crushing behaviors of tubular
structures has been the subject of several scholarly works [2–8].
It was shown in previous studies that perfect tubes could be crushed in several modes, such as the concertina
(axisymmetric) mode and diamond (unaxisymmetric) collapse mode. Research has also been done to study the crushing
behaviors of tubes made of materials with and without strain hardening and strain rate effects. Previous work has
ARTICLE IN PRESS
www.elsevier.com/locate/tws
0263-8231/$ - see front matter r 2007 Published by Elsevier Ltd.
doi:10.1016/j.tws.2007.02.010
ÃCorresponding author. Tel.: +1 902 494 3935; fax: +1 902 484 6635.
E-mail address: farid.taheri@dal.ca (F. Taheri).](https://image.slidesharecdn.com/8d54768f-61d4-4a6d-9de4-79237b500a49-160729011733/75/Thin-Walled-Structures-45-p283-300-1-2048.jpg)
![investigated energy absorbers with the shapes of tubes, frusta, multi-cornered columns, struts, sandwich plates, honeycomb
cells and other shapes including single-hat and double-hat thin-walled sections [2–12].
It was found that among various cross sections, circular tubes provide the best energy absorption capacity under axial
compression [2]. For the quasi-static crushing of circular tubes, Alexander [3] constructed a theoretical model and
concluded that the mean crushing force of a circular tube can be evaluated as
Pm ¼ 2ðptÞ3=2
R1=2
s03Àð1=4Þ
, (1)
where t and R are the thickness and radius of the tube and s0 is the yield strength of the material. Magee and Thornton [4]
developed an empirical equation to predict the mean crushing force Pm for a general hollow section member based on a
large number of axial crushing experiments of different cross section, represented by
Pm ¼ Z1sujAO, (2)
where Z1 is called the structural effectiveness of the section, j is the ratio of the material volume to the volume enclosed by
the section, su is the ultimate strength of the material and AO is the overall area of the section defined by its outer
circumference. For a hollow cylindrical section of radius R and wall thickness t, Z1 ¼ 2j0:7
and j ¼ 2t=R, and Eq. (2)
becomes
Pm ¼ 4pRtsu
2t
R
0:7
. (3)
Equation (3) can be used to accurately predict the mean crushing force in the case of quasi-static crushing of metallic
circular-sectioned tubes.
In dynamic crushing involving an intermediate velocity impact, the influence of material strain rate sensitivity must be
considered for most materials. Joans [13] replaced the yield strength (s0) in Eq. (1) with the dynamic flow stress s0
0 (Eq. (4))
s0
0 ¼ s0 1 þ
_
D
1=q
!
, (4)
and concluded that the mean crushing force of the tubes subject to dynamic crushing can be expressed as
Pm ¼ 2ðptÞ3=2
R1=2
s0 1 þ
V0
4RD
1=q
#
3Àð1=4Þ
. (5)
In Eqs. (4)–(5) _ is the uniaxial plastic strain rate, t and R are the thickness and radius of the tube, D and q are constants
for a particular material and V0 is the velocity of impact loading.
The forms and amplitudes of geometric imperfections and their effects on the crushing behavior have been widely
studied for tubular structures. However, the tubes with a cutout have received minimal attention. Kormi et al. [14]
numerically investigated the crushing behavior of steel cylindrical shells with a large cutout. Three different loading
conditions, including axial compressive load, axial torsion load and bending moment, were considered in their study. The
static nonlinear approach, including the linear isotropic work hardening characteristics of the material, was adopted in
their work. The geometry of the shell was D  t  L ¼ 150 mm  1 mm  610 mm. The size of the opening was about
200 mm  100 mm. The deformation under each load case was characterized. Sahu [15,16] investigated the dynamic
stability of curved isotropic and composite panels having a cutout subject to periodic loading. From his studies, it was
concluded that the instability behavior of laminated curved panels with geometric discontinuity was greatly influenced by
the size of the cutout, geometry of the panel, ply lay-up orientation and boundary conditions. To the best of the authors’
knowledge, there has been no systematic study on the crushing behavior and energy absorption capacity of tubes with a
cutout. In such scenarios, understanding of the effect of a cutout located along various locations on the tubes of different
lengths is very valuable for the design of an energy absorber of this type.
In this study, the response of tubes of various length/radius ratios with a cutout situated at different locations along the
length is investigated numerically and experimentally. The behaviors of the tubes are characterized and effects of the cutout
on the energy absorption capabilities of tubes are quantified. The general procedure of numerical analysis using LS-DYNA
is first introduced. Then an experimental program is developed to experimentally characterize and verify several of the
cases considered in the numerical studies. It will be shown that the results from the numerical study are sufficiently accurate
in comparison to the corresponding experimental verifications. Empirical equations describing the mean crushing force and
the peak crushing initiation force of the tubes with and without a cutout are developed using linear and nonlinear
regression methods applied to the results obtained from the parametric numerical study.
ARTICLE IN PRESS
H. Han et al. / Thin-Walled Structures 45 (2007) 283–300284](https://image.slidesharecdn.com/8d54768f-61d4-4a6d-9de4-79237b500a49-160729011733/75/Thin-Walled-Structures-45-p283-300-2-2048.jpg)
![2. Numerical analysis using the finite element method
The aluminum and steel tubes selected are typical laboratory-scale sizes, with a 40 mm outside diameter and wall
thickness (t) of 0.889 mm, as shown in Fig. 1. A square cutout of 7.5 mm  7.5 mm was created at various locations along
the length of the tubes. The distance between the centers of the cutout to the bottom end of the tube is denoted as L0. The
variation of L0 ( ¼ 0.50À0.95L) was considered. To alleviate the excessive stress concentration around the cutout, corner
chamfers of 0.5 mm radius were introduced around the cutout. As stated in [17], only a few works have investigated the
influence of a cutout on the intermediate length or slender cylindrical shells when subjected to either static or dynamic axial
compression loading. In this paper, short (L ¼ 2D ¼ 80 mm), intermediate length (L ¼ 5D ¼ 200 mm) and long
(L ¼ 10D ¼ 400 mm) tubes with and without a cutout, subject to both quasi-static and dynamic axial impact loading
conditions are investigated.
The commercially available code, LS-DYNA, was used for the numerical simulation. Material model 24 of LS-DYNA
(MAT_PIECEWIRE-LINEAR- PLASTICITY) [18], was selected to model both the aluminum and steel tubes. The
material models are schematically shown in Fig. 2. The aluminum tubes are made of 6061-T6 aluminum alloys with the
sheet rolling direction in the circumferential direction. The engineering stress–strain curves were determined using six dog-
bone tensile specimens machined from the walls of the extruded tubes according to ASTM B557 standard. Based on the
experimental results, a multi-linear isotropic hardening constitutive model was constructed to represent the uniaxial
stress–strain behavior of the aluminum material, using the von-Mises flow rule as the yield criterion. Two types of material
models, namely MAT1 and MAT2, were chosen to represent the steel in the numerical simulation. These models represent
two type of strain hardening ratios, which is defined as the ratio of ultimate strength to the yield strength of the steel
materials. MAT1 and MAT2 have the same value of yield strength (s0 ¼ 275 MPa). However, MAT1 is high-strength low-
ARTICLE IN PRESS
Fig. 1. FEM model of the aluminum and steel tubes.
0.0
50.0
100.0
150.0
200.0
250.0
0
Stress(MPa)
Aluminum
Plastic strain
(mm/mm)
Stress
(MPa)
0 170.0
0.01668 184.0
0.0208 187.0
0.041 199.0
0.0607 205.0
0.0806 207.0
0.0
100.0
200.0
300.0
400.0
500.0
0 0.2
Stress(MPa)
MAT1 (strain hardening ratio=1.65)
MAT2 (strain hardening ratio=1.32)
Plastic strain
0.02 0.04 0.06 0.08 0.1
Plastic strain
0.05 0.1 0.15 0.25
Fig. 2. Material models of the aluminum and steel tubes.
H. Han et al. / Thin-Walled Structures 45 (2007) 283–300 285](https://image.slidesharecdn.com/8d54768f-61d4-4a6d-9de4-79237b500a49-160729011733/75/Thin-Walled-Structures-45-p283-300-3-2048.jpg)
![alloyed steel, with relatively high-strain hardening ratio (su/s0 ¼ 1.65), while MAT2 is mild steel, with relatively low-strain
hardening ratio (su/s0 ¼ 1.32). Aluminum has been found to be less strain rate sensitive [13], therefore, the strain rate effect
is not considered for the aluminum tube. For both MAT1 and MAT2, the parameters that describe the strain rate effect of
the material in Eq. (4) is taken as D ¼ 40.4 and q ¼ 5 [13].
Belyschko–Tsay quadrilateral shell elements [18] were used to model the wall of both aluminum and steel tubes. The
meshed shell elements were located at the mid-plane of the tube’s wall.
In the modeling of quasi-static crushing, the bottom end of the tube was assumed to be built-in and was constrained in
all degrees of freedom. The upper end was free and subject to compression by the rigid loading plate. The loading plate was
modeled as a rigid wall and its mass was assumed to be 100 kg. In the simulation of a quasi-static crushing event, the mass
of both loading plate and tube can be scaled up to a certain limit for the purpose of computation saving, while still
maintaining the quasi-static condition [19,20]. In this study, the density of the loading plate and tube were all scaled up by a
factor of 1000. It was shown that the ratio of total kinetic energy (KE) to the total internal energy was less than 5% over
the crushing process, thus maintaining the quasi-static condition. The loading plate was displaced using *BOUNDARY_
PRESCRIBED_MOTION_RIGID at a constant loading rate of 100 mm/s. Two types of contact algorithm were used to
simulate the boundary conditions of quasi-static crushing. The first one was to simulate the interface between the loading
plate and the upper end of the tube using the *CONTACT_CONSTRAINT _NODES_TO_SURFACE command of LS-
DYNA. The interface force between the loading plate and the tube was used to obtain the force-displacement responses.
The other was to prevent the tube from drifting on the bottom end of tube; this was done by employing the
*RIGIDWALL_ GEOMETRIC_FLAT command in LS-DYNA, by which a flat rigid surface was defined beneath the
tube. In this way, the tube would always stay on the top of this flat surface, even if the tube started folding at the bottom
end.
For simulation of the dynamic axial crushing, the same boundary conditions were applied to the bottom end of the tubes
and the upper end was set free in all degree of freedom. The tube was impacted by the loading plate with certain downward
velocity. The initial velocity of the loading plate was introduced by the *INITIAL_VELOCITY_RIGID_BODY
command. In both quasi-static and dynamic crushing simulations, a self-contact algorithm, invoked by the *CONTACT_
AUTOMATIC_SINGLE_SURFACE command was used to prevent interpenetration during the folding of the tubes.
3. Experimental program
Test specimens were cut from commercially available aluminum tubes of intermediate length (L ¼ 5D). A square cutout
of 7.5 mm  7.5 mm was carefully drilled and machine-finished along three different locations on the tubes, at locations
L0 ¼ 0.50, 0.75 and 0.95L.
3.1. Quasi-static crushing test
These tests were conducted using a MTS loading frame controlled by Instron 8500 electronics to study some of the cases
investigated in the numerical simulations. The crushing speed was 10 mm/min in the test. The specimens were constrained
by a steel sleeve fixture at their bottom end while the top end was set free and subject to compression by the rigid loading
plate, mimicing the fixed-free boundary condition used in the numerical simulations. The crushing force versus crushing
displacement response was recorded. Three identical specimens were tested for each case, and the average of the data was
used for comparison purpose.
3.2. Impact load testing
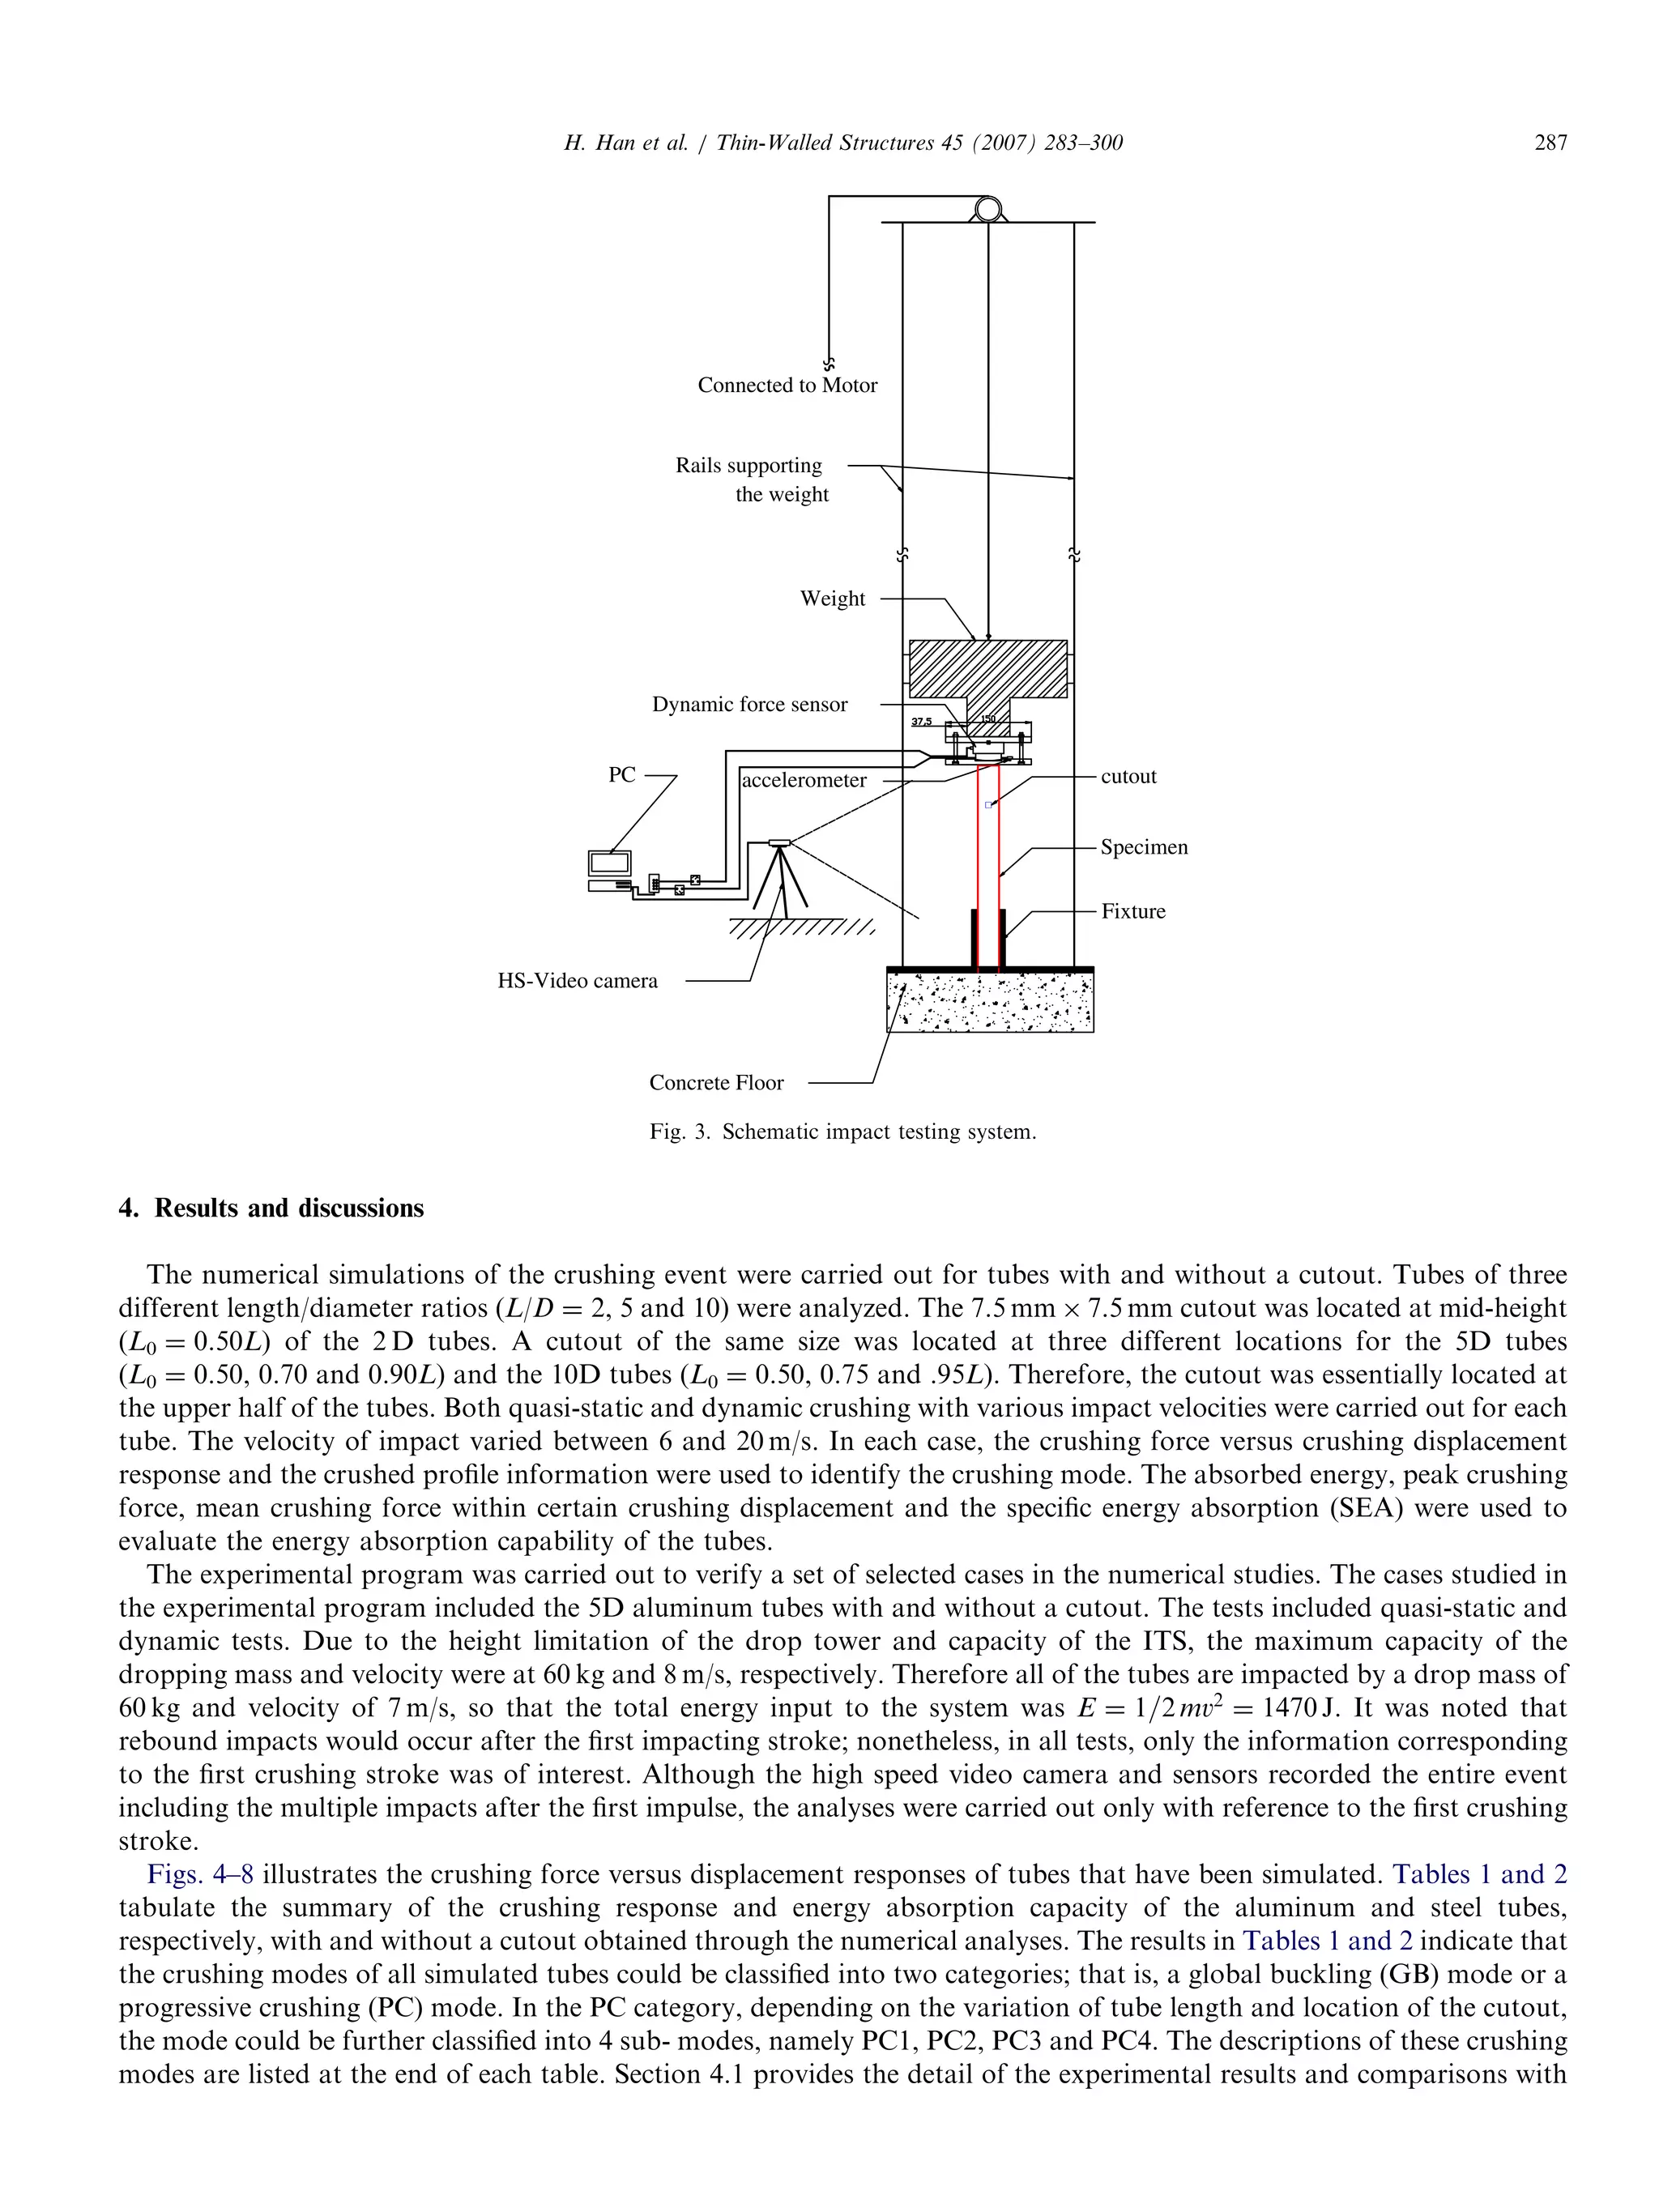
The impact testing system (ITS) was fabricated in our research laboratory, as shown in Fig. 3. The drop tower-testing
machine controlled by a motor is about 3.25 m high, which results in a maximum impact velocity of 8.0 m/s. A dynamic
force sensor (Model 200C50, 50000 lb capacity, PSB Piezotronics Inc. Depew, NY) was used to catch the instantaneous
compression force. Three quartz shear model ICP accelerometers (Model 353B15) were mounted on the top of the loading
plate to measure the acceleration during the impact event. The signals from the force sensor and accelerometers were
directed through an ICP signal conditioner, and were then collected by an 8 channel, 12 bit, 200 ks/s data acquisition card
(NI PCI-6023E, E-series multifunctional) connected to the computer. A high-speed video camera (Photron USA Inc., San
Diego, CA) connected to the built-in data acquisition card of the same computer was also used to record the crushing event
of the tubes. The maximum frame rate of the high-speed camera was 10,000 Frame/s. The Motion Tool software (Photron
USA Inc., San Diego, CA) associated with the high-speed video camera, was used to synchronize the real-time image with
the corresponding signal from the force sensor and accelerometers. By tracking the motion of the loading plate via the
recorded images, the crushing distance versus time history could be constructed. This was synchronized with the force
versus time history recorded by the dynamic force sensor. Thus, the load-crushing displacement curve could be obtained.
ARTICLE IN PRESS
H. Han et al. / Thin-Walled Structures 45 (2007) 283–300286](https://image.slidesharecdn.com/8d54768f-61d4-4a6d-9de4-79237b500a49-160729011733/75/Thin-Walled-Structures-45-p283-300-4-2048.jpg)
![5. Prediction of mean and peak crushing forces
The crushing behavior and response of the aluminum and steel tubes subjected to quasi-static and dynamic axial
compressive loading were presented in the previous sections. It was found that the energy absorption was relative to the
tube length, material properties, cutout location and impact velocities. The research reported here demonstrated very good
agreement between the results from the experiments and numerical analyses. This observation encouraged us to conduct
systematic numerical simulations and to develop appropriate empirical equations based on the result obtained. In this
section, a series of empirical equations were developed by means of linear and/or nonlinear regression analysis on the data
that was reported in Section 4. These empirical equations may be used to predict the peak and mean crushing forces of
aluminum or steel tubes with a cutout along different locations, subject to both quasi-static compression and dynamic
impact loadings with various impact velocities.
5.1. Equations for aluminum tubes
From this study, it was found that Eq. (3) could be used to predict the mean crushing force of aluminum tubes very well.
Empirical equations were also developed for the aluminum tubes without a cutout, subject to both quasi-static and
dynamic crushing load conditions. Under quasi-static crushing, the mean crushing forces for tubes of various lengths could
be predicted by
Pm ¼ 4pRtsu
2t
R
0:7
1:01 À 0:0179
L
2R
, (6)
whereas under a dynamic crushing condition, the mean crushing force of aluminum tubes could be evaluated by the
following equation, which considers the variation of both tube length and impact velocity.
Pm ¼ 4pRtsu
2t
R
0:7
1:01 À 0:0179
L
2R
ð0:968 þ 0:00654VÞ. (7)
For aluminum tubes with a cutout at various locations, the mean crushing forces for quasi-static and dynamic crushing
conditions could be predicted by Eqs. (8) and (9), respectively.
Under quasi-static crushing:
Pm ¼ 4pRtsu
CN
C
2t
R
0:7
1:01 À 0:0179
L
2R
0:2326 þ 0:9506
L0
L
. (8)
Under dynamic crushing:
Pm ¼ 4pRtsu
CN
C
2t
R
0:7
1:01 À 0:0179
L
2R
ð0:968 þ 0:00654VÞ 0:732 þ 0:287
L0
L
. (9)
Under a quasi-static crushing condition, the reference peak crushing force may be calculated by PI ¼ 2ptRs0, because
the crushing initiation force is proportional to the net section yielding at the crushing front. That said, the peak crushing
force is also a function of the impact velocity, as shown by the results obtained from the numerical simulations reported in
Tables 1 and 2. For aluminum tubes with and without a cutout, the peak crushing force could be predicted by
PI_A ¼ pRtðs0 þ suÞ
CN
C
1:02 À 0:00931
L
2R
1:04 À 0:129
L0
L
ð0:994 þ 0:00188 VÞ. (10)
In Eqs. (8)–(10) CN is the net circumference of the tubes where the cutout is located, and C is the overall circumference of
the tubes (without a cutout). The ratio of CN over C describes the reduction effect of a cutout. Eqs. (6)–(10) are developed
based on linear regression analysis and apply to fixed-free supported tubes with L/D ratios between 2 and 10, impact
velocity of between 6 and 20 m/s and the cutout location in the interval of 0.50pL0p0.95L.
5.2. Equations for steel tubes
It is known that steel is a strain rate-sensitive material, thus sensitive to the variation in impact velocity. In this study, it
was found that a model developed based on combining Joans [13] and Magee and Thornton [4] models could be used to
predict the mean crushing force in steel tubes, subject to low or intermediate-velocity (up to 20 m/s) axial impact, with good
ARTICLE IN PRESS
H. Han et al. / Thin-Walled Structures 45 (2007) 283–300298](https://image.slidesharecdn.com/8d54768f-61d4-4a6d-9de4-79237b500a49-160729011733/75/Thin-Walled-Structures-45-p283-300-16-2048.jpg)
![Empirical equations for predicting the mean and peak crushing forces of aluminum and steel tubes with and without a
cutout were developed based on combining the approaches used by Joans [13] and Magee et al. [4]. These equations were
based on linear and nonlinear fit to the results obtained from the parametric numerical study conducted in this research.
Acknowledgments
The financial support of the Natural Sciences and Engineering Council of Canada (NSERC) in the form of Discovery
Grants to the second and third authors in support of this work is gratefully acknowledged.
References
[1] Alghamdi AAA. Collapsible impact energy absorbers: an overview. Thin-Wall Struct 2001;39:189–213.
[2] Yamashita M, Gotoh M, Sawairi Y. Axial crush of hollow cylindrical structures with various polygonal cross-sections numerical simulation and
experiment. J Mater Process Technol 2003;140:59–64.
[3] Alexander JM. An approximate analysis of the collapse of thin cylindrical shells under axial loading. Quart J Mechd Appl Math 1960;13:10–5.
[4] Magee CL, Thornton PH. Design consideration in energy absorption by structural collapse. SAE Technical paper no. 780434, 1978.
[5] Zhao H, Abdennadher S. On the strength enhancement under impact loading of square tubes made from rate insensitive metals. Int J Solids Struct
2004;41:6681–97.
[6] Schneider F, Joans N. Impact of thin-wall high strength steel structural section, In: Proceedings of the institution of mechanical engineers 218 (D): J
Automob Eng, 2004; 131–158.
[7] Dipaolo BP, Monteiro PJM, Gronsky R. Quasi-static axial crush response of a thin-wall, stainless steel box component. Int J Solids Struct
2004;41:3707–33.
[8] Wang B, Lu G. Mushrooming of circular tubes under dynamic axial loading. Thin-Wall Struct 2002;40:167–82.
[9] Mantena PR, Mann R. Impact and dynamic response of high-density structural foams used as filler inside circular steel tube. Compos Struct
2003;61:291–302.
[10] Bouchet J, Jacquelin E, Hamelin P. Static and dynamic behavior of combined composite aluminum tube for automotive applications. Compos Sci
Technol 2000;60:1891–900.
[11] Mamalis AG, Manolakos DE, Ioannidis MB, Kostazos PK. Crushing of hybrid square sandwich composite vehicle hollow bodyshells with reinforced
core subjected to axial loading: numerical simulation. Compos Struct 2003;61:175–86.
[12] Marsoleka J, Reimerdes HG. Energy absorption of metallic cylindrical shells with induced non-axisymmetric folding patterns. Int J Impact Eng
2004;30:1209–23.
[13] Joans N. Structural impact. Cambridge University Press; 1997.
[14] Kormi K, Webb DC, Montague P. Crash behavior of circular tubes with large side openings. Int J Mech Sci 1993;35(3/4):193–208.
[15] Sahu SK, Datta PK. Dynamic stability of curved panels with cutouts. J Sound Vib 2002;251(4):683–96.
[16] Sahu SK, Datta PK. Dynamic stability of laminated composite curved panels with cutouts. J Eng Mech ASCE 2003:1245–53.
[17] Han HP, Taheri F, Cheng JQ, Pegg N. Numerical and experimental investigations of the response of aluminum cylinders with a cutout subject to
axial compression. Thin Wall Struct 2006;44:254–70.
[18] LS-DYNA keyword user’s manual, V970, LSTC, Livermore, CA, 2005.
[19] El-Hage HH. A numerical study on the quasi-static axial crush characteristics of square aluminum and aluminum-composite hybrid tubes, PhD
thesis, University of Windsor, 2004.
[20] Olovsson L, Simonsson K, Unosson M. Selective mass scaling for explicit finite element analyses. Int J Num Meth Eng 2005;63:1436–45.
ARTICLE IN PRESS
H. Han et al. / Thin-Walled Structures 45 (2007) 283–300300](https://image.slidesharecdn.com/8d54768f-61d4-4a6d-9de4-79237b500a49-160729011733/75/Thin-Walled-Structures-45-p283-300-18-2048.jpg)


