Download to read offline

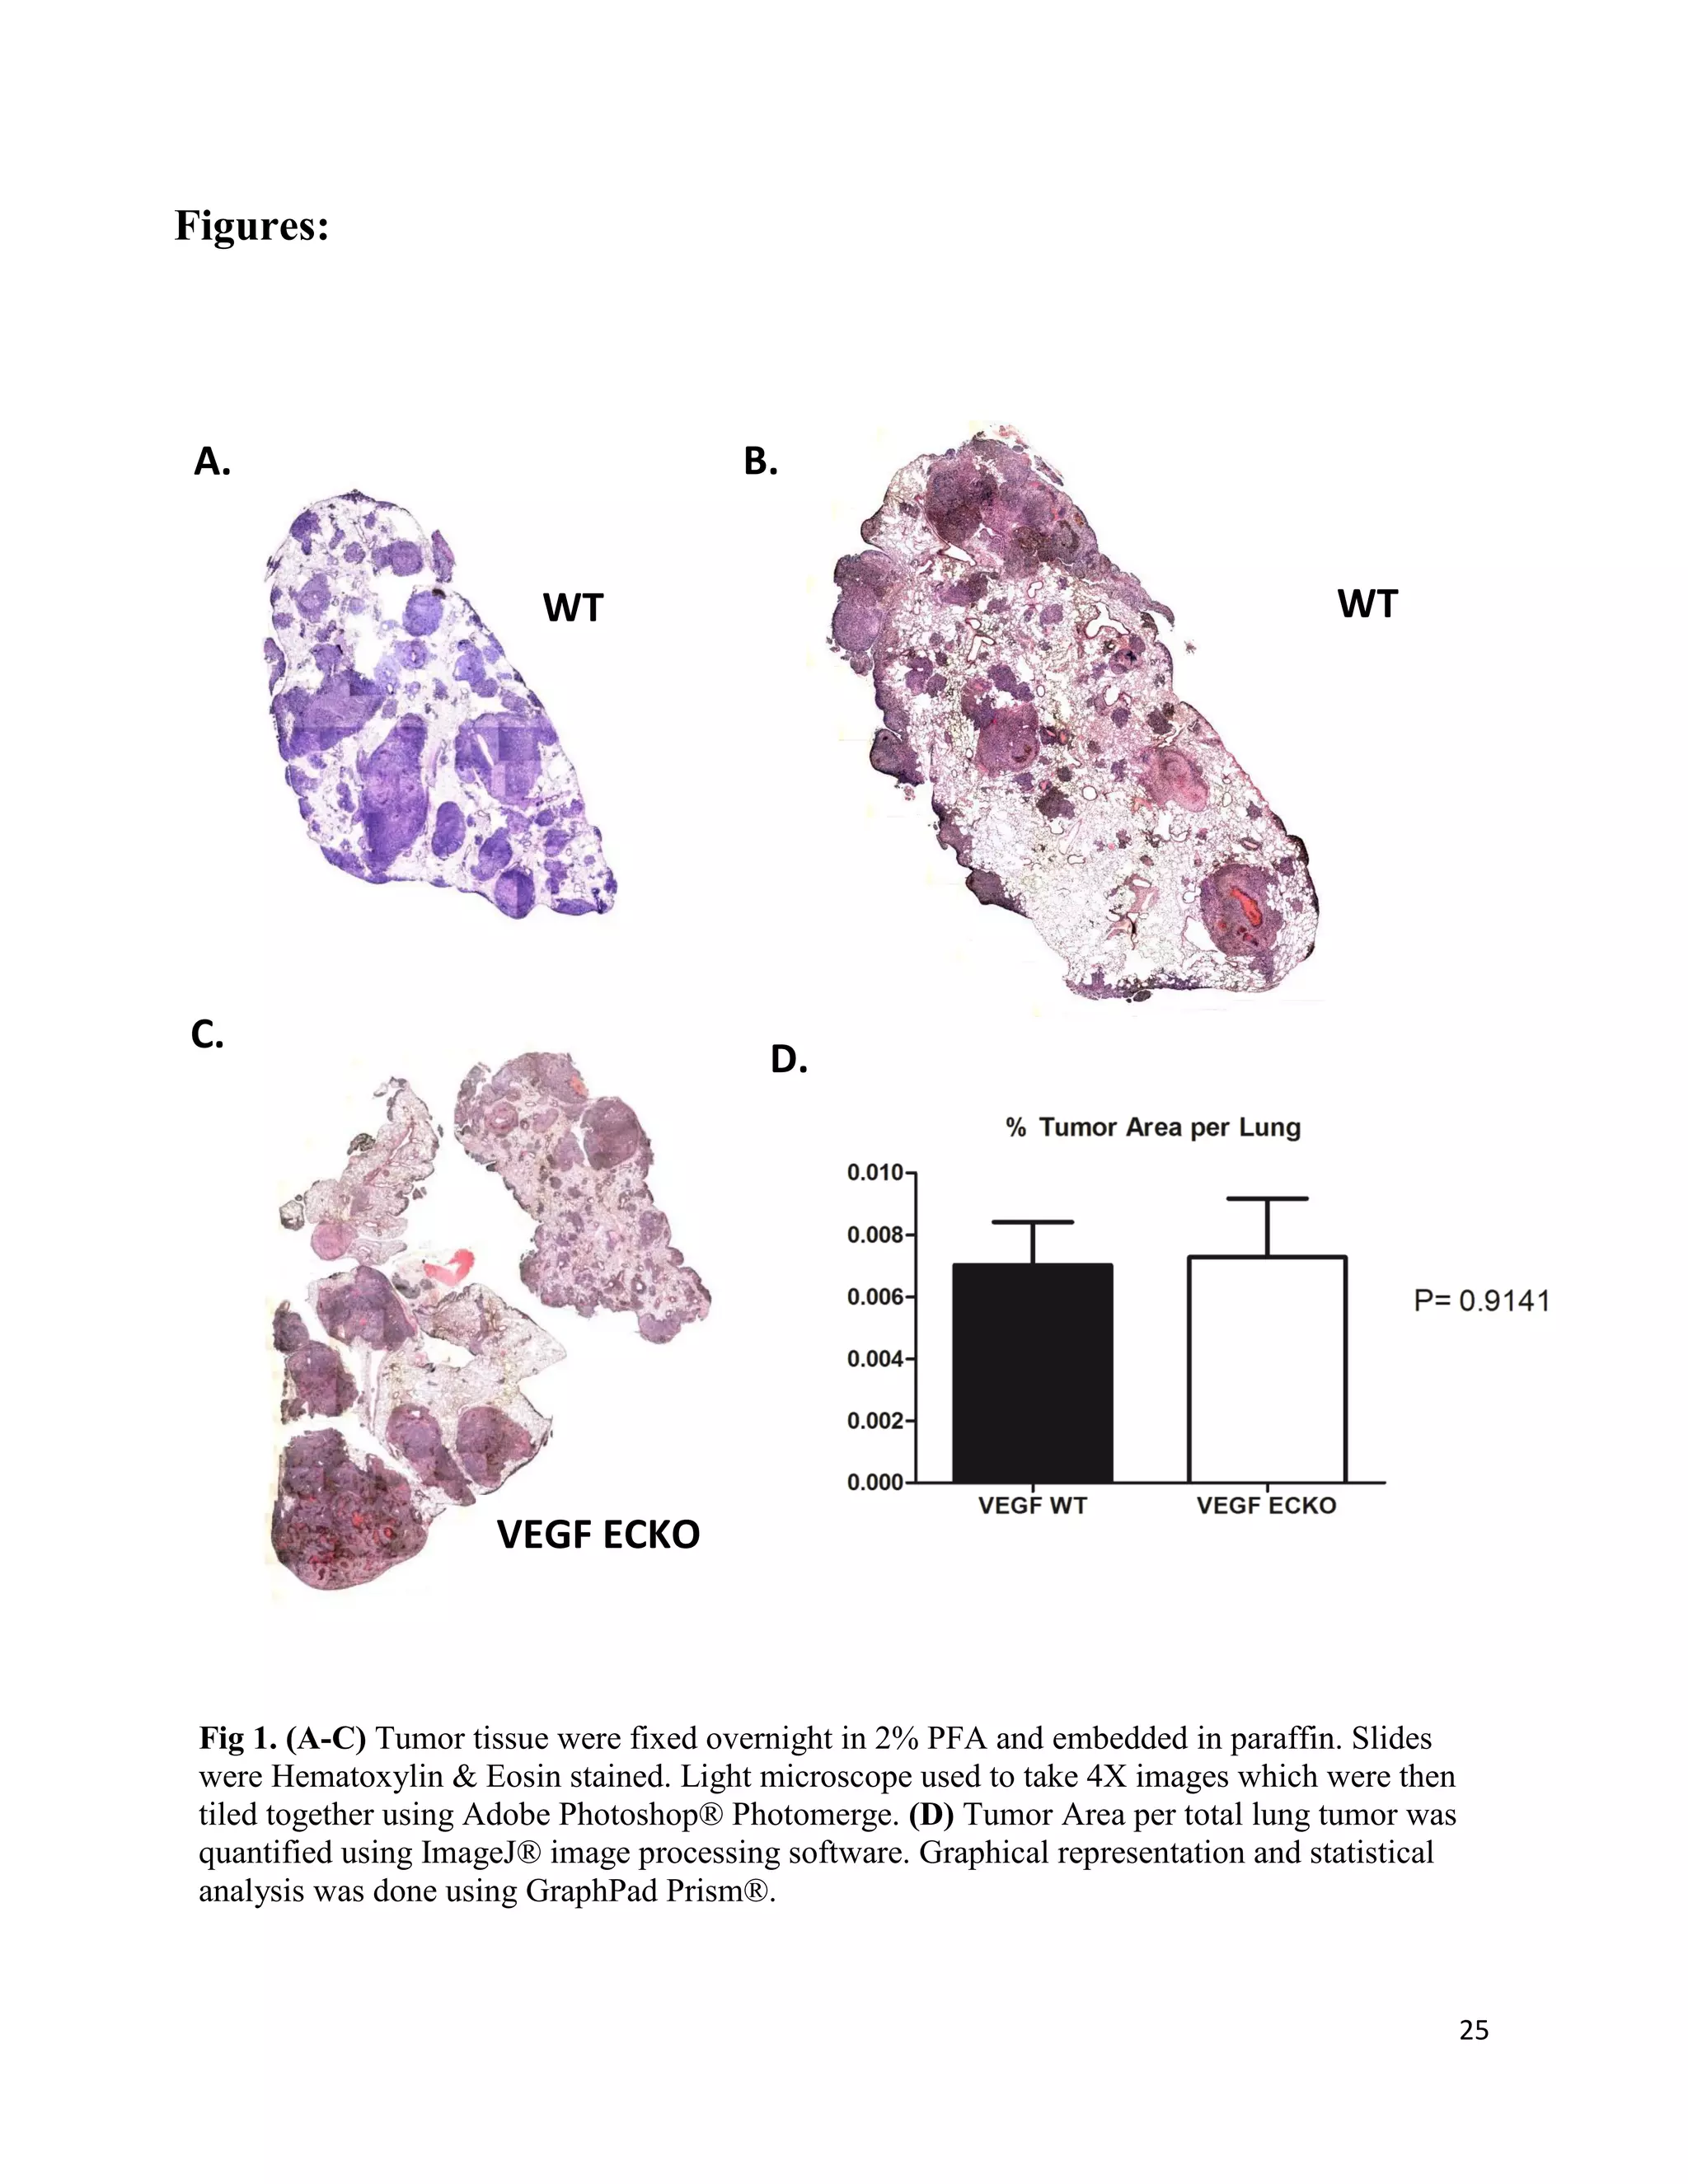
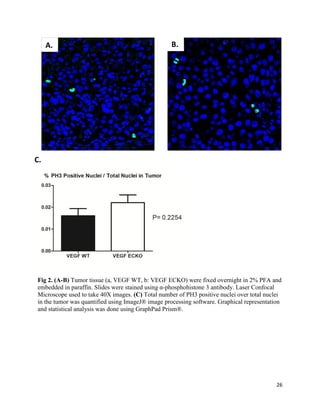
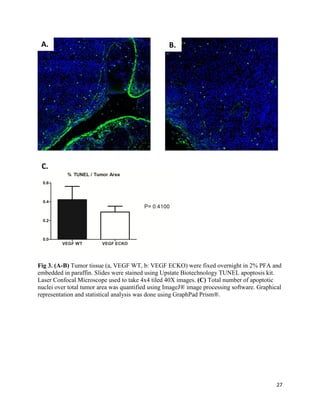
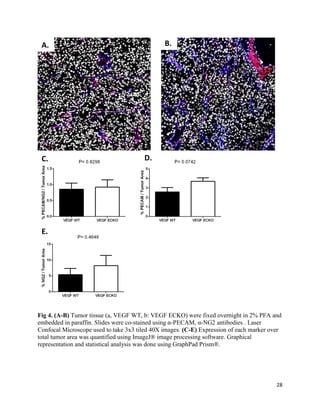
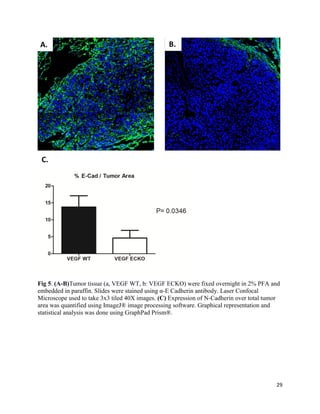
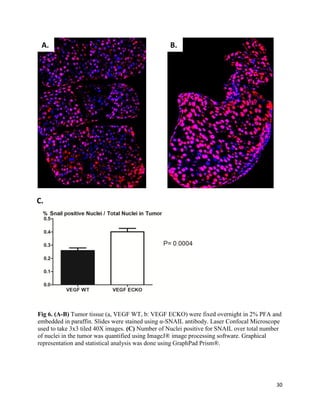
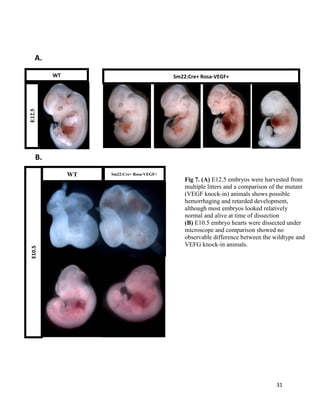
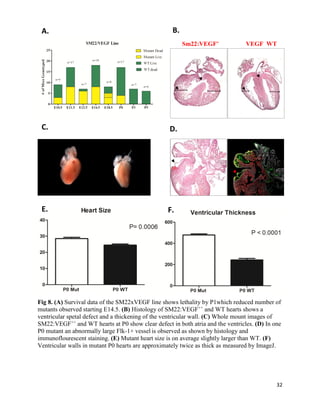
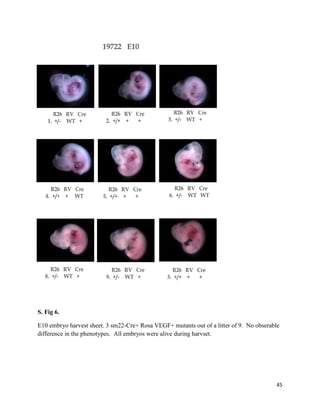
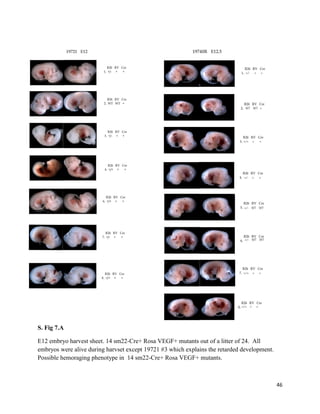
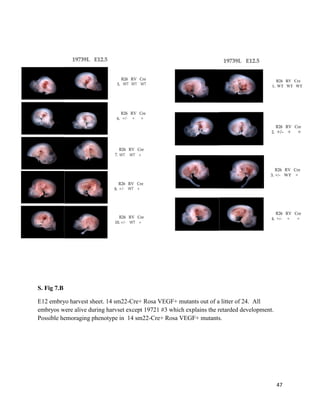
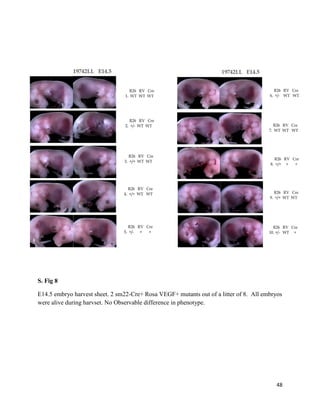
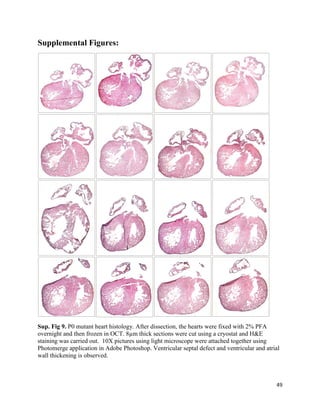
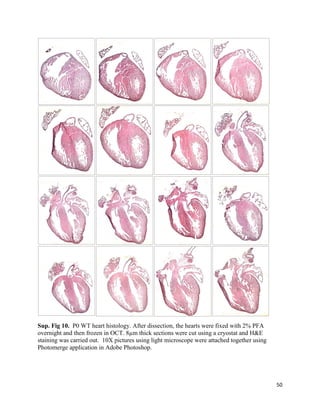
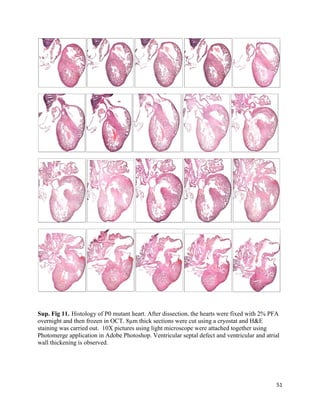

The document describes methods used to analyze tissue samples from tumor and heart experiments. It includes 15 figures showing staining and imaging results. Figure 1 shows quantification of tumor area in lung tissue. Figures 2-3 show quantification of proliferation and apoptosis markers in tumor tissue. Figures 4-6 show quantification of endothelial and epithelial markers. Figures 7-10 show imaging results from experiments on heart development in mouse embryos with VEGF overexpression. Figures 11-15 show results from experiments on VEGF knockdown in endothelial cells, including effects on autophagy, FOXO1 expression and rescue with FOXO1 knockdown. Supplemental figures provide additional imaging data from mouse embryos and hearts.


