This document provides background information on the challenges of determining school performance and effectiveness. Traditional methods such as test scores, accreditation, and curriculum audits are discussed as well as quality models from business. The study aims to investigate educators' perceptions of school performance using criteria from the Malcolm Baldrige National Quality Award and determine if perceptions differ based on educator role or district size.


![16
People []""
Money
Support
Resources
INPUTS OUTPUT
Education
System
$$CUSTOMERS
Higher Education
Taxpayers
Employers
Educated students who
can continue to learn
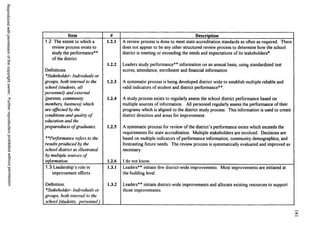
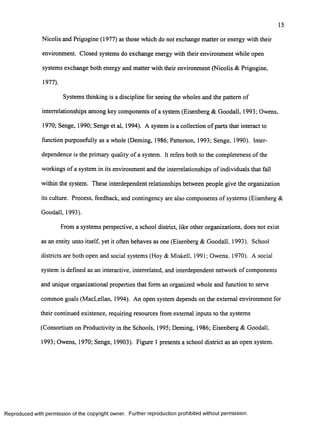
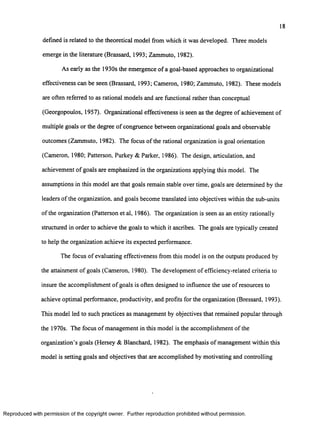
Figure 1. An Educational System as an Open System.
In open systems, groups outside the system affect the system’s survival and their
ability to change. School districts take in political, financial, and human resources and use
them to create a service. This service results in a product to the surrounding environment of
the workplace, higher education, and community. Open systems theory emphasizes the
dynamic aspects o f organization; that is, the movement in one part leads in predictable
fashion to movement in other parts. They are in a constant state o f flux because they are
open to inputs from the environment (Katz & Kahn, 1978).
School districts have also been described as loosely coupled systems (Weick, 1976).
Weick (1976) explains that the use of the term intends to convey the image that coupled
events are responsive but that each event also preserves its own identity and some evidence
of its physical separateness. There is usually lack o f clarity, coordination, and articulation
between and among subsystems within the larger system, despite their interdependence.
Such systems often are organizations in which accountability and interdependence between
subsystems are low and autonomy is high (Deer, 1976; Fullan, 1980). Subsystems are
purposely not closely connected and do little to control each other’s activities. They tend to
Reproduced with perm ission of the copyright owner. Further reproduction prohibited without perm ission.](https://image.slidesharecdn.com/thesis-140320023532-phpapp02/85/Thesis-33-320.jpg)


![60
Chapter 3
Methodology
Introduction
This research study examined a theory and a framework on which the operation and
performance of a school district can be assessed to determine where improvements might be
necessary. There are three purposes:
1. To determine how participants rate the performance o f their district currently in
each o f the seven categories o f the Performance Analysisfo r School Districts.
2. To determine if these scores differ by type o f educator or size o f school district.
3. To determine how participants perceive the usefulness o f the instrument as a
framework for self-analysis by a school district in school improvement.
The study involved the development of an instrument to collect information regarding
school district performance. It investigated differences by type o f educator and size of
district. It measured the perception of participants about the instrument’s usefulness in
approaching school improvement.
The Research Model
The model for the research study was as follows: Y t]k = u + a, ~ bj+ (ab),j ~ e ljk The value
of the response variable is the sum of:
u = the effect o f the overall mean,
a, = the effect of the district size.
bj =the effect of the position type.
(ab),j = the effect o f the interaction of district size and position.
e ,jk = random error in model.
Reproduced with perm ission of the copyright owner. Further reproduction prohibited without perm ission.](https://image.slidesharecdn.com/thesis-140320023532-phpapp02/85/Thesis-77-320.jpg)