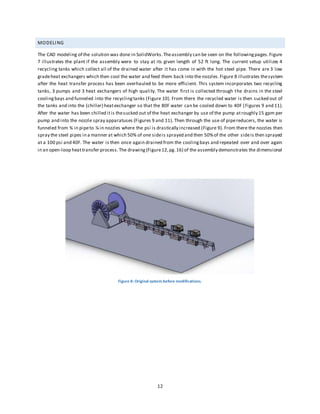
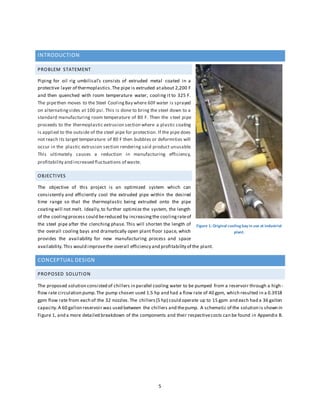
1. The document describes modifications made to improve an industrial pipe cooling system. The original system cooled extruded metal pipes with water nozzles but took too long (52 feet) and inconsistently cooled the pipes before the plastic coating melted.
2. The proposed solution added chillers and increased the water pressure and flow rate through nozzles. Modeling showed this would reduce the required cooling length to 24 feet, freeing up plant space.
3. A cost analysis determined the modifications would cost $34,838.05 but that the additional plant space alone would offset the cost within a quarter by enabling new processes and manufacturing.


![9
Final Cooler Length
ℎ 𝑥 = 0.000115063 ∗ √(91.11 − 0.75)/𝑥
We assumethat the rate of temperature loss isconstant,thus we set dT/dt equal to itself and found:
𝑑𝑇/𝑑𝑡 = [−0.00230126√91.11 − 0.75/𝑥 (𝑇 − 40)]/(0.2834 ∗ 0.25 ∗ 0.12)
Thus, we determined the required total spray swath to be 50.77 inches:
285/40 = √ 𝑥1/𝑥2 → 𝑥1/𝑥2 = 81225/1600 → 𝑥1 = 50.77𝑥2
With that we were able to calculatethe Reynolds number, Nusseltnumber and the convection heat transfer at
startof the process 0.0011 BTU/s-F-in2 and the heat transfer atend of the process.That and our constants we
were able to calculatethe final cooler length.
𝑅𝑒2 = 0.75 ∗ 50.77/239.616 ∗ 10−5
= 15891.1
𝑁𝑢2 = 0.332(15891.1).5
∗ 10.5181/3
= 91.7
ℎ2 = (7.743 ∗ 10−6
/50.77) ∗ 91.7 = 0.00015 𝐵𝑇𝑈/𝑠𝐹𝑖𝑛2
𝐹𝑖𝑛𝑎𝑙 𝐿𝑒𝑛𝑔𝑡ℎ = 36𝑖𝑛 ∗ (50.77𝑖𝑛/7.14𝑖𝑛) = 255.98 𝑖𝑛𝑐ℎ𝑒𝑠 = 21.33 𝑓𝑡
This measurement is strictly required by the nozzle array set-up, so takingto accountthe needed empty space,the
actual cooler length comes out to be 24ft.
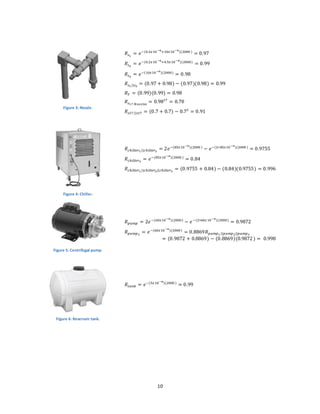
RELIABILITY
Reliability in Series:
𝑅𝑠 = 𝑒− ∑ 𝜆𝑡
Reliability in Parallel:
𝑅|| = 𝑒−𝜆1 𝑡
+ 𝑒−𝜆2 𝑡
− 𝑒−(𝜆1+𝜆2)𝑡
t = 2000 hours
Part Reliability (rate/hour)
90 Degree Elbow 0.2x10⁻⁶
SplittingT 0.5x10⁻⁶
Nozzle 10.0x10⁻⁶
Pump 60.0x10⁻⁶
Chiller 85.0x10⁻⁶
Tank 5.0x10⁻⁶
Table 3: Failure ratesfor system components.](https://image.slidesharecdn.com/8399a3b0-edd4-42c6-b9a4-60a3e5e77f03-160410010901/85/Thermal-Systems-Design-9-320.jpg)