Downloaded 175 times


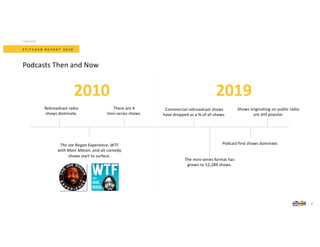
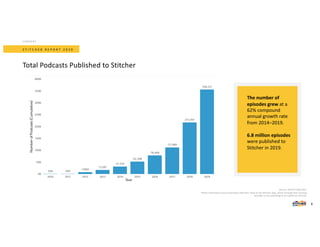
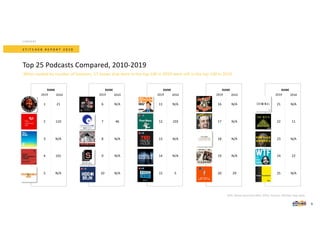
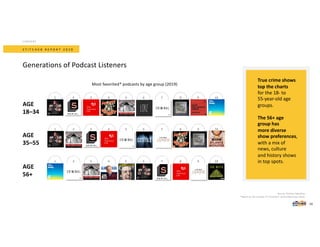
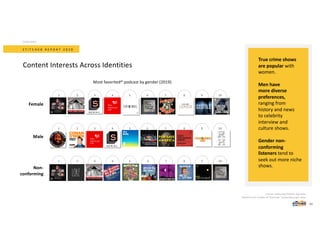


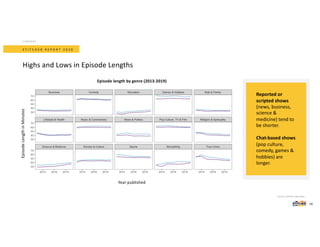
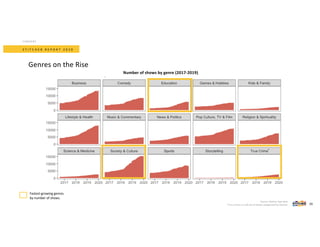
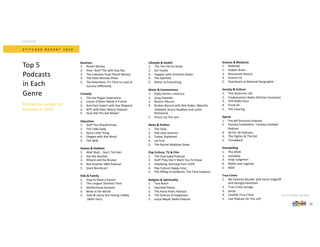


The podcast content landscape has changed dramatically over the past decade. While some established shows from 2010 remain popular today, podcast-first shows now dominate the top charts. New genres like true crime have emerged as favorites, accounting for the most total and binge listening hours in 2019. The number of mini-series podcasts has also grown enormously from just a few in 2010 to over 52,000 in the past decade. Episode lengths have trended slightly shorter on average in recent years.


