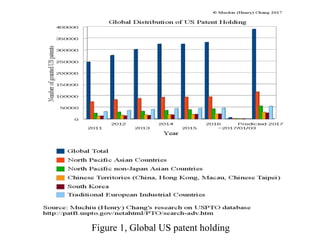
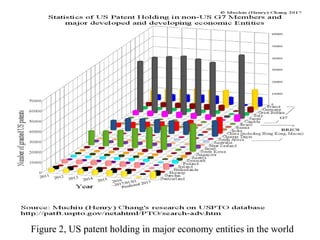
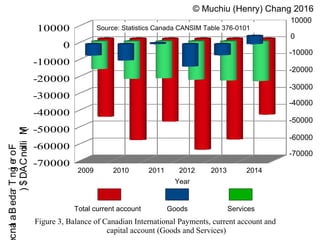
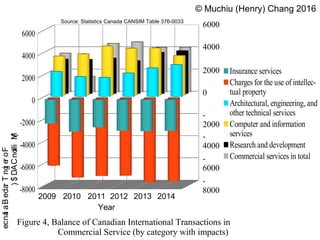
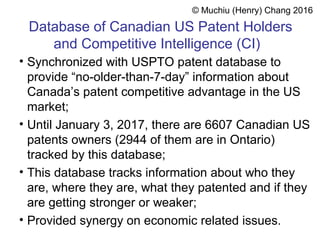
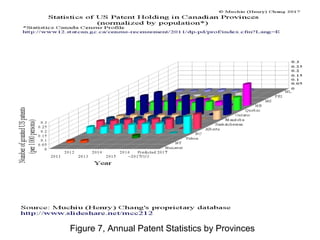
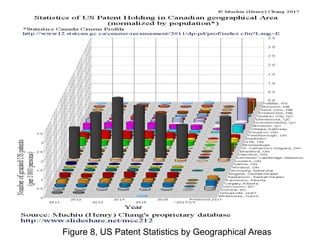
Muchiu (Henry) Chang, PhD. Cantab.
henry.chang212@gmail.com
January 3, 2017
Directory of Canadian US Patent Holders -
The latest Competitive Intelligence (CI) and
intellectual Ecosystem of Canada
Figure 1, Global US patent holding
Figure 2, US patent holding in major economy entities in the world
10000
0
-10000
-20000
-30000
-40000
-50000
-60000
-70000
20102009 2011 2012 2013 2014
Year
Total current account Goods Services
© Muchiu (Henry) Chang 2016
Figure 3, Balance of Canadian International Payments, current account and
capital account (Goods and Services)
ForeignTradeBalanc
(MillionCAD$)
-70000
-60000
-50000
-40000
-30000
-20000
-10000
0
10000 Source: Statistics Canada CANSIM Table 376-0101
© Muchiu (Henry) Chang 2016
Figure 4, Balance of Canadian International Transactions in
Commercial Service (by category with impacts)
20102009 2011 2012 2013 2014
Year
Source: Statistics Canada CANSIM Table 376-0033
-
8000
-
6000
-
4000
-
2000
0
2000
4000
6000
-8000
-6000
-4000
-2000
0
2000
4000
6000
Insurance services
Charges for the use of intellec-
tual property
Architectural, engineering, and
other technical services
Computer and information
services
Research and development
Commercial services in total
ForeignTradeBalance
(MillionCAD$)
© Muchiu (Henry) Chang 2016
Figure 5, The Impacts of Charges for the use of IP on Canadian foreign Trade
Source: Statistics Canada CANSIM Table 376-0033, 376-0101
PercentageofthetotalCanadian
foreignTradeDeficit
2009 2010 2011 2012 2013 2014
0
5
10
15
20
25
30
35
40
45
Travel
Transportation
Charges for the use of intellectual
property
Insurance services
Figure 6, The Impact of IP to 2014 Canadian foreign Trade
Database of Canadian US Patent Holders
and Competitive Intelligence (CI)
• Synchronized with USPTO patent database to
provide “no-older-than-7-day” information about
Canada’s patent competitive advantage in the US
market;
• Until January 3, 2017, there are 6607 Canadian US
patents owners (2944 of them are in Ontario)
tracked by this database;
• This database tracks information about who they
are, where they are, what they patented and if they
are getting stronger or weaker;
• Provided synergy on economic related issues.
© Muchiu (Henry) Chang 2016
Canadian Patent Landscape
in the US Market
• Ontario is the largest US patent hub province;
Kitchener-Cambridge-Waterloo CMA,
Drummondville, Brantford, are the top US patent
hosting geographical areas in Canada respectively
(normalized by population).
© Muchiu (Henry) Chang 2016
If you need the latest intelligence regarding:
• the names of 6,000+ Canadian US patent owners in
all business sectors, from coast to coast; and
their detailed patent strengths and trends of these
Canadian companies in the US market, please feel
free to contact:
Dr. Muchiu (Henry) Chang
henry.chang212@gmail.com
+1-416-828-5676
© Muchiu (Henry) Chang 2016
Figure 7, Annual Patent Statistics by Provinces
Figure 8, US Patent Statistics by Geographical Areas

The archived Canadian US Patent Competitive Intelligence Database (2017/1/3)

  • 1.
    Muchiu (Henry) Chang,PhD. Cantab. henry.chang212@gmail.com January 3, 2017 Directory of Canadian US Patent Holders - The latest Competitive Intelligence (CI) and intellectual Ecosystem of Canada
  • 2.
    Figure 1, GlobalUS patent holding
  • 3.
    Figure 2, USpatent holding in major economy entities in the world
  • 4.
    10000 0 -10000 -20000 -30000 -40000 -50000 -60000 -70000 20102009 2011 20122013 2014 Year Total current account Goods Services © Muchiu (Henry) Chang 2016 Figure 3, Balance of Canadian International Payments, current account and capital account (Goods and Services) ForeignTradeBalanc (MillionCAD$) -70000 -60000 -50000 -40000 -30000 -20000 -10000 0 10000 Source: Statistics Canada CANSIM Table 376-0101
  • 5.
    © Muchiu (Henry)Chang 2016 Figure 4, Balance of Canadian International Transactions in Commercial Service (by category with impacts) 20102009 2011 2012 2013 2014 Year Source: Statistics Canada CANSIM Table 376-0033 - 8000 - 6000 - 4000 - 2000 0 2000 4000 6000 -8000 -6000 -4000 -2000 0 2000 4000 6000 Insurance services Charges for the use of intellec- tual property Architectural, engineering, and other technical services Computer and information services Research and development Commercial services in total ForeignTradeBalance (MillionCAD$)
  • 6.
    © Muchiu (Henry)Chang 2016 Figure 5, The Impacts of Charges for the use of IP on Canadian foreign Trade Source: Statistics Canada CANSIM Table 376-0033, 376-0101 PercentageofthetotalCanadian foreignTradeDeficit 2009 2010 2011 2012 2013 2014 0 5 10 15 20 25 30 35 40 45 Travel Transportation Charges for the use of intellectual property Insurance services
  • 7.
    Figure 6, TheImpact of IP to 2014 Canadian foreign Trade
  • 8.
    Database of CanadianUS Patent Holders and Competitive Intelligence (CI) • Synchronized with USPTO patent database to provide “no-older-than-7-day” information about Canada’s patent competitive advantage in the US market; • Until January 3, 2017, there are 6607 Canadian US patents owners (2944 of them are in Ontario) tracked by this database; • This database tracks information about who they are, where they are, what they patented and if they are getting stronger or weaker; • Provided synergy on economic related issues. © Muchiu (Henry) Chang 2016
  • 9.
    Canadian Patent Landscape inthe US Market • Ontario is the largest US patent hub province; Kitchener-Cambridge-Waterloo CMA, Drummondville, Brantford, are the top US patent hosting geographical areas in Canada respectively (normalized by population). © Muchiu (Henry) Chang 2016
  • 10.
    If you needthe latest intelligence regarding: • the names of 6,000+ Canadian US patent owners in all business sectors, from coast to coast; and their detailed patent strengths and trends of these Canadian companies in the US market, please feel free to contact: Dr. Muchiu (Henry) Chang henry.chang212@gmail.com +1-416-828-5676 © Muchiu (Henry) Chang 2016
  • 11.
    Figure 7, AnnualPatent Statistics by Provinces
  • 12.
    Figure 8, USPatent Statistics by Geographical Areas