Download to read offline

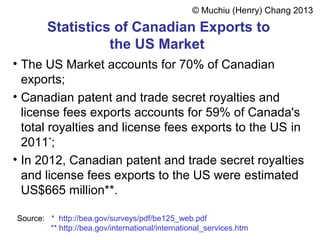
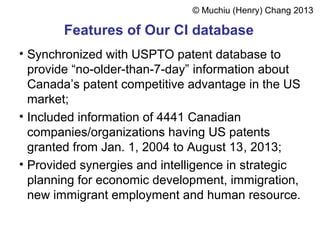
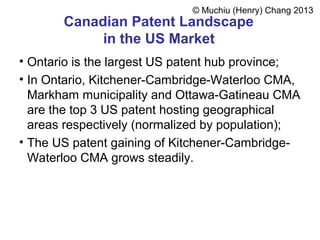
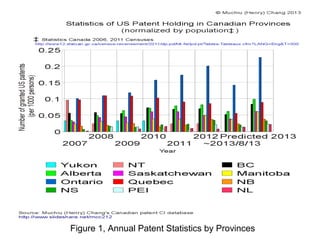
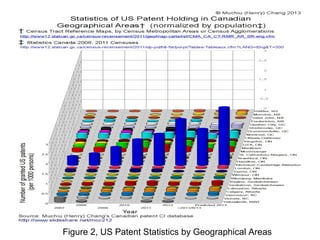
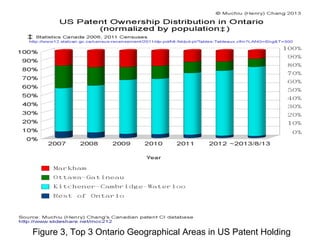


The document discusses the significant role of the US market in Canadian exports, highlighting that it accounts for 70% of such exports and 59% of royalties and license fees. It outlines features of a competitive intelligence database synchronizing with the USPTO, providing information on Canadian companies with US patents, and notes Ontario as the leading province for US patents. Additionally, it offers contacts for obtaining detailed patent trend analyses in the US market.


