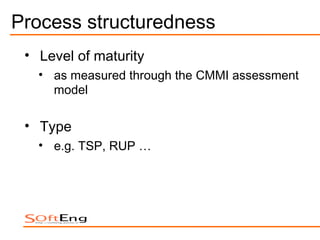
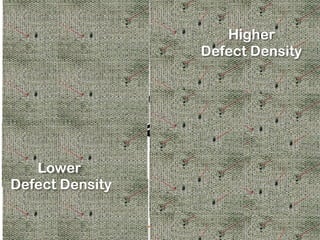
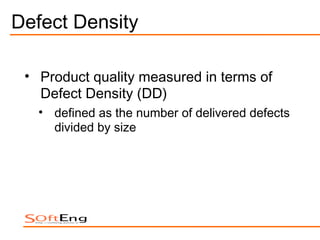
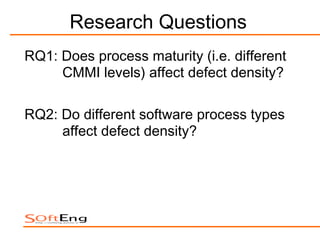
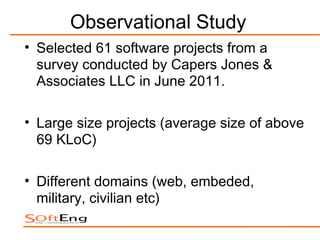
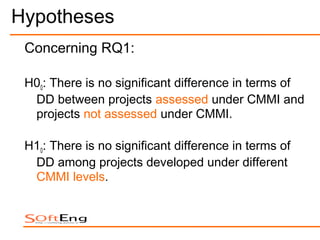
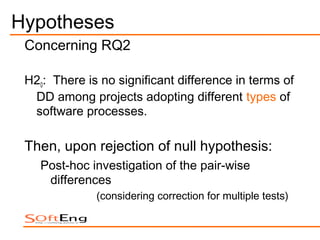
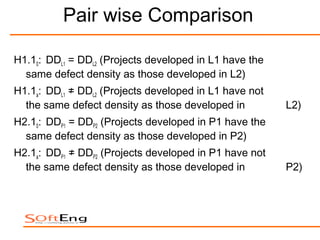
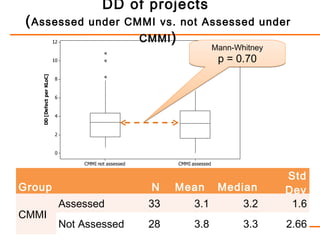
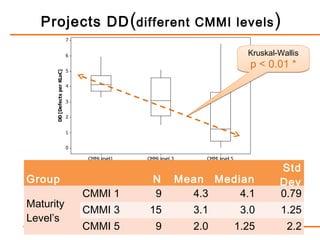
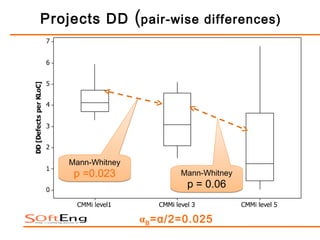
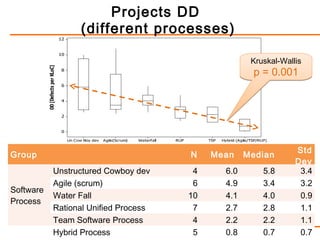
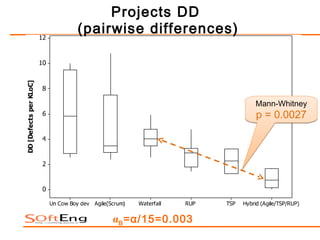
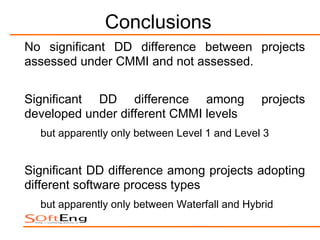
The Impact of Process
  Maturity on Defect
       Density


        Syed Muhammad Ali Shah,
    Maurizio Morisio, Marco Torchiano*
Software
Process
           vs
                Software
                 Quality
Structured


             Software
             Process


                        Unstructured
Process structuredness
 • Level of maturity
   • as measured through the CMMI assessment
     model

 • Type
   • e.g. TSP, RUP …
Higher
                   Defect Density


            Software
             Quality
   Lower
Defect Density
Defect Density

 • Product quality measured in terms of
   Defect Density (DD)
   • defined as the number of delivered defects
     divided by size
Structured


                    Higher
                 Defect Density


   Lower
Defect Density
                    Unstructured
Research Questions
RQ1: Does process maturity (i.e. different
     CMMI levels) affect defect density?

RQ2: Do different software process types
     affect defect density?
Observational Study
• Selected 61 software projects from a
  survey conducted by Capers Jones &
  Associates LLC in June 2011.

• Large size projects (average size of above
  69 KLoC)

• Different domains (web, embeded,
  military, civilian etc)
Hypotheses
 Concerning RQ1:

 H00: There is no significant difference in terms of
  DD between projects assessed under CMMI and
  projects not assessed under CMMI.

 H10: There is no significant difference in terms of
  DD among projects developed under different
  CMMI levels.
Hypotheses
 Concerning RQ2

 H20: There is no significant difference in terms of
  DD among projects adopting different types of
  software processes.

 Then, upon rejection of null hypothesis:
    Post-hoc investigation of the pair-wise
     differences
              (considering correction for multiple tests)
Pair wise Comparison

H1.10: DDL1 = DDL2 (Projects developed in L1 have the
  same defect density as those developed in L2)
H1.1a: DDL1 ≠ DDL2 (Projects developed in L1 have not
  the same defect density as those developed in         L2)
H2.10: DDP1 = DDP2 (Projects developed in P1 have the
  same defect density as those developed in P2)
H2.1a: DDP1 ≠ DDP2 (Projects developed in P1 have not
  the same defect density as those developed in         P2)
DD of projects
 ( Assessed   under CMMI vs. not Assessed under
                       CMMI )
                                      Mann-Whitney
                                       p = 0.70


                                                     Std
Group                    N   Mean      Median        Dev
        Assessed        33      3.1          3.2      1.6
CMMI
        Not Assessed    28      3.8          3.3     2.66
Projects DD (different CMMI levels )

                                   Kruskal-Wallis
                                    p < 0.01 *


                                           Std
Group               N    Mean Median       Dev
           CMMI 1   9      4.3    4.1      0.79
Maturity
           CMMI 3   15     3.1    3.0       1.25
Level’s
           CMMI 5   9      2.0   1.25        2.2
Projects DD (pair-wise differences)


    Mann-Whitney
     p =0.023             Mann-Whitney
                           p = 0.06


                   αB =α/2=0.025
Projects DD
                 (different processes)

                                                    Kruskal-Wallis
                                                     p = 0.001


                                                                Std
Group                                 N    Mean    Median
                                                                Dev
           Unstructured Cowboy dev     4     6.0       5.8       3.4
           Agile (scrum)               6     4.9       3.4       3.2
Software
           Water Fall                 10     4.1       4.0       0.9
Process
           Rational Unified Process    7     2.7       2.8       1.1
           Team Software Process       4     2.2       2.2       1.1
           Hybrid Process              5     0.8       0.7       0.7
Projects DD
(pairwise differences)


                         Mann-Whitney
                         p = 0.0027


    αB =α/15=0.003
Conclusions
No significant DD difference between projects
assessed under CMMI and not assessed.


Significant DD difference among                projects
developed under different CMMI levels
  but apparently only between Level 1 and Level 3


Significant DD difference among projects adopting
different software process types
  but apparently only between Waterfall and Hybrid
Thank You

The impact of process maturity on defect density

  • 1.
    The Impact ofProcess Maturity on Defect Density Syed Muhammad Ali Shah, Maurizio Morisio, Marco Torchiano*
  • 2.
    Software Process vs Software Quality
  • 3.
    Structured Software Process Unstructured
  • 4.
    Process structuredness •Level of maturity • as measured through the CMMI assessment model • Type • e.g. TSP, RUP …
  • 5.
    Higher Defect Density Software Quality Lower Defect Density
  • 6.
    Defect Density •Product quality measured in terms of Defect Density (DD) • defined as the number of delivered defects divided by size
  • 7.
    Structured Higher Defect Density Lower Defect Density Unstructured
  • 8.
    Research Questions RQ1: Doesprocess maturity (i.e. different CMMI levels) affect defect density? RQ2: Do different software process types affect defect density?
  • 9.
    Observational Study • Selected61 software projects from a survey conducted by Capers Jones & Associates LLC in June 2011. • Large size projects (average size of above 69 KLoC) • Different domains (web, embeded, military, civilian etc)
  • 10.
    Hypotheses Concerning RQ1: H00: There is no significant difference in terms of DD between projects assessed under CMMI and projects not assessed under CMMI. H10: There is no significant difference in terms of DD among projects developed under different CMMI levels.
  • 11.
    Hypotheses Concerning RQ2 H20: There is no significant difference in terms of DD among projects adopting different types of software processes. Then, upon rejection of null hypothesis: Post-hoc investigation of the pair-wise differences (considering correction for multiple tests)
  • 12.
    Pair wise Comparison H1.10:DDL1 = DDL2 (Projects developed in L1 have the same defect density as those developed in L2) H1.1a: DDL1 ≠ DDL2 (Projects developed in L1 have not the same defect density as those developed in L2) H2.10: DDP1 = DDP2 (Projects developed in P1 have the same defect density as those developed in P2) H2.1a: DDP1 ≠ DDP2 (Projects developed in P1 have not the same defect density as those developed in P2)
  • 13.
    DD of projects ( Assessed under CMMI vs. not Assessed under CMMI ) Mann-Whitney p = 0.70 Std Group N Mean Median Dev Assessed 33 3.1 3.2 1.6 CMMI Not Assessed 28 3.8 3.3 2.66
  • 14.
    Projects DD (differentCMMI levels ) Kruskal-Wallis p < 0.01 * Std Group N Mean Median Dev CMMI 1 9 4.3 4.1 0.79 Maturity CMMI 3 15 3.1 3.0 1.25 Level’s CMMI 5 9 2.0 1.25 2.2
  • 15.
    Projects DD (pair-wisedifferences) Mann-Whitney p =0.023 Mann-Whitney p = 0.06 αB =α/2=0.025
  • 16.
    Projects DD (different processes) Kruskal-Wallis p = 0.001 Std Group N Mean Median Dev Unstructured Cowboy dev 4 6.0 5.8 3.4 Agile (scrum) 6 4.9 3.4 3.2 Software Water Fall 10 4.1 4.0 0.9 Process Rational Unified Process 7 2.7 2.8 1.1 Team Software Process 4 2.2 2.2 1.1 Hybrid Process 5 0.8 0.7 0.7
  • 17.
    Projects DD (pairwise differences) Mann-Whitney p = 0.0027 αB =α/15=0.003
  • 18.
    Conclusions No significant DDdifference between projects assessed under CMMI and not assessed. Significant DD difference among projects developed under different CMMI levels but apparently only between Level 1 and Level 3 Significant DD difference among projects adopting different software process types but apparently only between Waterfall and Hybrid
  • 19.

Editor's Notes

  • #14 We test the hypothesis H0 0 with Mann-Whitney test for differences. The test reports a p-value = 0.7013 which is above the  threshold. Therefore, we cannot reject the null hypothesis, Meaning, there is no significant difference of DD between the projects certified under CMMI and those not assessed.
  • #15 To test H1 0 we select the Kruskal-Wallis test. The test reports a p-value = 0.009, which is below the  threshold. Therefore, we can reject the null hypothesis. Meaning there is a difference in terms of DD among projects developed under different CMMI levels.
  • #16 We test the H1.1 0 for the two possible adjacent pairs of CMMI levels, i.e. (CMMI 1, CMMI 3), (CMMI 3, CMMI 5) by means of the Mann-Whitney test. Adopted an  divided by 2 (0.025) according to the Bonferroni rule. (CMMI 3, CMMI 5) we obtained the p-value 0.06, which is larger than 0.025, therefore we cannot reject the corresponding null hypotheses. (CMMI 1, CMMI 3) the p-value is 0.023, therefore we can reject the null hypothesis. Significant difference can be considered large (Cohen’s d = 1.14), CMMI 3 projects have a DD that is on average 1.2 defects per KLoC smaller than CMMI 1 projects.
  • #17 To test H2 0 we selected Kruskal-Wallis test. The test reports a p-value = 0.001, which is below the  threshold. Therefore, we can reject the null hypothesis. Given the above result, we precede with the pair wise comparisons. We test the H2.1 0 for all possible pairs of software processes by Mann-Whitney test.
  • #18 We adopted an  divided by 15 according to the Bonferroni rule. For all pairs except (Waterfall, Hybrid) we obtained p-values &gt; 0.003, therefore we cannot reject the corresponding null hypotheses. For (Waterfall, Hybrid) we obtained p–value = 0.0027 &lt; (0.003) therefore we can reject the corresponding null hypothesis indicating that they have statistical different DD.