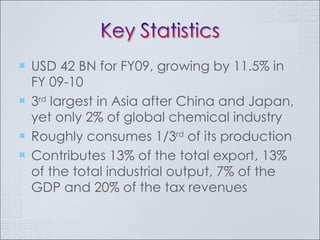
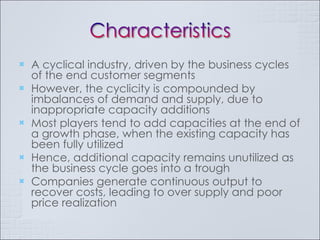
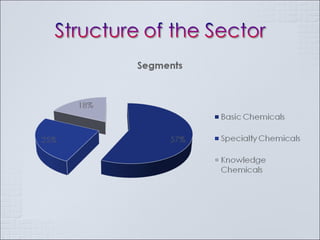
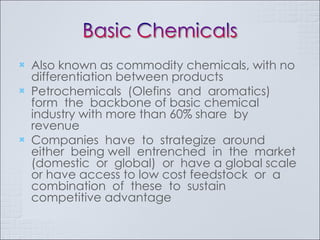
Rahul Ajit
USD 42 BN for FY09, growing by 11.5% in FY 09-10 3 rd  largest in Asia after China and Japan, yet only  2% of global chemical industry Roughly consumes 1/3 rd  of its production Contributes  13% of the total export, 13% of the total industrial output, 7% of the GDP and  20% of the tax revenues
A cyclical industry, driven by the business cycles of the end customer segments However, the cyclicity is compounded by imbalances of demand and supply, due to inappropriate capacity additions Most players tend to add capacities at the end of a growth phase, when the existing capacity has been fully utilized Hence, additional capacity remains unutilized as the business cycle goes into a trough Companies generate continuous output to recover costs, leading to over supply and poor price realization
 
Also known as commodity chemicals, with no differentiation between products Petrochemicals  (Olefins  and  aromatics)  form  the  backbone of basic chemical industry with more than 60% share  by  revenue Companies  have  to  strategize  around  either  being well  entrenched  in  the  market  (domestic  or  global)  or  have a global scale or have access to low cost feedstock  or  a  combination  of  these  to  sustain  competitive advantage
 
Also known as Performance Chemicals  Low in volume, but high in value Market size – USD 860 MN, growing at 10 -12% pa Consists of Paint, Adhesives, Electronic Chemicals, Water Management Chemicals, Flavors and fragrances, Sealants and Coatings, Catalysts, Industrial Cleaners and Fine Chemicals
 
 
Domestic pharma market was  estimated  to  be  USD  7.5  BN  in  FY2009 and have a CAGR of 14.0% during the period FY 2008-09 to FY2013-14.  Besides domestic  sales, export of generic drugs  and  active  pharmaceutical  ingredients  by  Indian companies  adds  another  USD  11  to12  BN to  the pharma  market.  Similarly  the  domestic  agrochemical  market was estimated  to be USD 900 MN  in FY2008-09  with  another  USD  300-400  MN  exports.  The  domestic  agrochemical  market  is  expected  to  have  a modest  CAGR  of  7.5%  during  the  next  four-five  years.


The chemical sector

  • 1.
  • 2.
    USD 42 BNfor FY09, growing by 11.5% in FY 09-10 3 rd largest in Asia after China and Japan, yet only 2% of global chemical industry Roughly consumes 1/3 rd of its production Contributes 13% of the total export, 13% of the total industrial output, 7% of the GDP and 20% of the tax revenues
  • 3.
    A cyclical industry,driven by the business cycles of the end customer segments However, the cyclicity is compounded by imbalances of demand and supply, due to inappropriate capacity additions Most players tend to add capacities at the end of a growth phase, when the existing capacity has been fully utilized Hence, additional capacity remains unutilized as the business cycle goes into a trough Companies generate continuous output to recover costs, leading to over supply and poor price realization
  • 4.
  • 5.
    Also known ascommodity chemicals, with no differentiation between products Petrochemicals (Olefins and aromatics) form the backbone of basic chemical industry with more than 60% share by revenue Companies have to strategize around either being well entrenched in the market (domestic or global) or have a global scale or have access to low cost feedstock or a combination of these to sustain competitive advantage
  • 6.
  • 7.
    Also known asPerformance Chemicals Low in volume, but high in value Market size – USD 860 MN, growing at 10 -12% pa Consists of Paint, Adhesives, Electronic Chemicals, Water Management Chemicals, Flavors and fragrances, Sealants and Coatings, Catalysts, Industrial Cleaners and Fine Chemicals
  • 8.
  • 9.
  • 10.
    Domestic pharma marketwas estimated to be USD 7.5 BN in FY2009 and have a CAGR of 14.0% during the period FY 2008-09 to FY2013-14. Besides domestic sales, export of generic drugs and active pharmaceutical ingredients by Indian companies adds another USD 11 to12 BN to the pharma market. Similarly the domestic agrochemical market was estimated to be USD 900 MN in FY2008-09 with another USD 300-400 MN exports. The domestic agrochemical market is expected to have a modest CAGR of 7.5% during the next four-five years.
  • 11.
  • 12.
  • 13.
  • 14.
  • 15.
  • 16.
  • 17.
  • 18.

Editor's Notes

  • #7 Inorganics growing at approximately 10% CAGR, and performance plastics at 9%. (Top)
  • #9 The demand for specialty chemicals industry is driven by a wide range of end use industries. The global economic slowdown has impacted adversely the growth of the key consumer industries and consequently the specialty chemicals industry in India. Chemicals being supplied to consumer industries with relatively higher export dependence e.g. Textiles witnessed a much steeper decline in growth as compared to chemicals for industries like paper where domestic demand has a predominant share in the overall demand.
  • #10 Characterized by a high degree of research, intellectual capital, and skilled manpower Relies extensively on R&D for new products, hence it is capital intensive and requires economies of scale for profitability Biotechnology is expected to be the main driver of this segment in the future
  • #12 Cyclical Hydrocarbons are those that are shaped in a ring formation. Acrylic Hydrocarbons are used for plastic and related products manufacture (Acrylic). Mono =1 Carboxylic acids are organic acids. Polycarbonates again have application in plastic related manufacture. Propylene and ethylene and polypropylene again, are connected to the plastic industry. India’s main exports are to the US (11%) and China (9%).