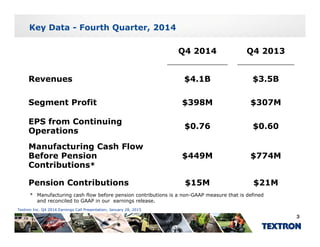
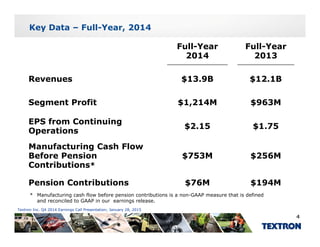
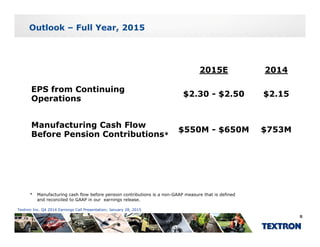
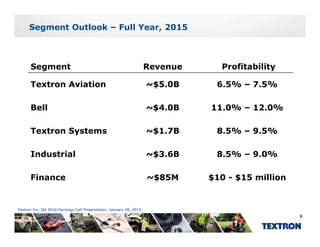
Q4 2014 Earnings Call Presentation
January 28, 2015
The data in this package should be read in conjunction with the Textron earnings release and accompanying tables.
Textron Inc. Q4 2014 Earnings Call Presentation; January 28, 2015
Forward-Looking Information
Certain statements in this package and other oral and written
statements made by Textron from time to time are forward-looking
statements, including those that discuss strategies, goals, outlook or
other non-historical matters; or project revenues, income, returns orother non historical matters; or project revenues, income, returns or
other financial measures. These forward-looking statements speak only
as of the date on which they are made, and we undertake no obligation
to update or revise any forward-looking statements. These forward-
looking statements are subject to risks and uncertainties that maylooking statements are subject to risks and uncertainties that may
cause actual results to differ materially from those contained in the
statements, including the risks and uncertainties set forth under
"Forward-Looking Information" in our fourth quarter 2014 earnings
l Additi l i f ti i k d t i ti th trelease. Additional information on risks and uncertainties that may
impact forward-looking statements is discussed under "Risk Factors" in
our most recent Annual Report on Form 10-K and our Quarterly Reports
on Form 10-Q.
Textron Inc. Q4 2014 Earnings Call Presentation; January 28, 2015
2
Key Data - Fourth Quarter, 2014
Q4 2014 Q4 2013
R $4 1B $3 5BRevenues $4.1B $3.5B
Segment Profit $398M $307M
EPS from Continuing
Operations
$0.76 $0.60
Manufacturing Cash Flow
Before Pension
Contributions*
$449M $774M
Pension Contributions $15M $21M
* Manufacturing cash flow before pension contributions is a non-GAAP measure that is defined
and reconciled to GAAP in our earnings release
Textron Inc. Q4 2014 Earnings Call Presentation; January 28, 2015
3
and reconciled to GAAP in our earnings release.
Key Data – Full-Year, 2014
Full Year Full YearFull-Year
2014
Full-Year
2013
R $13 9B $12 1BRevenues $13.9B $12.1B
Segment Profit $1,214M $963M
EPS from Continuing
Operations
$2.15 $1.75
Manufacturing Cash Flow
Before Pension
Contributions*
$753M $256M
Pension Contributions $76M $194M
* Manufacturing cash flow before pension contributions is a non-GAAP measure that is defined
and reconciled to GAAP in our earnings release
Textron Inc. Q4 2014 Earnings Call Presentation; January 28, 2015
4
and reconciled to GAAP in our earnings release.
Textron Consolidated Net Debt
($ millions)($, millions)
20 20 3YE 2014 YE 2013
Cash $822 $1,211
TFC Managed Debt 1,063 1,256
TXT Debt 2,811 1,931
Total Debt 3 874 3 187Total Debt 3,874 3,187
Net Debt $3,052 $1,976
Textron Inc. Q4 2014 Earnings Call Presentation; January 28, 2015
5
Finance Segment Credit Statistics
($, millions)
4Q14 3Q14
($, millions)
60+ Delinquency $57 $70
Non-accrual $81 $101
Finance Receivables $1,254 $1,329
Shareholder’s Equity $224 $219
Textron Inc. Q4 2014 Earnings Call Presentation; January 28, 2015
6
Q4 2014 Sales Growth
Sales
Growth
M&A
Impact
Core
Sales
Growth
FX
Impact
Unfav./
( )
Organic
Growth
Before
Growth
(Fav.) FX
Textron Aviation 64.7% (60.3%) 4.4% - 4.4%
B ll (22 1%) (22 1%) (22 1%)Bell (22.1%) - (22.1%) - (22.1%)
Textron Systems 51.8% (7.5%) 44.3% - 44.3%
Industrial 11.5% (5.8%) 5.7% 3.1% 8.8%
Manufacturing 17.1% (18.2%) (1.1%) 0.7% (0.4%)
Finance (15.4%) - (15.4%) - (15.4%)
Total Segments 16.8% (18.0%) (1.2%) 0.7% (0.5%)
Textron Inc. Q4 2014 Earnings Call Presentation; January 28, 2015
7
Outlook – Full Year, 2015
2015E 2014
EPS from Continuing
Operations
$2.30 - $2.50 $2.15
Manufacturing Cash Flow
Before Pension Contributions*
$550M - $650M $753M
* Manufacturing cash flow before pension contributions is a non-GAAP measure that is defined
and reconciled to GAAP in our earnings release.
Textron Inc. Q4 2014 Earnings Call Presentation; January 28, 2015
8
g
Segment Outlook – Full Year, 2015
Segment Revenue Profitability
Textron Aviation ~$5.0B 6.5% – 7.5%
Bell ~$4 0B 11 0% – 12 0%Bell ~$4.0B 11.0% – 12.0%
Textron Systems ~$1.7B 8.5% – 9.5%
Industrial ~$3.6B 8.5% – 9.0%
Finance ~$85M $10 - $15 million
Textron Inc. Q4 2014 Earnings Call Presentation; January 28, 2015
9
Pension Outlook – Full Year, 2015
2015E 2014
Discount Rates 4.25% 5.0%Discount Rates 4.25% 5.0%
Total Pension Cost ~$150M $128M
Assumed Long-Term Rate of
Return
7.75% 7.75%
Pension Contributions ~$80M $76M
Textron Inc. Q4 2014 Earnings Call Presentation; January 28, 2015
10
Outlook – Full Year, 2015
2015E 2014
R&D
% of Mfg Revenues
~$600M
4.2%
$556M
4.0%
CapEx ~$475M $429M
Depreciation ~$400M $379M
Textron Inc. Q4 2014 Earnings Call Presentation; January 28, 2015
11
Outlook – Full Year, 2015
2015E 2014
Corporate Expenses ~$175M $161M
Interest Expense, net for
Manufacturing group
~$135M $148M
Tax Rate (from continuing
30 0% 29 %
Tax Rate (from continuing
operations)
~30.0% 29.1%
Textron Inc. Q4 2014 Earnings Call Presentation; January 28, 2015
12

Textron - Q414 earnings presentation

  • 1.
    Q4 2014 EarningsCall Presentation January 28, 2015 The data in this package should be read in conjunction with the Textron earnings release and accompanying tables. Textron Inc. Q4 2014 Earnings Call Presentation; January 28, 2015
  • 2.
    Forward-Looking Information Certain statementsin this package and other oral and written statements made by Textron from time to time are forward-looking statements, including those that discuss strategies, goals, outlook or other non-historical matters; or project revenues, income, returns orother non historical matters; or project revenues, income, returns or other financial measures. These forward-looking statements speak only as of the date on which they are made, and we undertake no obligation to update or revise any forward-looking statements. These forward- looking statements are subject to risks and uncertainties that maylooking statements are subject to risks and uncertainties that may cause actual results to differ materially from those contained in the statements, including the risks and uncertainties set forth under "Forward-Looking Information" in our fourth quarter 2014 earnings l Additi l i f ti i k d t i ti th trelease. Additional information on risks and uncertainties that may impact forward-looking statements is discussed under "Risk Factors" in our most recent Annual Report on Form 10-K and our Quarterly Reports on Form 10-Q. Textron Inc. Q4 2014 Earnings Call Presentation; January 28, 2015 2
  • 3.
    Key Data -Fourth Quarter, 2014 Q4 2014 Q4 2013 R $4 1B $3 5BRevenues $4.1B $3.5B Segment Profit $398M $307M EPS from Continuing Operations $0.76 $0.60 Manufacturing Cash Flow Before Pension Contributions* $449M $774M Pension Contributions $15M $21M * Manufacturing cash flow before pension contributions is a non-GAAP measure that is defined and reconciled to GAAP in our earnings release Textron Inc. Q4 2014 Earnings Call Presentation; January 28, 2015 3 and reconciled to GAAP in our earnings release.
  • 4.
    Key Data –Full-Year, 2014 Full Year Full YearFull-Year 2014 Full-Year 2013 R $13 9B $12 1BRevenues $13.9B $12.1B Segment Profit $1,214M $963M EPS from Continuing Operations $2.15 $1.75 Manufacturing Cash Flow Before Pension Contributions* $753M $256M Pension Contributions $76M $194M * Manufacturing cash flow before pension contributions is a non-GAAP measure that is defined and reconciled to GAAP in our earnings release Textron Inc. Q4 2014 Earnings Call Presentation; January 28, 2015 4 and reconciled to GAAP in our earnings release.
  • 5.
    Textron Consolidated NetDebt ($ millions)($, millions) 20 20 3YE 2014 YE 2013 Cash $822 $1,211 TFC Managed Debt 1,063 1,256 TXT Debt 2,811 1,931 Total Debt 3 874 3 187Total Debt 3,874 3,187 Net Debt $3,052 $1,976 Textron Inc. Q4 2014 Earnings Call Presentation; January 28, 2015 5
  • 6.
    Finance Segment CreditStatistics ($, millions) 4Q14 3Q14 ($, millions) 60+ Delinquency $57 $70 Non-accrual $81 $101 Finance Receivables $1,254 $1,329 Shareholder’s Equity $224 $219 Textron Inc. Q4 2014 Earnings Call Presentation; January 28, 2015 6
  • 7.
    Q4 2014 SalesGrowth Sales Growth M&A Impact Core Sales Growth FX Impact Unfav./ ( ) Organic Growth Before Growth (Fav.) FX Textron Aviation 64.7% (60.3%) 4.4% - 4.4% B ll (22 1%) (22 1%) (22 1%)Bell (22.1%) - (22.1%) - (22.1%) Textron Systems 51.8% (7.5%) 44.3% - 44.3% Industrial 11.5% (5.8%) 5.7% 3.1% 8.8% Manufacturing 17.1% (18.2%) (1.1%) 0.7% (0.4%) Finance (15.4%) - (15.4%) - (15.4%) Total Segments 16.8% (18.0%) (1.2%) 0.7% (0.5%) Textron Inc. Q4 2014 Earnings Call Presentation; January 28, 2015 7
  • 8.
    Outlook – FullYear, 2015 2015E 2014 EPS from Continuing Operations $2.30 - $2.50 $2.15 Manufacturing Cash Flow Before Pension Contributions* $550M - $650M $753M * Manufacturing cash flow before pension contributions is a non-GAAP measure that is defined and reconciled to GAAP in our earnings release. Textron Inc. Q4 2014 Earnings Call Presentation; January 28, 2015 8 g
  • 9.
    Segment Outlook –Full Year, 2015 Segment Revenue Profitability Textron Aviation ~$5.0B 6.5% – 7.5% Bell ~$4 0B 11 0% – 12 0%Bell ~$4.0B 11.0% – 12.0% Textron Systems ~$1.7B 8.5% – 9.5% Industrial ~$3.6B 8.5% – 9.0% Finance ~$85M $10 - $15 million Textron Inc. Q4 2014 Earnings Call Presentation; January 28, 2015 9
  • 10.
    Pension Outlook –Full Year, 2015 2015E 2014 Discount Rates 4.25% 5.0%Discount Rates 4.25% 5.0% Total Pension Cost ~$150M $128M Assumed Long-Term Rate of Return 7.75% 7.75% Pension Contributions ~$80M $76M Textron Inc. Q4 2014 Earnings Call Presentation; January 28, 2015 10
  • 11.
    Outlook – FullYear, 2015 2015E 2014 R&D % of Mfg Revenues ~$600M 4.2% $556M 4.0% CapEx ~$475M $429M Depreciation ~$400M $379M Textron Inc. Q4 2014 Earnings Call Presentation; January 28, 2015 11
  • 12.
    Outlook – FullYear, 2015 2015E 2014 Corporate Expenses ~$175M $161M Interest Expense, net for Manufacturing group ~$135M $148M Tax Rate (from continuing 30 0% 29 % Tax Rate (from continuing operations) ~30.0% 29.1% Textron Inc. Q4 2014 Earnings Call Presentation; January 28, 2015 12